Introduction
Landslides in certain regions of India, have been a frequent occurrence, and are further exacerbated by its unique geographic and climatic conditions. Between 2015 and 2022, over 3,700 major landslides were recorded, with 12.6% of the country’s land area prone to such disasters. The regions most affected include the northern states of Himachal Pradesh, Uttarakhand, parts of Jammu and Kashmir, the seven northeastern states, and the Western Ghats stretching through Maharashtra, Goa, and Kerala.
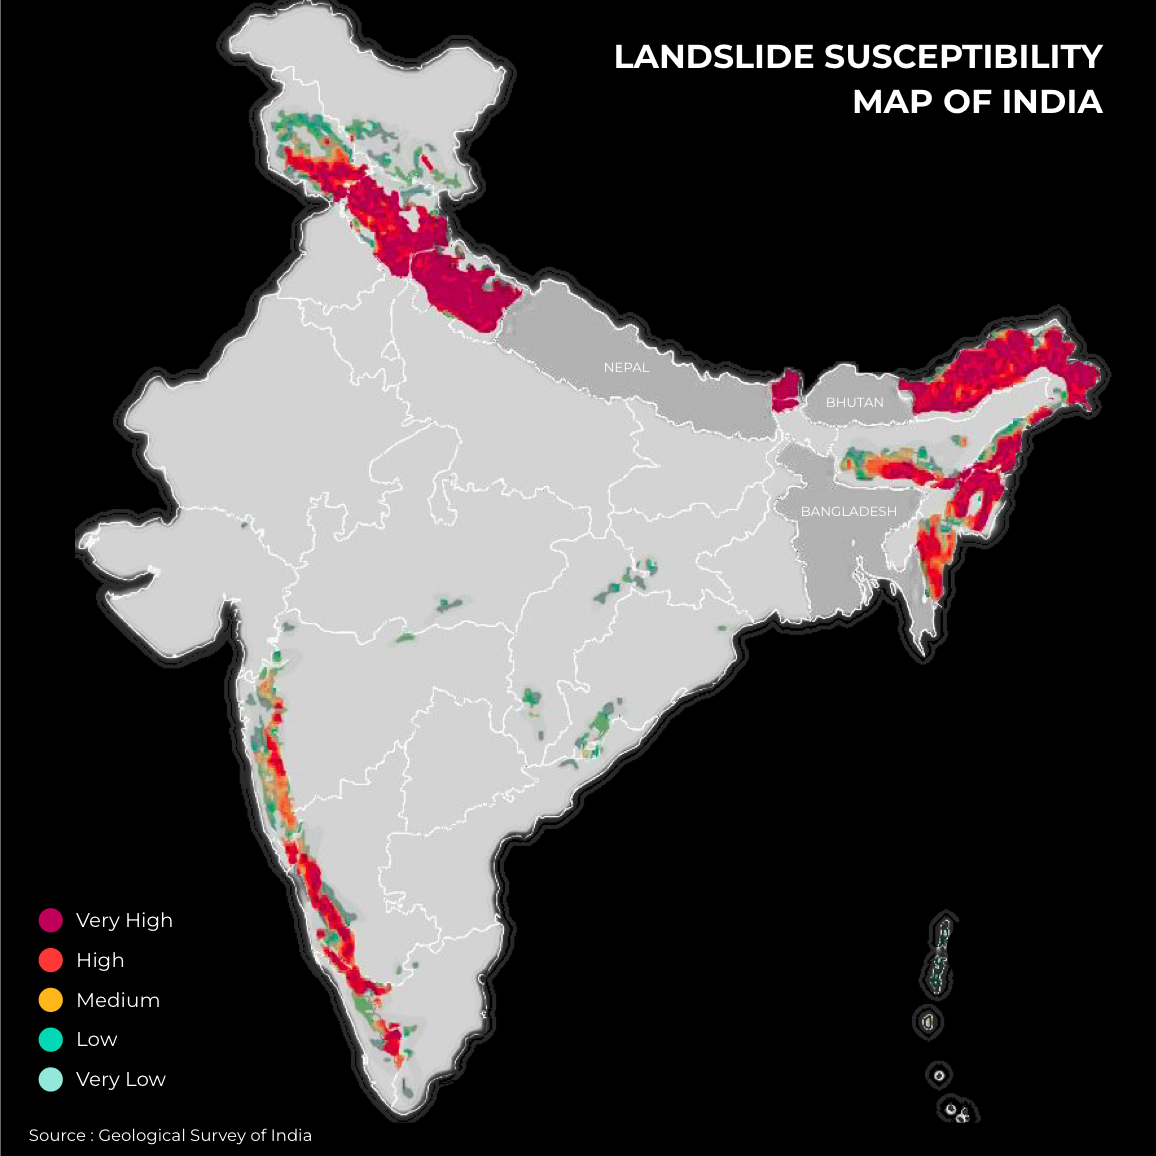
This blog explores how remote sensing and open data methodologies can enhance our understanding and management of landslide risks, focusing on scalability and reproducibility.
Role of Remote Sensing and Open Data
Remote sensing enables the collection of data over large areas without physical contact. This is especially valuable in regions like India, where the lack of robust open data infrastructure often hampers disaster management efforts.
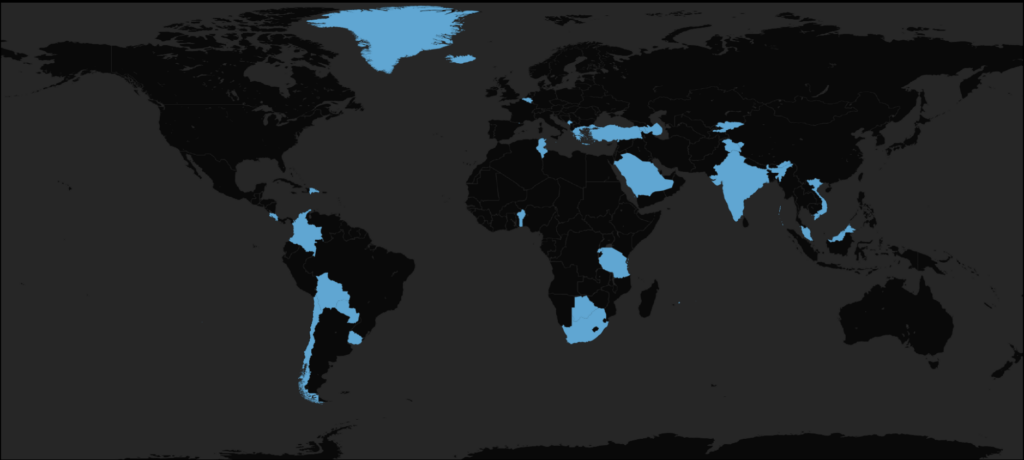
Open data, accessible without restrictions, bridges the gap between raw information and actionable insights. India, scoring between 51-60 on the Open Data Inventory Index, still has significant room for improvement compared to global standards. Leveraging remote sensing with open data can help address this gap.
Investigative Methodology
The research employs a structured approach:
- Dataset Granularity and Coverage: Identifying relevant datasets and exploring data format to understand granularity and coverage of data.
- Identification of Areas of Interest: Mapping regions with high landslide susceptibility, and calculating compounded risk as per identified factors.
- Regional Cause Factors: Understanding specific triggers, such as urbanization trends and land cover changes.
Landslide Susceptibility Map using Ensemble Machine Learning
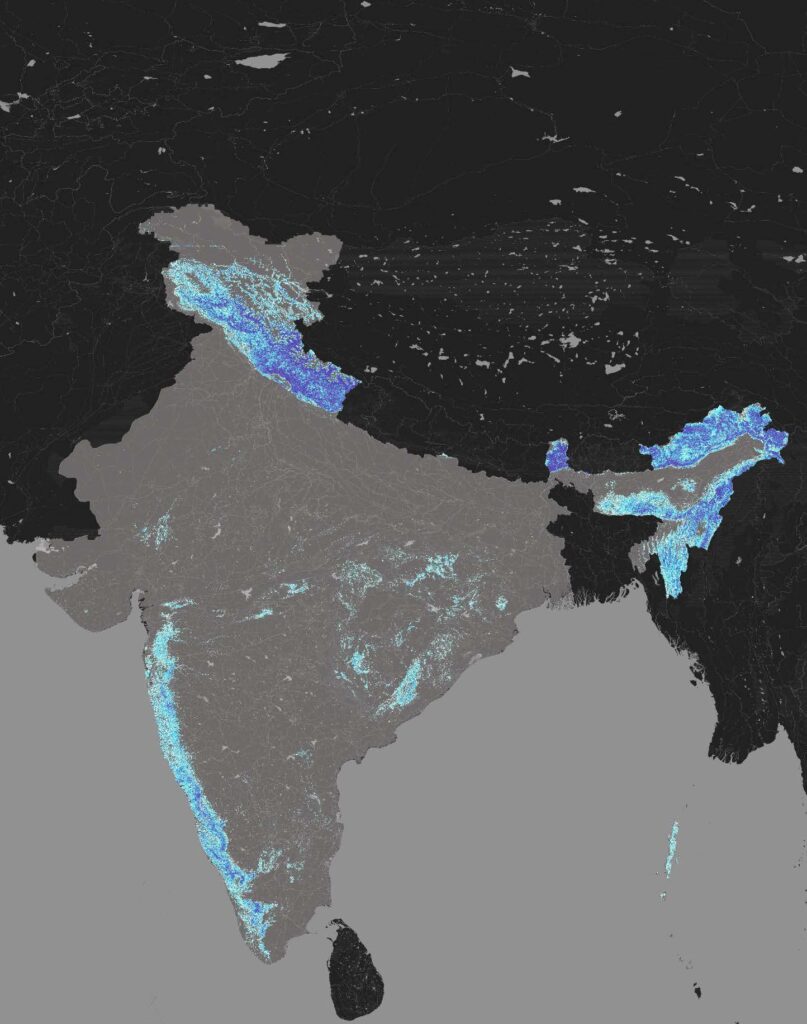
The landslide susceptibility map developed showcases high resolution of landslide susceptibility across India, based on the following methodology.
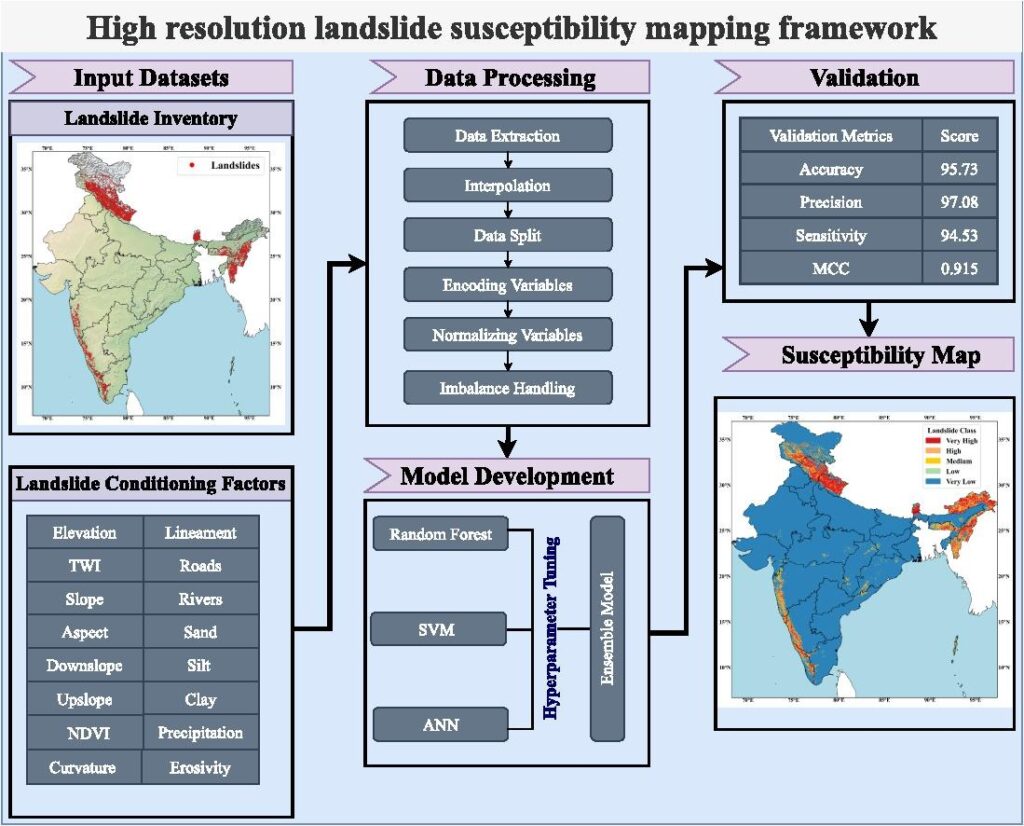
The research bases itself on the findings of the created map. By remapping the conditioning factors cross referenced to the susceptibility map, the research aims to draw a classification of landslides based on factors of origin and areas of impact. This would allow mapping of vulnerability of the identified susceptible areas.
Remotely Sensed Data [GEE]
This section, solely explores the identified datasets, so far and attempts to explain their nuances and granularity.
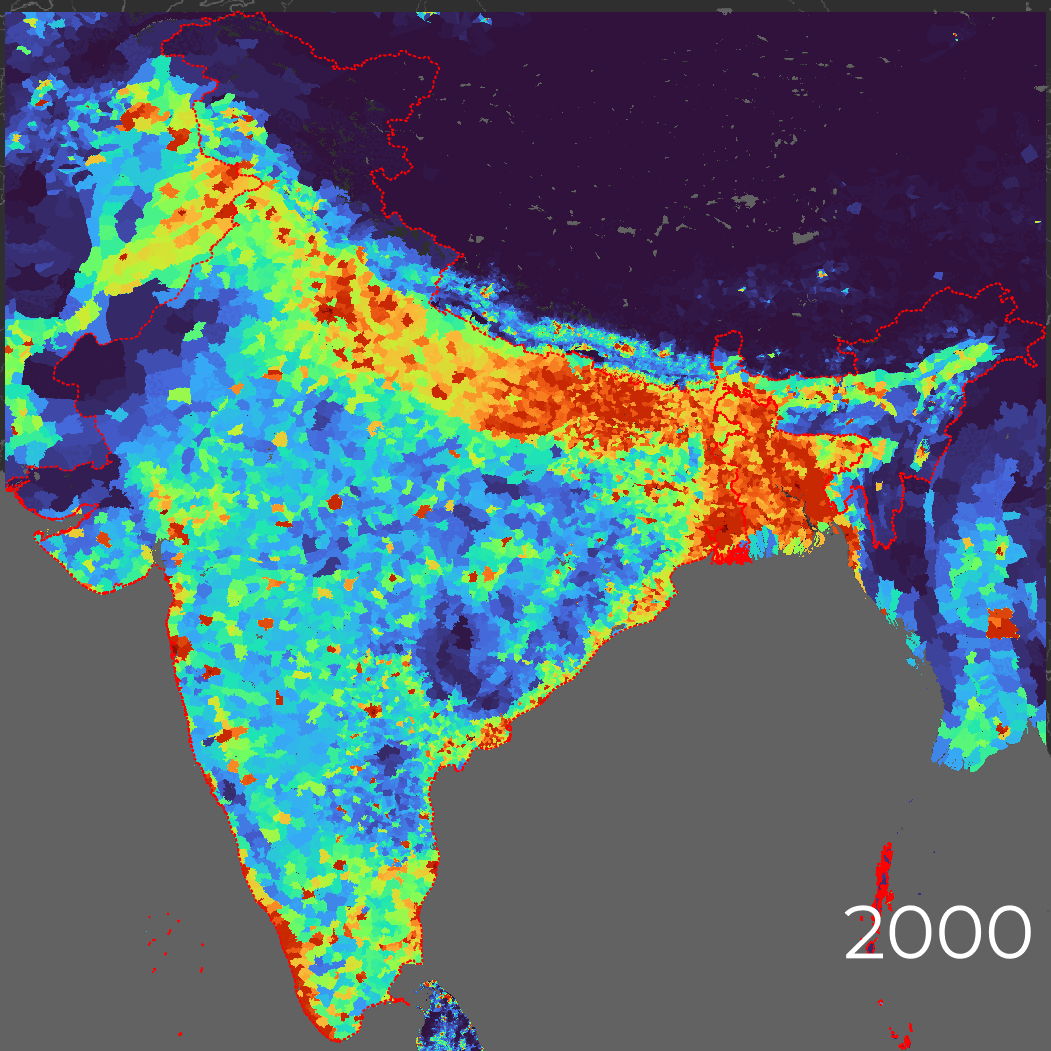
- Population Distribution
- Bands population_density
- Unit count per sq km.
- Resolution 1000 Meters (gridded cells)
- Frequency 5 Years
- Availability 2001 – 2020
- Shows estimated number of population per square km, gridded by administrative cells.
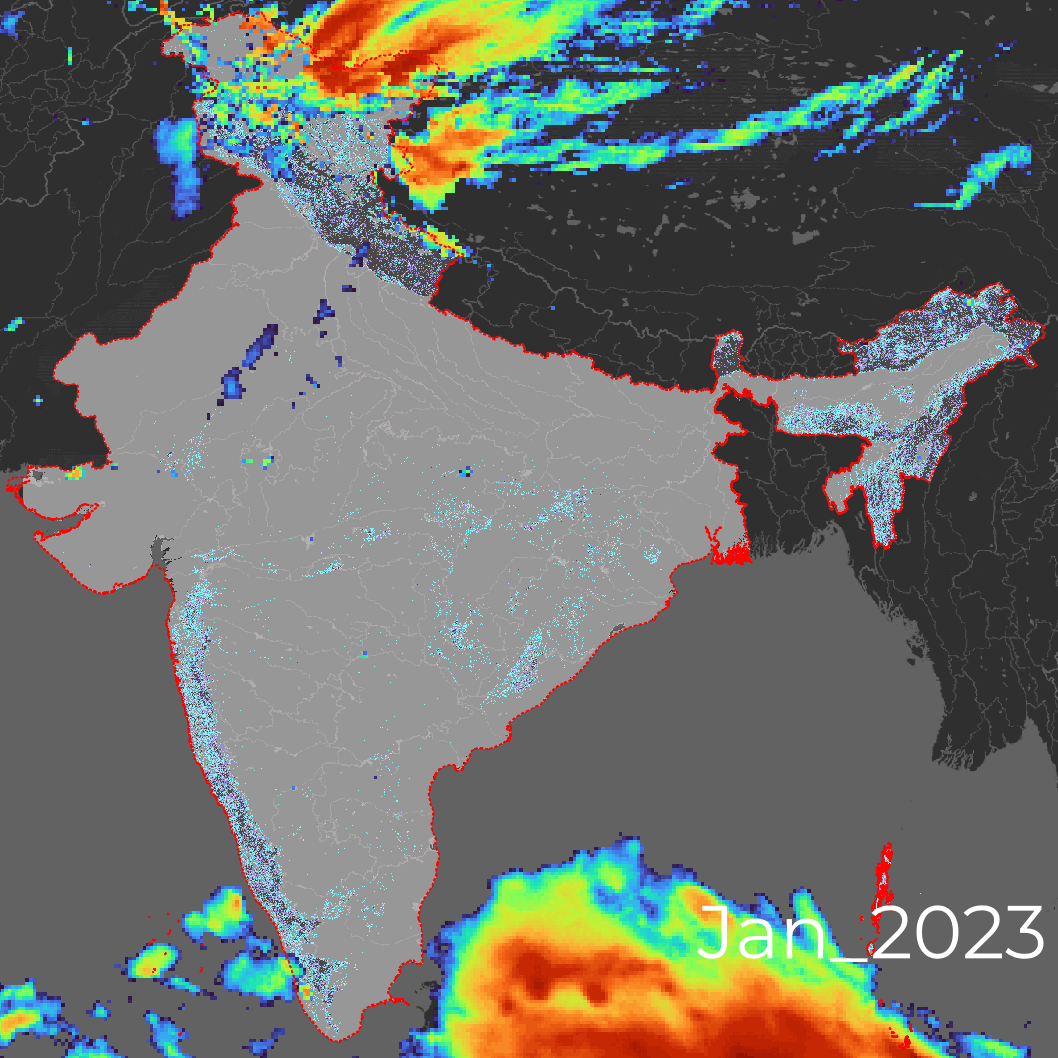
- Precipitation Rate
- Bands hourlyPrecipRate
- Unit mm / hr
- Resolution 11132 Meters
- Frequency Daily
- Availability 2014 – 2024
- Snapshots of hourly precipitation rates.
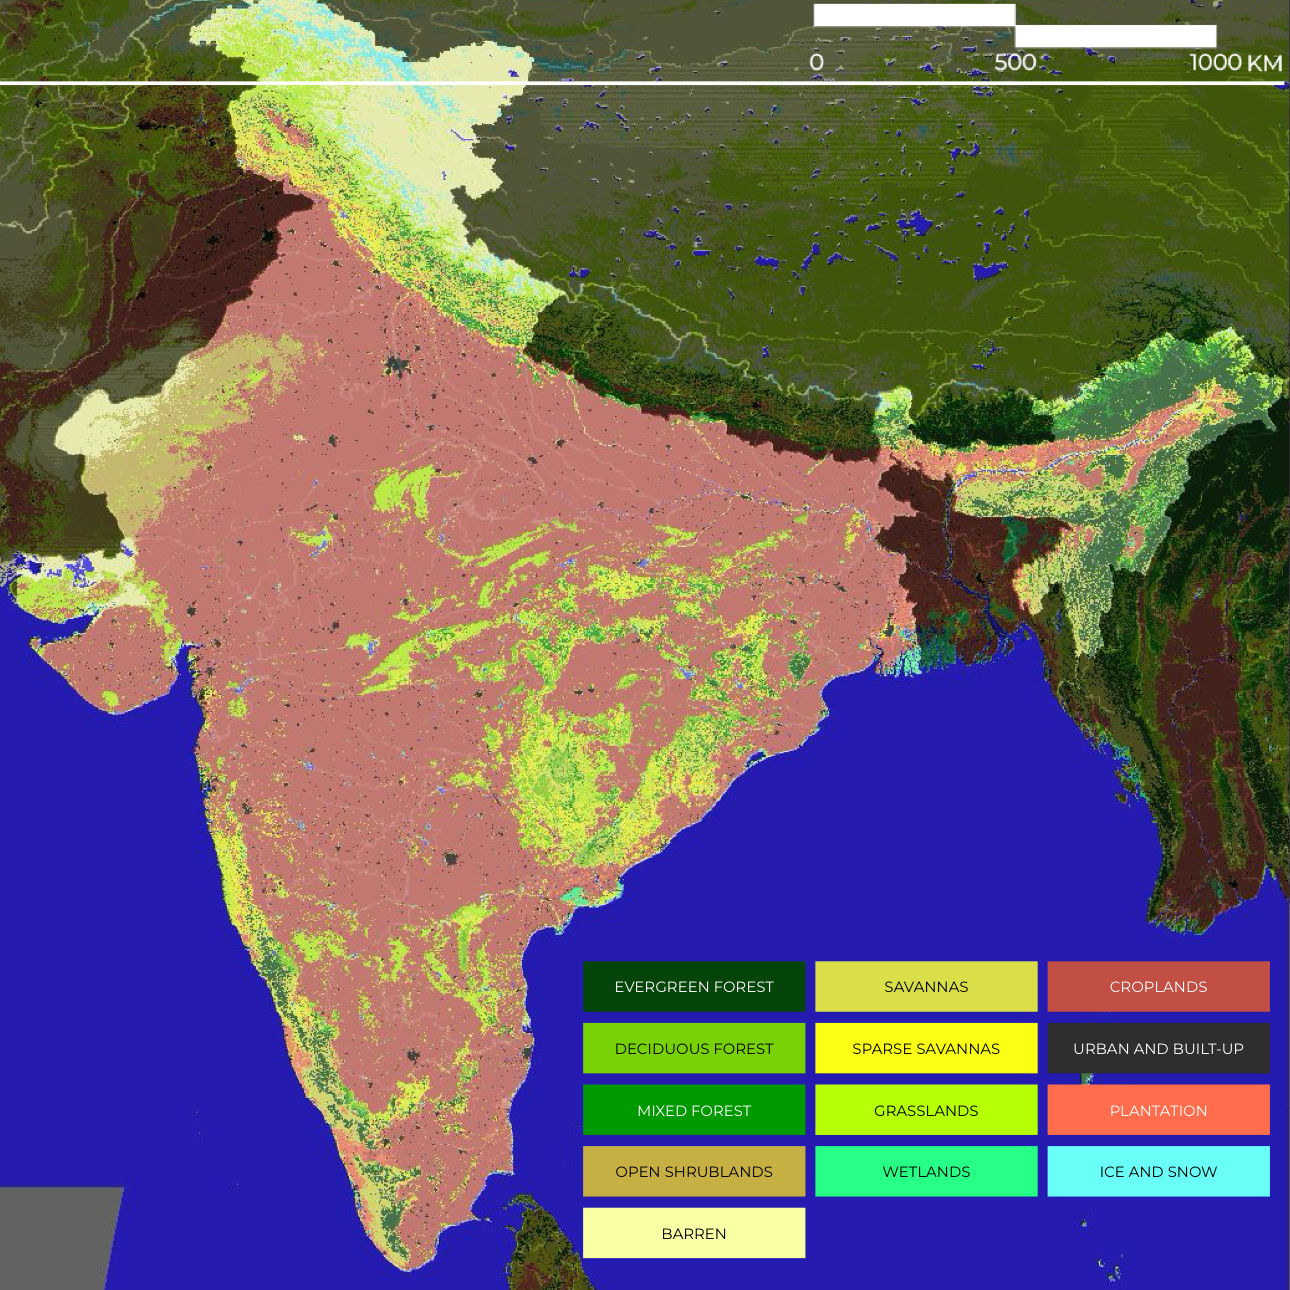
- Land Use and Land Cover (LULC)
- Bands LC_Type1
- Classes Classification bands based on IGBP.
- Resolution 500 Meters
- Frequency Yearly
- Availability 2001 – 2023
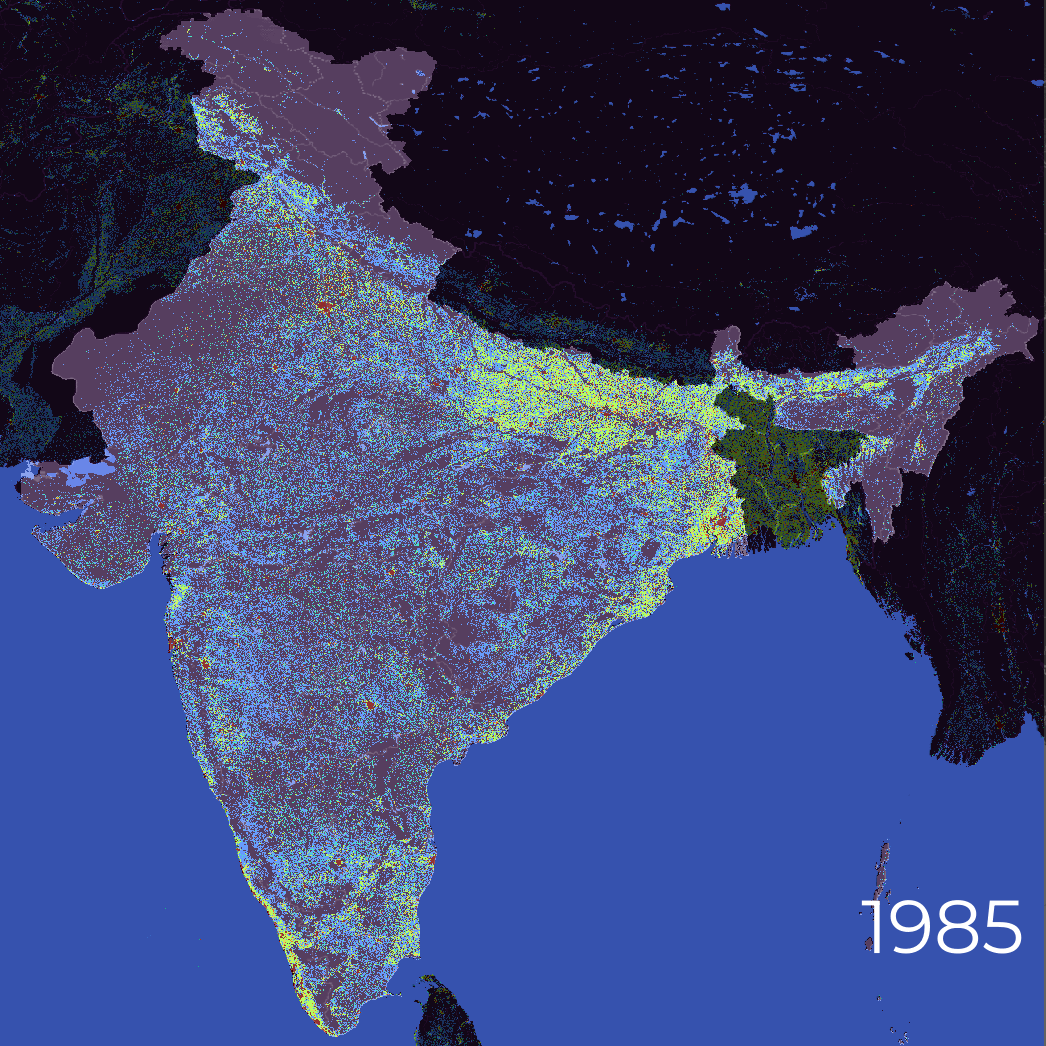
- Rate of Urbanisation
- Bands smod_code
- Classes density classification [rural – urban]
- Resolution 1000 Meters
- Frequency 5 Years
- Availability 1985 – 2030
Current Challenges
- Analysing high-resolution landslide susceptibility maps require significant memory, making analysis computationally intensive.
- Few datasets like road density, quarry areas, and others for additional insights are missing; proxies or alternatives need to be identified to drive better insights.
Next Steps
- Refine raster processing to improve efficiency and derive correlations between datasets and landslide maps to derive classifications of landslide events in India.
- Identify urban and peri-urban areas near susceptible zones for focused investigation.
- Obtain satellite imagery to analyze fault lines, land-use changes, and other features affecting susceptibility.
- Create workflows for efficient extraction of statistics to ensure reproducibility and scalability.

