
In this article, we explain our Workshop 1.2 project, in which we analyzed data to transform it into movements to control an ABB IRB 6700-150/3.20 industrial robot equipped with a plastic pellet extruder for additive manufacturing. The main idea of our project was to analyze climate data from the city of Barcelona during the years 2004 to 2024.
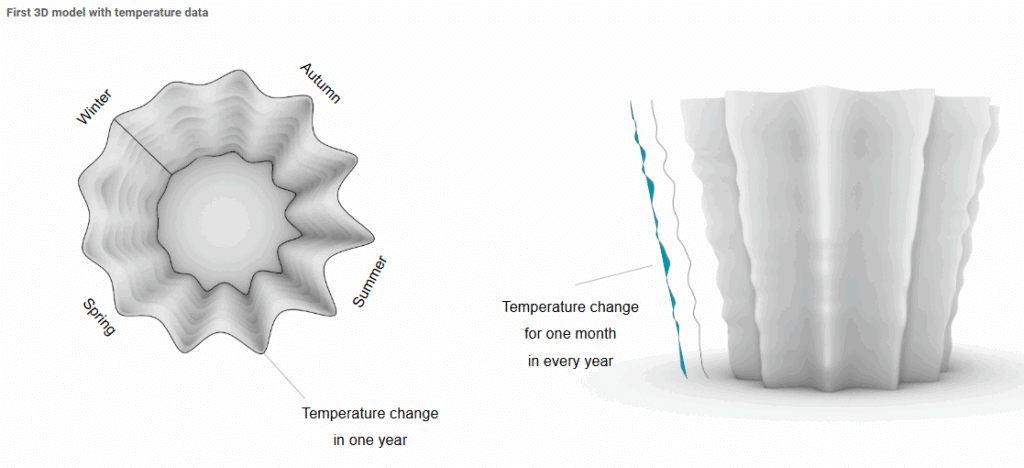
We began with a brainstorming session to define the visualization design and data organization strategy. Temperature was selected as the focal variable, with data collected from Barcelona covering the period from 2004 to 2024. The design concept employs a stratified approach: each year forms an individual layer, subdivided into 12 monthly intervals, with temperature values assigned to each corresponding monthly data point.

.
The resulting form resembled a vertical vase with subtle conical inclination. This prototype effectively visualized temperature patterns: summer months showed pronounced peaks (higher temperatures), while winter months exhibited flatter forms (lower temperatures), enabling immediate visual comprehension of annual thermal cycles.
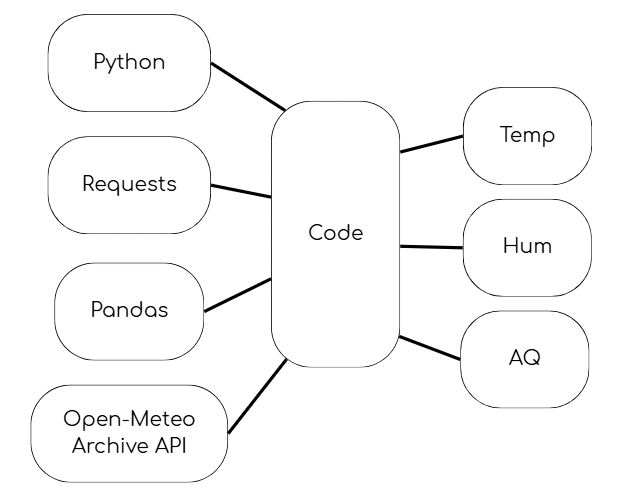
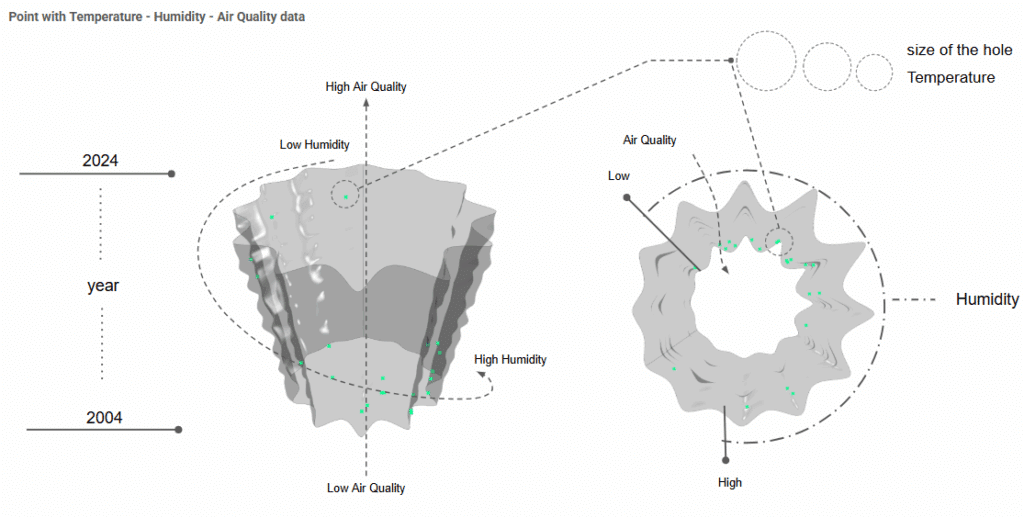
We expanded our scope by incorporating humidity and air quality data for a comprehensive environmental portrait of Barcelona. Finding complete datasets proved challenging, so we developed a custom Python script using Pandas and Requests libraries to retrieve temperature, humidity, and air quality measurements from 2004 to 2024.
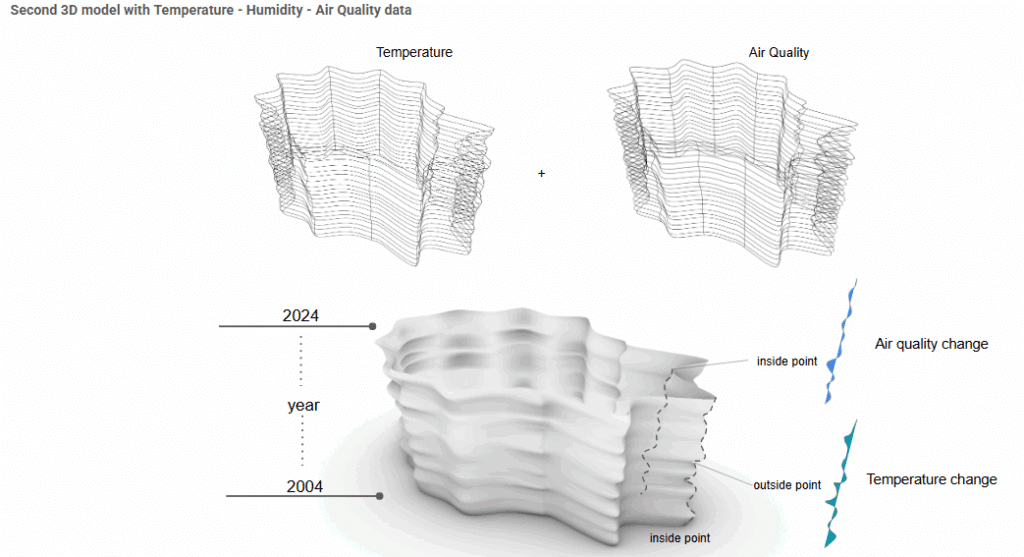
The script generated a well-organized CSV file compatible with our workflow. We processed the expanded dataset through the same algorithm, initially visualizing variables independently, then merging them along a single axis. We combined temperature and air quality into one form, with external peaks representing temperature and internal peaks representing air quality. This iteration produced results similar to our first design while introducing meaningful variations reflecting additional data layers.
We processed the expanded dataset through the same algorithm, initially visualizing variables independently, then merging them along a single axis. We combined temperature and air quality into one form, with external peaks representing temperature and internal peaks representing air quality. This iteration produced results similar to our first design while introducing meaningful variations reflecting additional data layers.
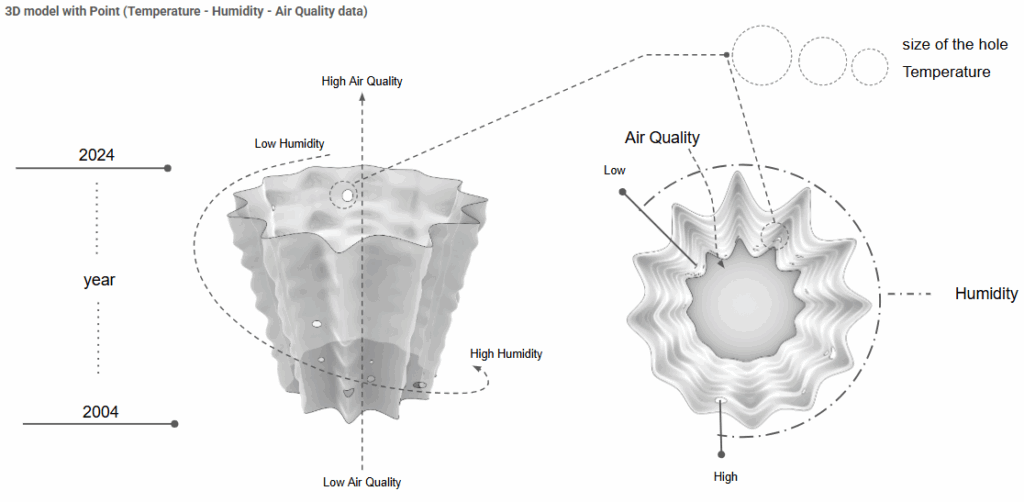
For our last iteration, we extracted points and transformed them into circular voids within the 3D object, creating perforations in the container’s surface. This geometry suggested a new interpretation: a lamp where perforations would allow light to pass through, creating patterns informed by the data’s principal components, adding both aesthetic and functional dimensions.
.
.
.
.
.
.
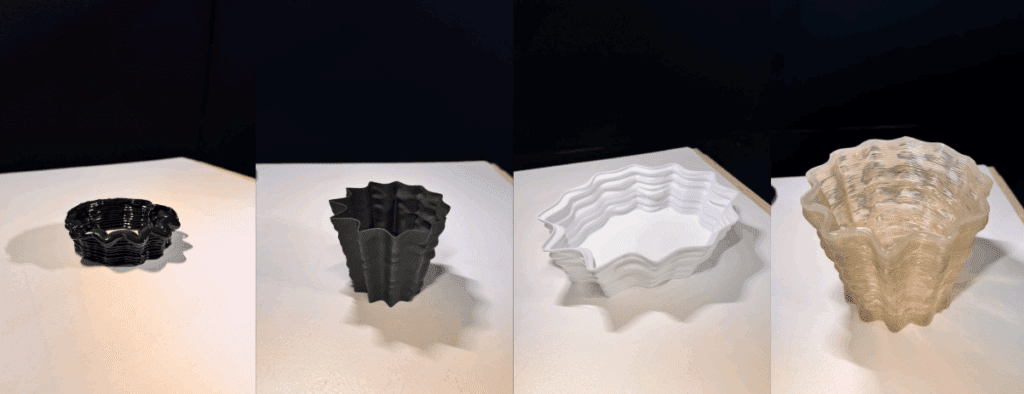
We printed a small-scale test of our first design using the robotic system with excellent results, though time constraints prevented full-scale completion. For our second prototype, we used a BAMBU LAB A1 desktop 3D printer with black PLA filament, successfully matching expectations. The third prototype was printed in white PLA. Time limitations prevented printing the third model.
.
.
.
This workshop provided profound insights into data analysis and physical translation. The ability to construct functional objects from data represents a powerful tool for understanding and communication. We believe these applications in architecture and engineering will enable remarkable results, solve emerging problems, and contribute to creating a better world through data-informed design.
