
Collaboration with University of Linz
Data to Motion: using PCA to represent laughter in a cup
The idea for our project was to capture the laughter shared in simple moments of joy and then use the data captured to edify and create vessels which would reflect these memories in their form.
The first conceptual proposal imagined a cup whose silhouette reflected laughter intensity:
Height responding to total laughter duration
Radial deformation influenced by frequency attractors
Surface variation emerging from temporal instability of the sound
This positioned the cup not only as a functional object but as an artefact of a social moment.
1. Concept-From Human Behaviour to Physical Artefact
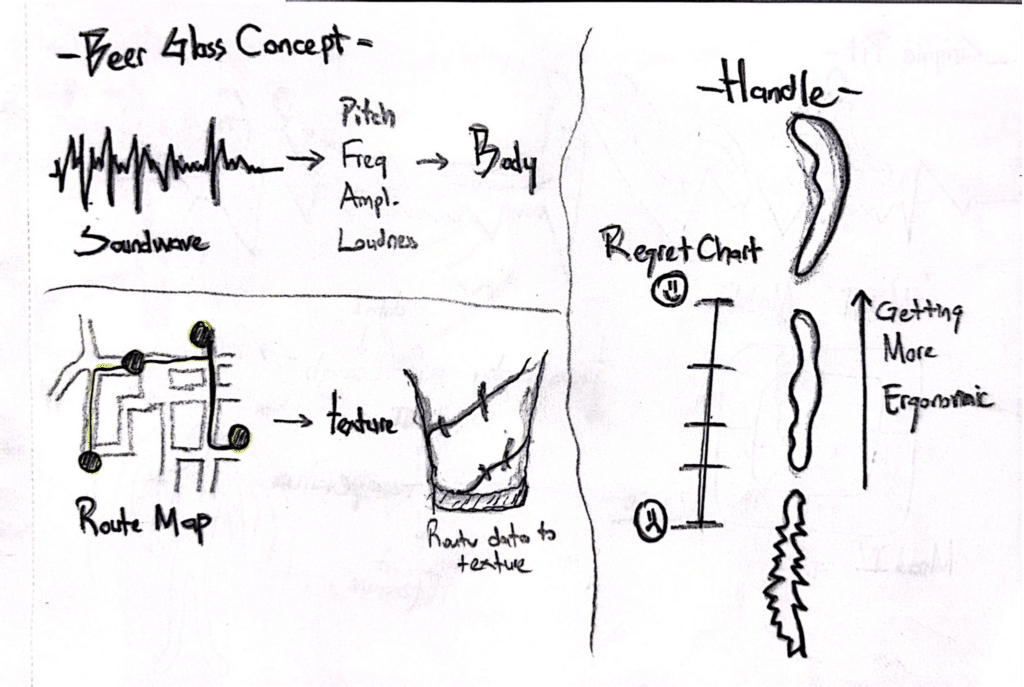
We began by questioning how emotional, ephemeral data (such as laughter) could be abstracted into a design driver. Rather than treating sound as a waveform to plot, we approached it as behavioural geometry, something capable of shaping volume, rhythm, and structural flow.
The first conceptual proposal imagined a cup whose silhouette reflected laughter intensity:
- Height responding to total laughter duration
- Radial deformation influenced by frequency attractors
- Surface variation emerging from temporal instability of the sound
This positioned the cup not only as a functional object but as an artefact of a social moment.
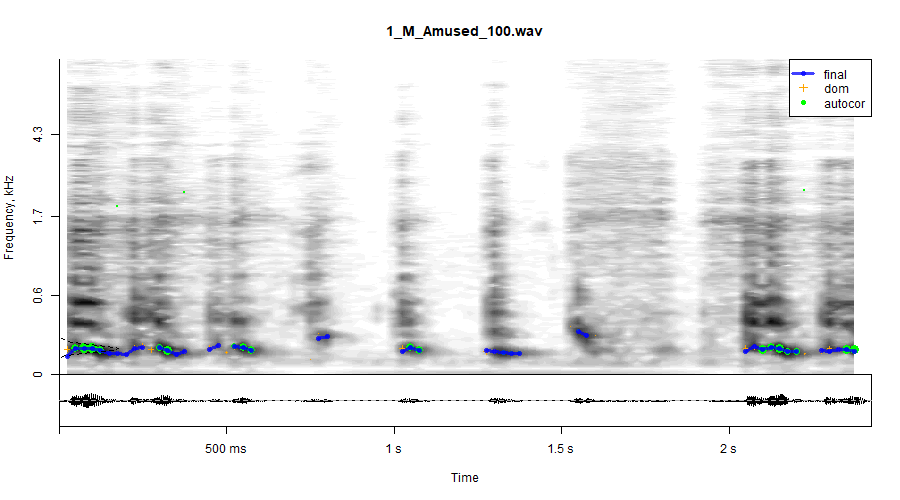
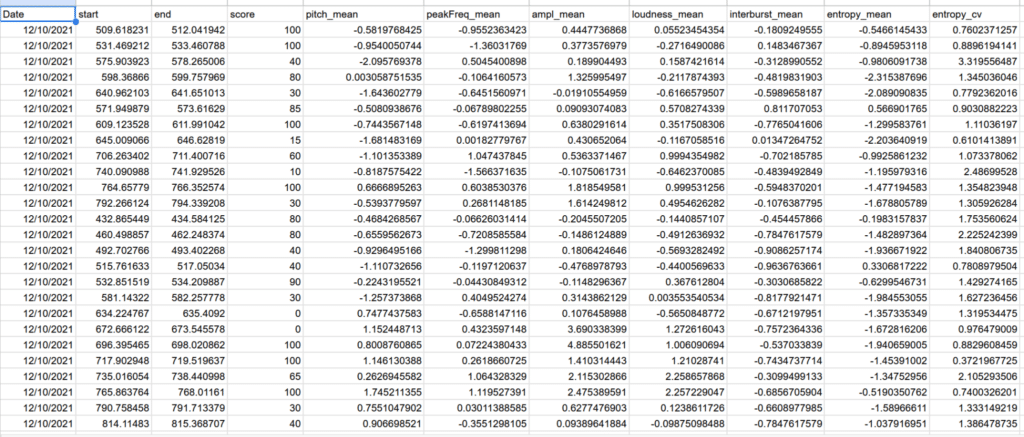
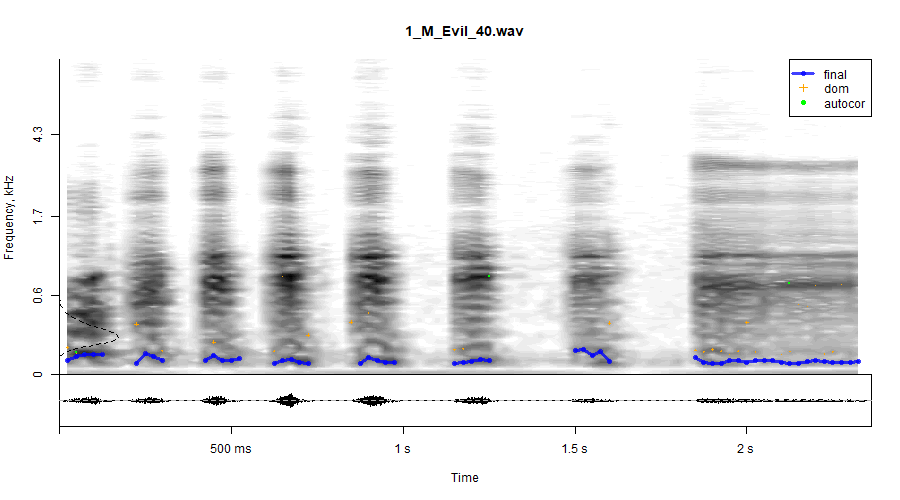
2. Working with Laughter Data-Parameter Extraction
We took data which recorded several types of laughter over 307 participants and then analysed this through various interpretations of laughter. In the end we cut this down to 6 forms of data to represent through PCA deformation on the cups.
- Pitch
- Amplitude
- Frequency
- Loudness (dB)
- Interburst Intervals
- Entropy (signal irregularity)
These values acted as geometric drivers in our parametric modelling workflow.
To understand multidimensional relationships, we applied Principal Component Analysis (PCA), allowing us to reduce the complex parameter space into meaningful axes that influenced form generation.
Cup 1
Cup 2
Cup 3
3. From Data to Geometry – Parametric Modelling Workflow
Our modelling process was built around curve generation and spatial stacking:
Step 1 – Generate Base Curves
Each curated laughter sample produced a 2D polyline where its deformation corresponded to the magnitude of selected parameters.
Step 2 – Build Vertical Stratification
Curves were stacked along the Z-axis, representing time or cumulative energy.
Step 3 – Circular Array Formation
To move beyond linear extrusion, we arranged curves in a circular rotational array, allowing the dataset to create volumetric density and internal voids.
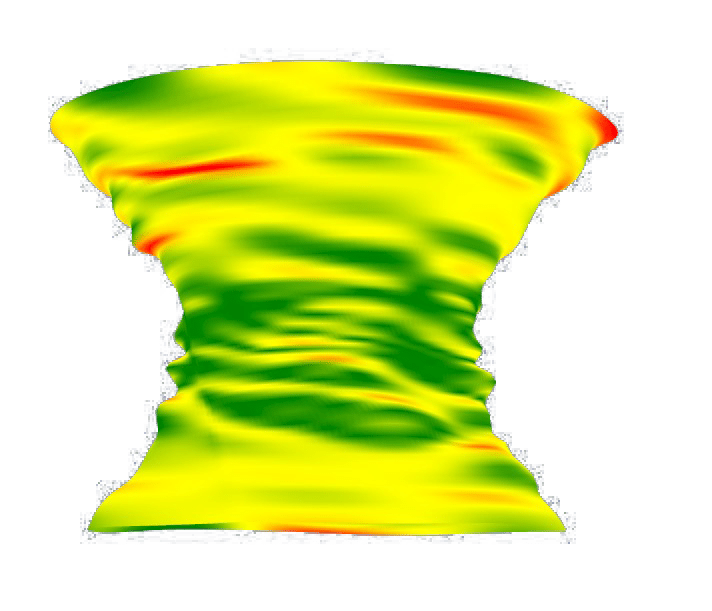
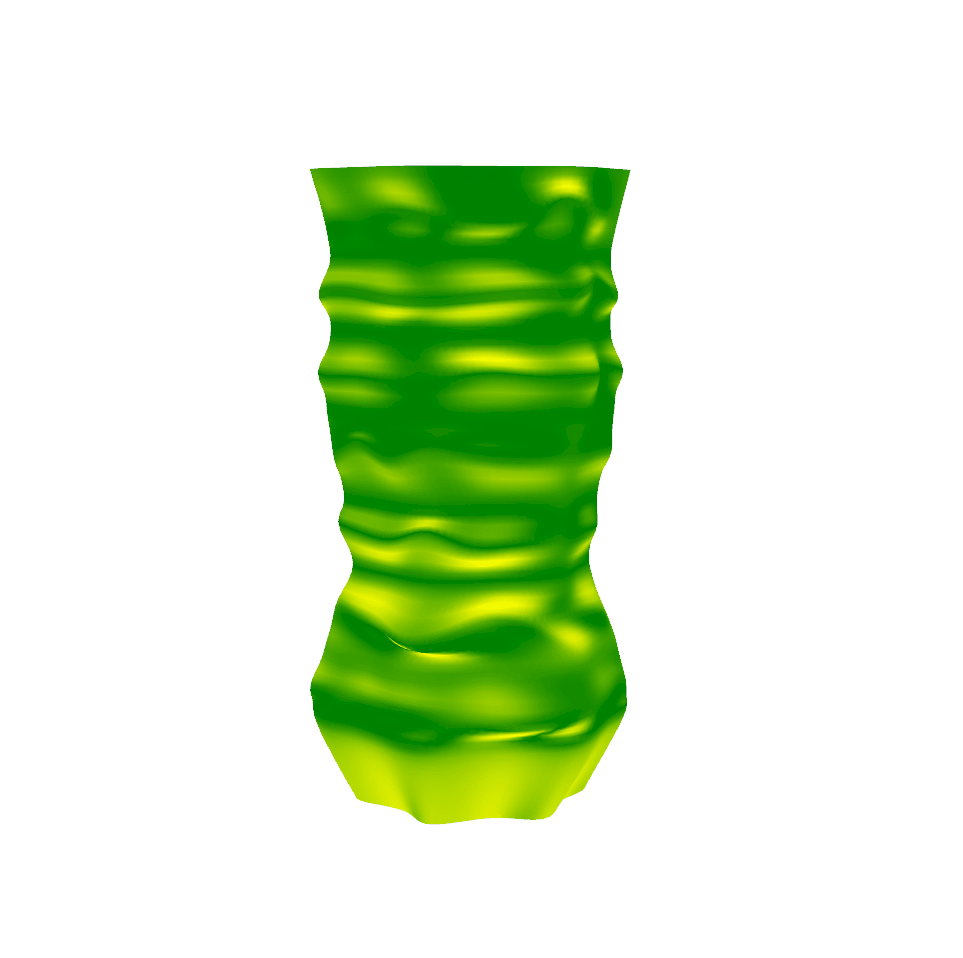
Step 4 – Loft into an Organic Body
Lofting the stacked curves produced a smooth, organic 3D surface somewhere between furniture scale and vessel scale, a hybrid of spatial and object oriented design.
This process transformed the laughter dataset into a volumetric artefact shaped by behaviour, intensity, and emotional irregularity.
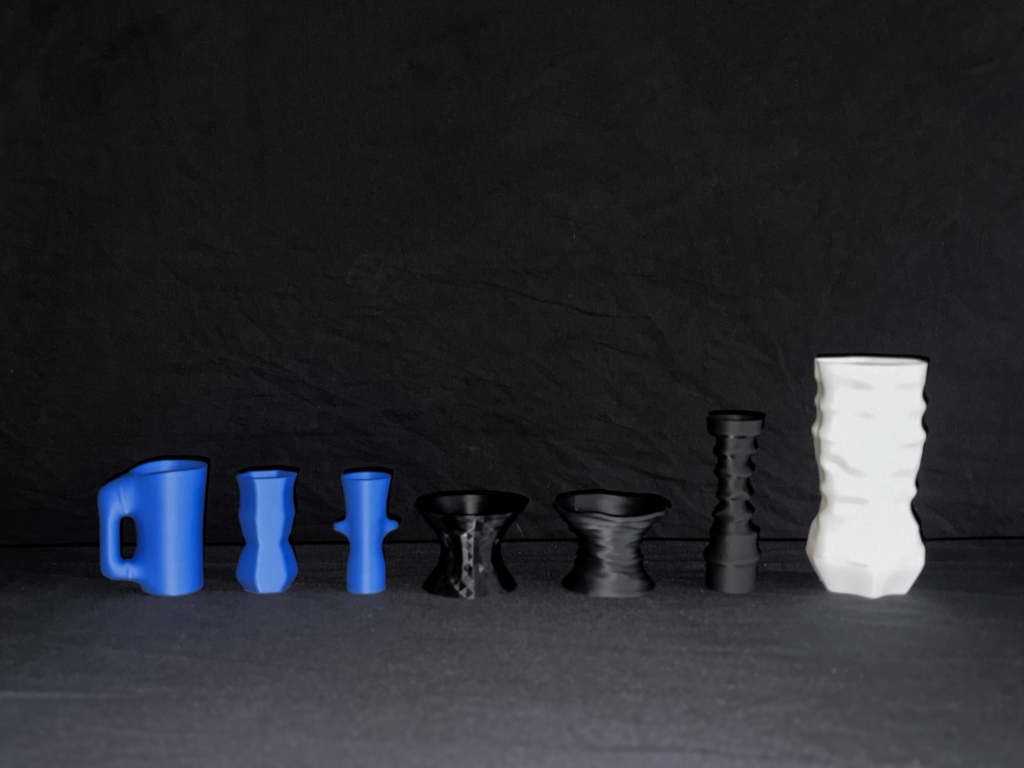
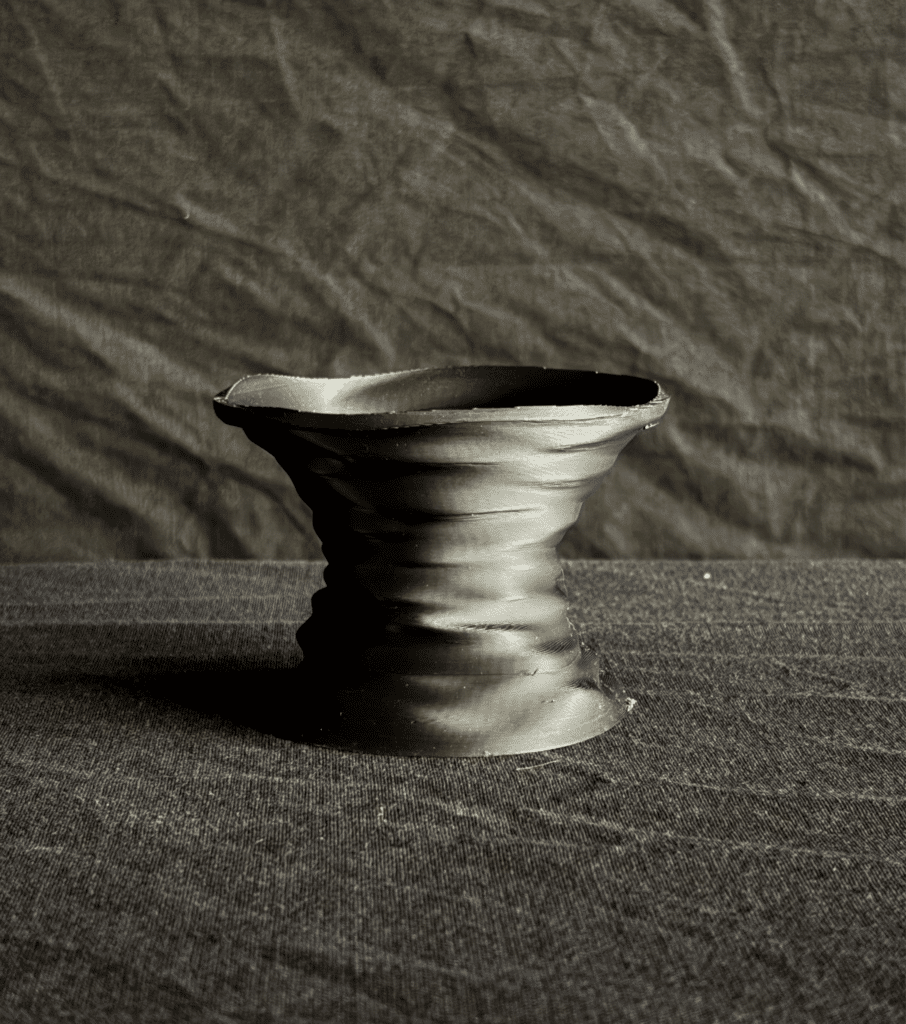
4. Evaluating the First Iterations – The Need for More Variation
Early prototypes revealed that the cup form, while elegant, produced similar silhouettes across different individuals.
The dataset was expressive, but the vessel typology constrained how much variation could emerge.
This led to a shift:
Rather than forcing the data into a predefined object, we allowed the data to define its own morphological spectrum.
This pivot opened the door to more complex spatial artefacts still cup-like in scale, but liberated in their formal language.
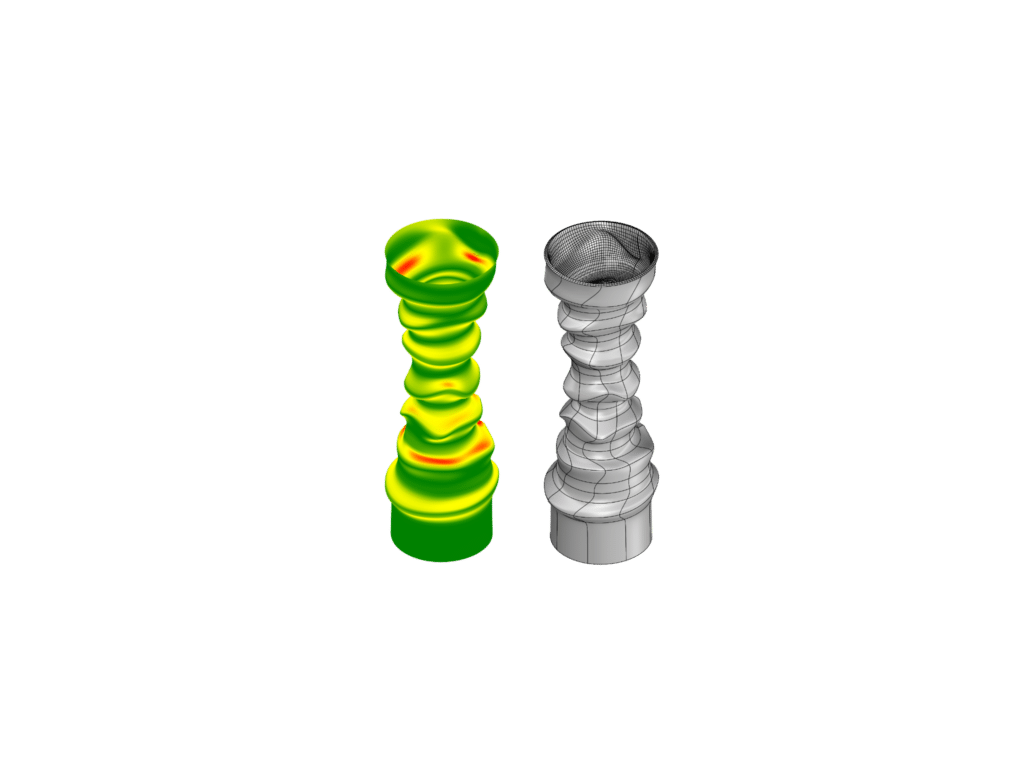
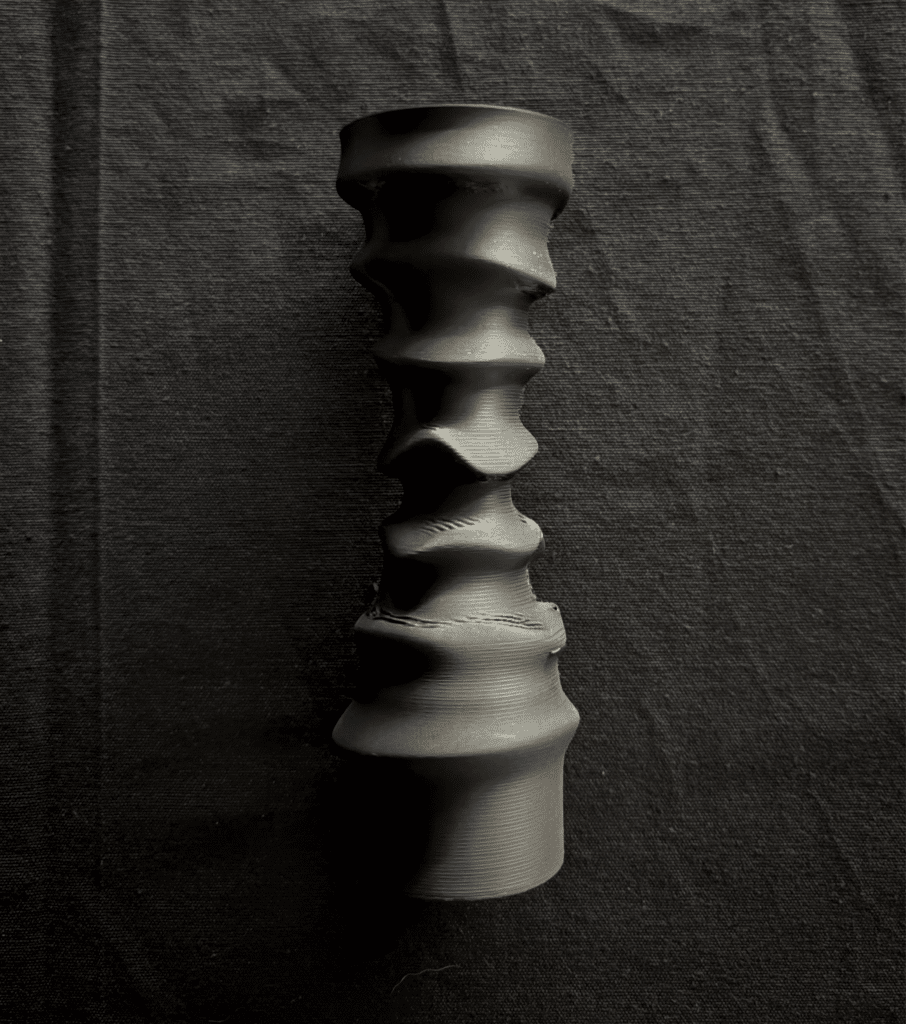
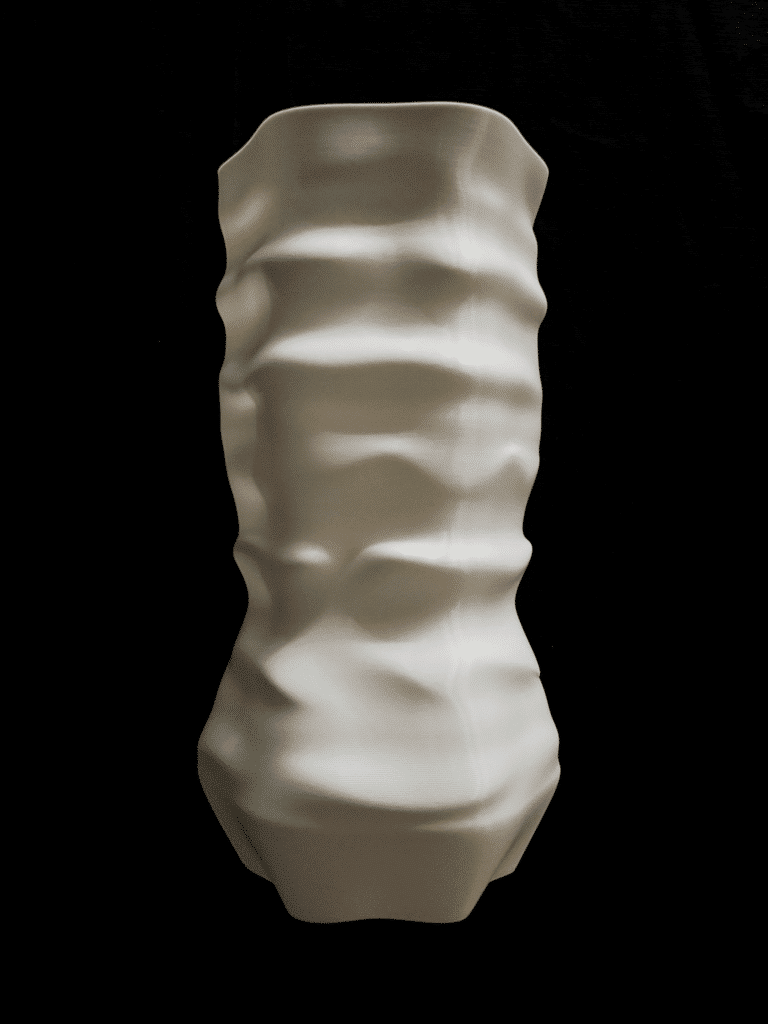
5. Fabrication – From Digital to Physical
The final forms were fabricated using FDM 3D printing with PLA.
This allowed us to test:
- Wall thickness behaviour
- Detail retention from the lofted curves
- How radial deformation translates into a manufacturable geometry
The prints preserved the subtle asymmetries of the sound-driven toolpath, making the artefact feel simultaneously digital and deeply human.
