Context
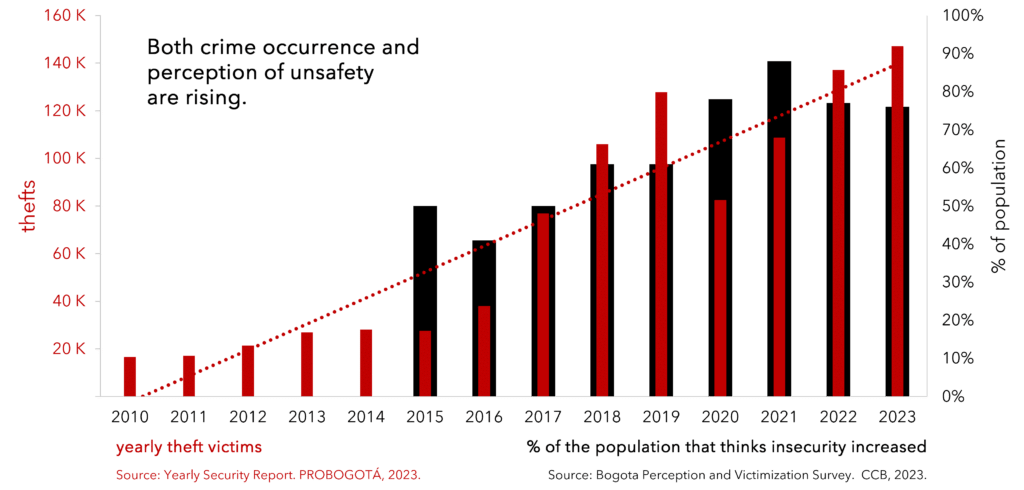
Bogota is the capital of Colombia. Both the perception of unsafety of its inhabitants as well as the amount of urban crime have been rising over the last years, with over 70% of the population feeling unsafe, and more than 120 thousand theft victims in 2023. The local government response to this has mainly focused on increasing the police presence and law enforcement. Is this the only solution? Can we as designers do something to reduce crime in the public space?
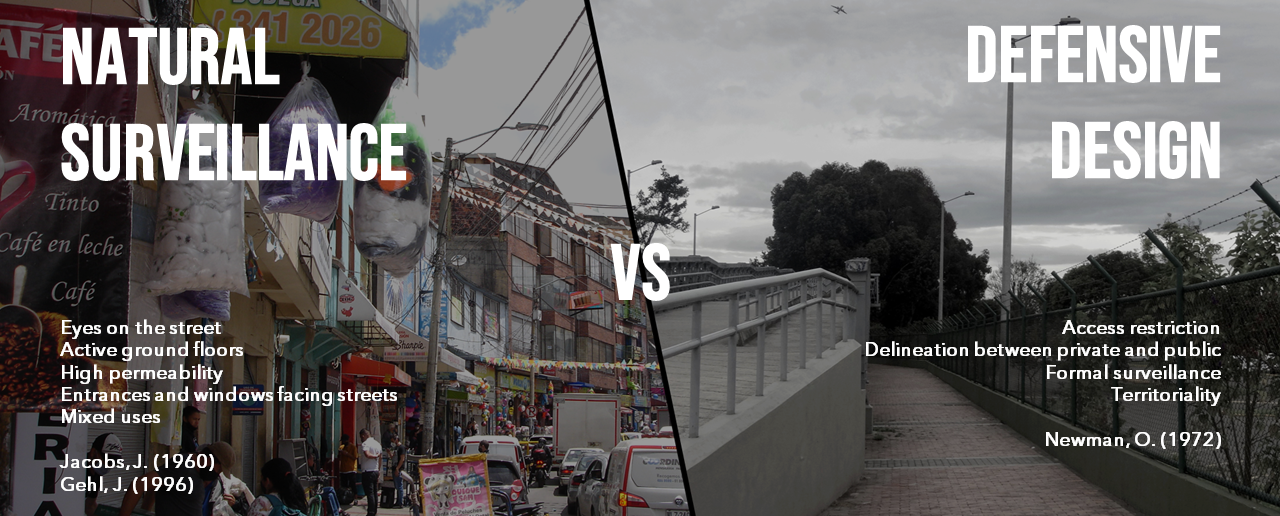
There has been a continuous debate among two principles for safety in the public space: on one side, Oscar Newman (1972) with the theory of “Defensive Space” which states that safety is provided, among other principles, by raising clear delineations between public and private, raising gates and fences to protect what is private, ensuring formal surveillance and demonstrating territoriality <a perspective that matches in some sense with the current and historical efforts of Bogota municipality. On the other hand, authors like Jane Jacobs (1960) and Jan Gehl (1996) have defended the idea of “Natural Surveillance”, arguing that safety in the public space is achieved by encouraging more people, activities and therefore “eyes in the street”, as well as activity in the ground floor, high permeability, entrances and windows facing the streets and mix uses.
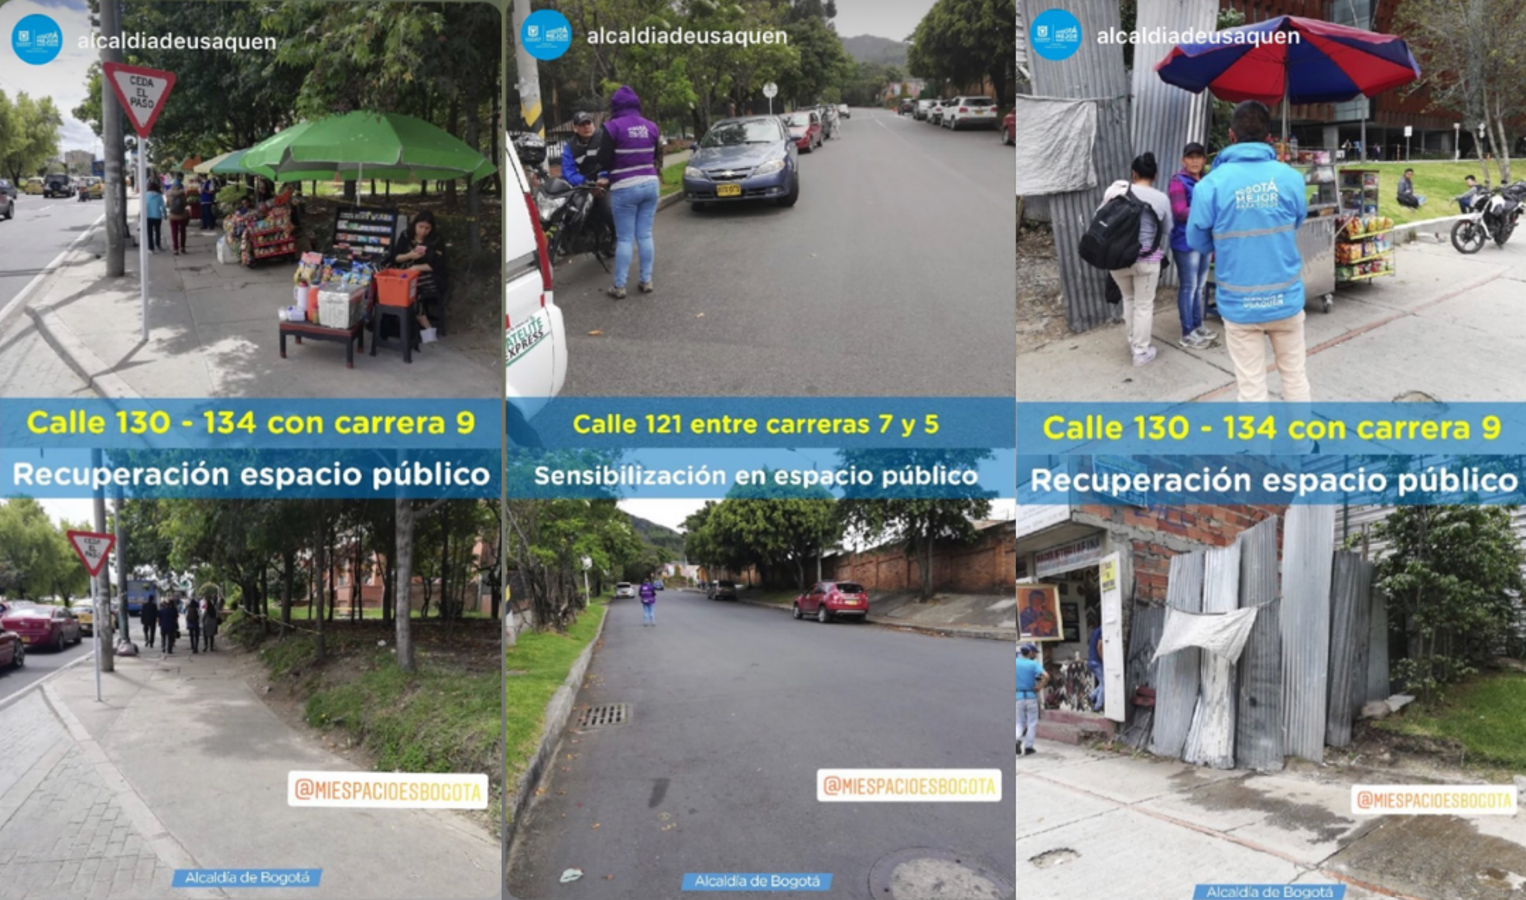
In Bogota particularly, as well as many other in the Latin American context, this representation of “life in the street” materializes as different representation of informal economies. Although informal street vendors are a big part of the urban landscape, they are considered occupants of the public space, as well as an unfair competition to business owners that do have to pay for the use of their premises. Therefore, the strategies of regularization are commonly oriented towards their relocation and they are pushed away from the public space.
Why bring informal vendors and urban safety into one conversation?
- Because there are case studies demonstrating that regularization does not have to mean relocation, such as the case of India’s National Policy on Urban Street (2009).
- Because crime is still rising, regardless of the continuous efforts of solving it through police enforcement.
- Because although are two current problems in Bogota as well as many other Latin American cities, there is not enough research on how to both of them are linked
- Because informal vendors do shift the function of public space as a path for movement into ephemeral destinations for pedestrians to wait for an appointment, wait for a person, have a phone call or have a snack or a coffee.
- Because, although informal vendors do occupy public space, sometimes they are filling up urban voids that would otherwise be unused.
- Because, if proven that they could serve as assets to reduce crime, this could be the excuse that the municipality is missing for encouraging the development of policy to acknowledge them as part of the public space.
Research Framework
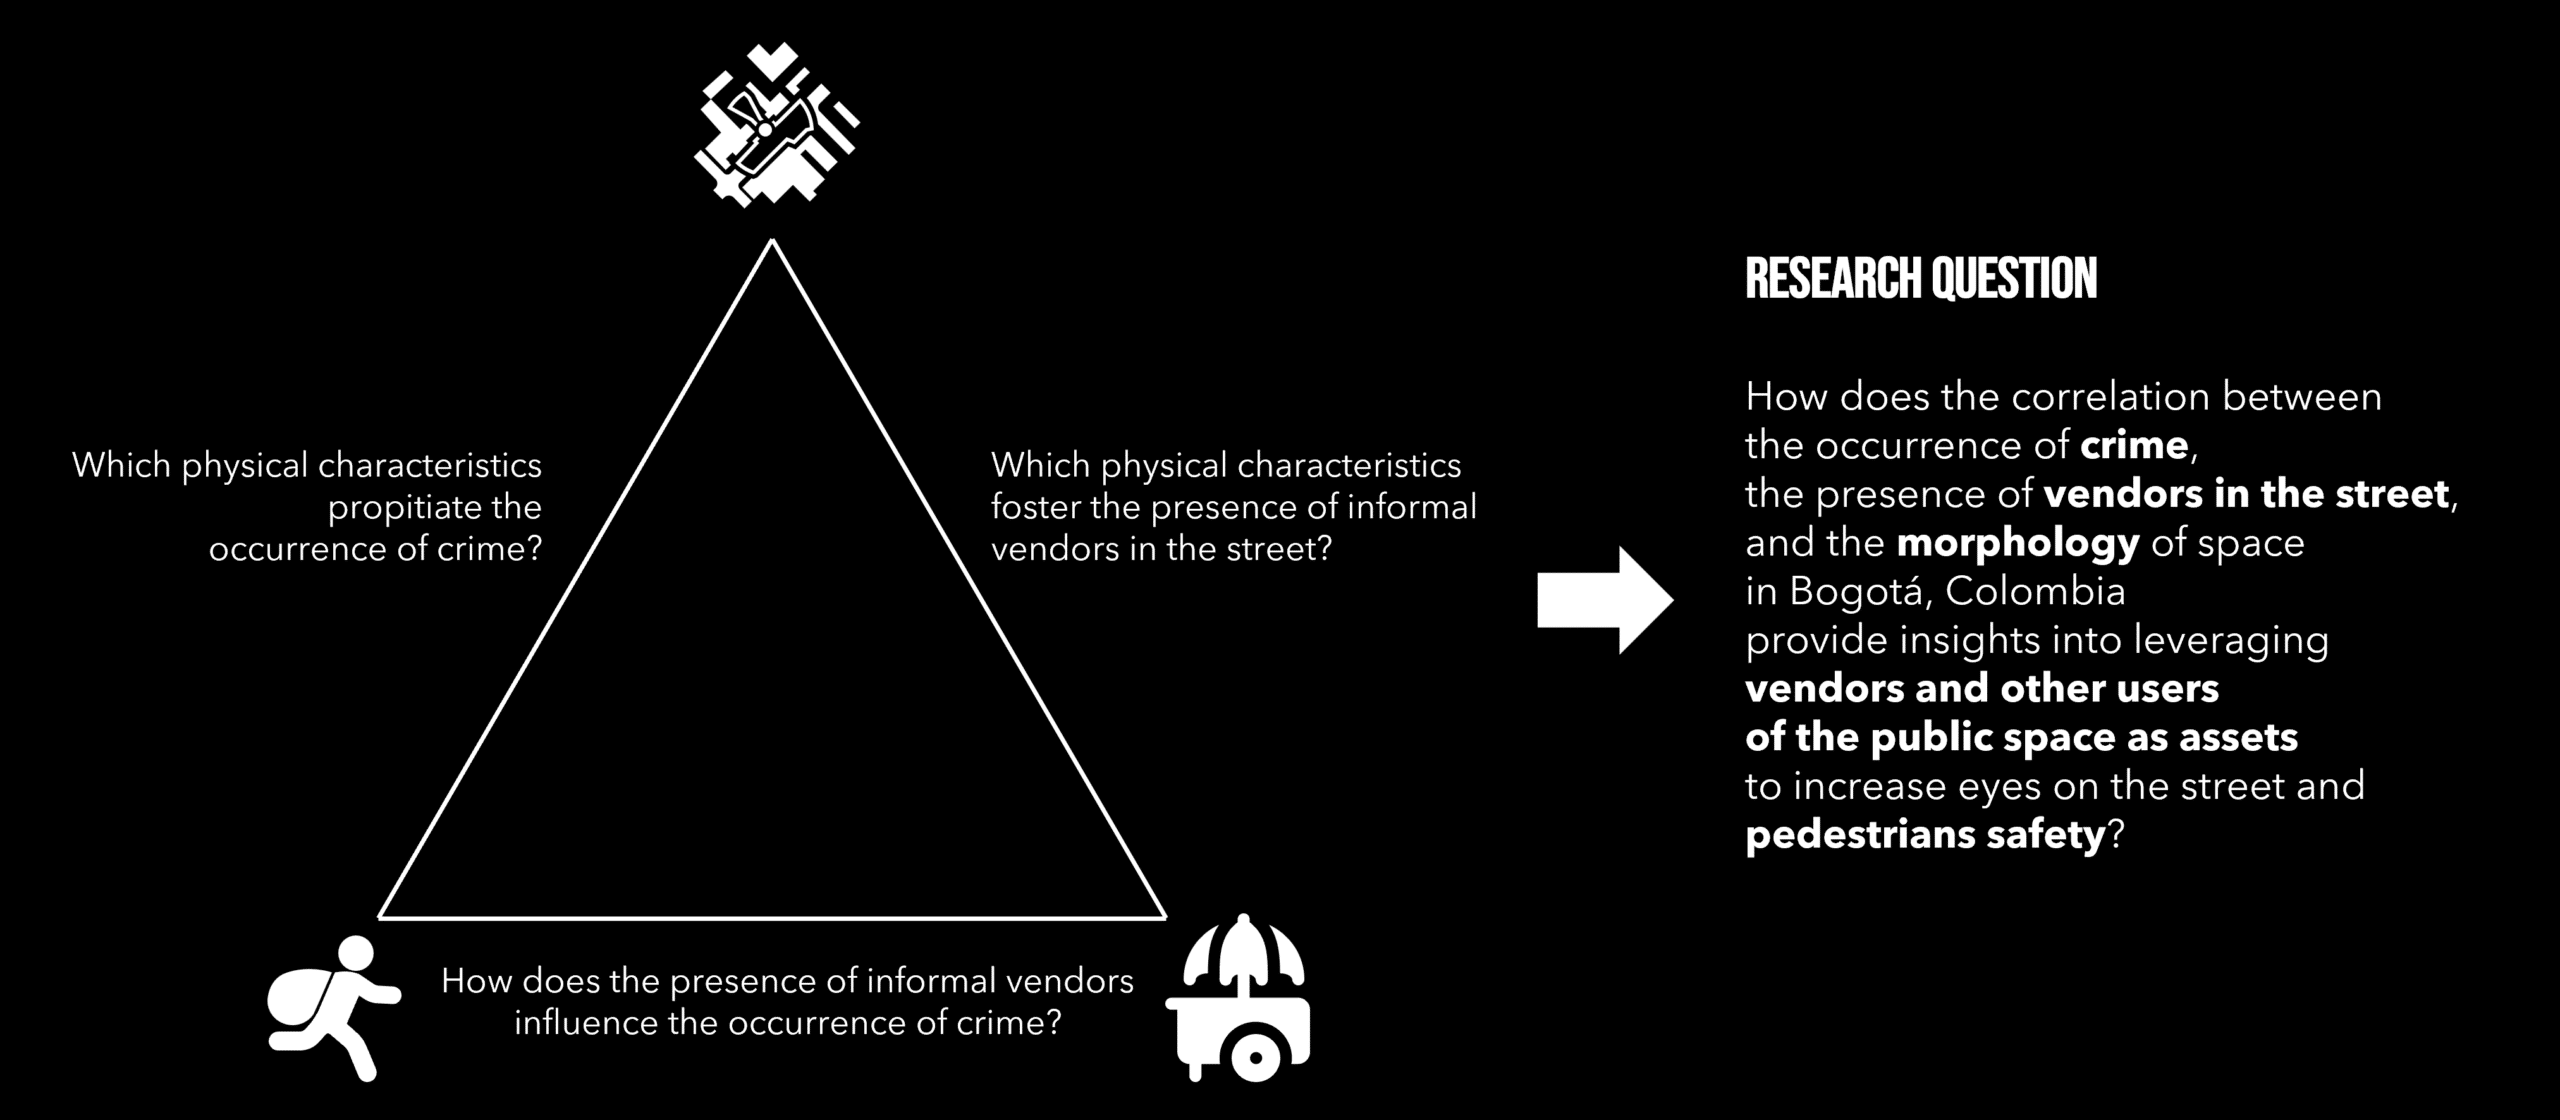
This research is an opportunity to search for correlations between the location of informal vendors and the occurrences of crime events in the public space, by spatializing the project and finding correlations between them and the morphology and dynamics of the public space. This would allow to answer questions like:
- Which physical characteristics foster the presence of informal vendors in the street?
- Which physical characteristics propitiate the occurrence of crime?
- How does the presence of informal vendors influence the occurrence of crime?
Methodology
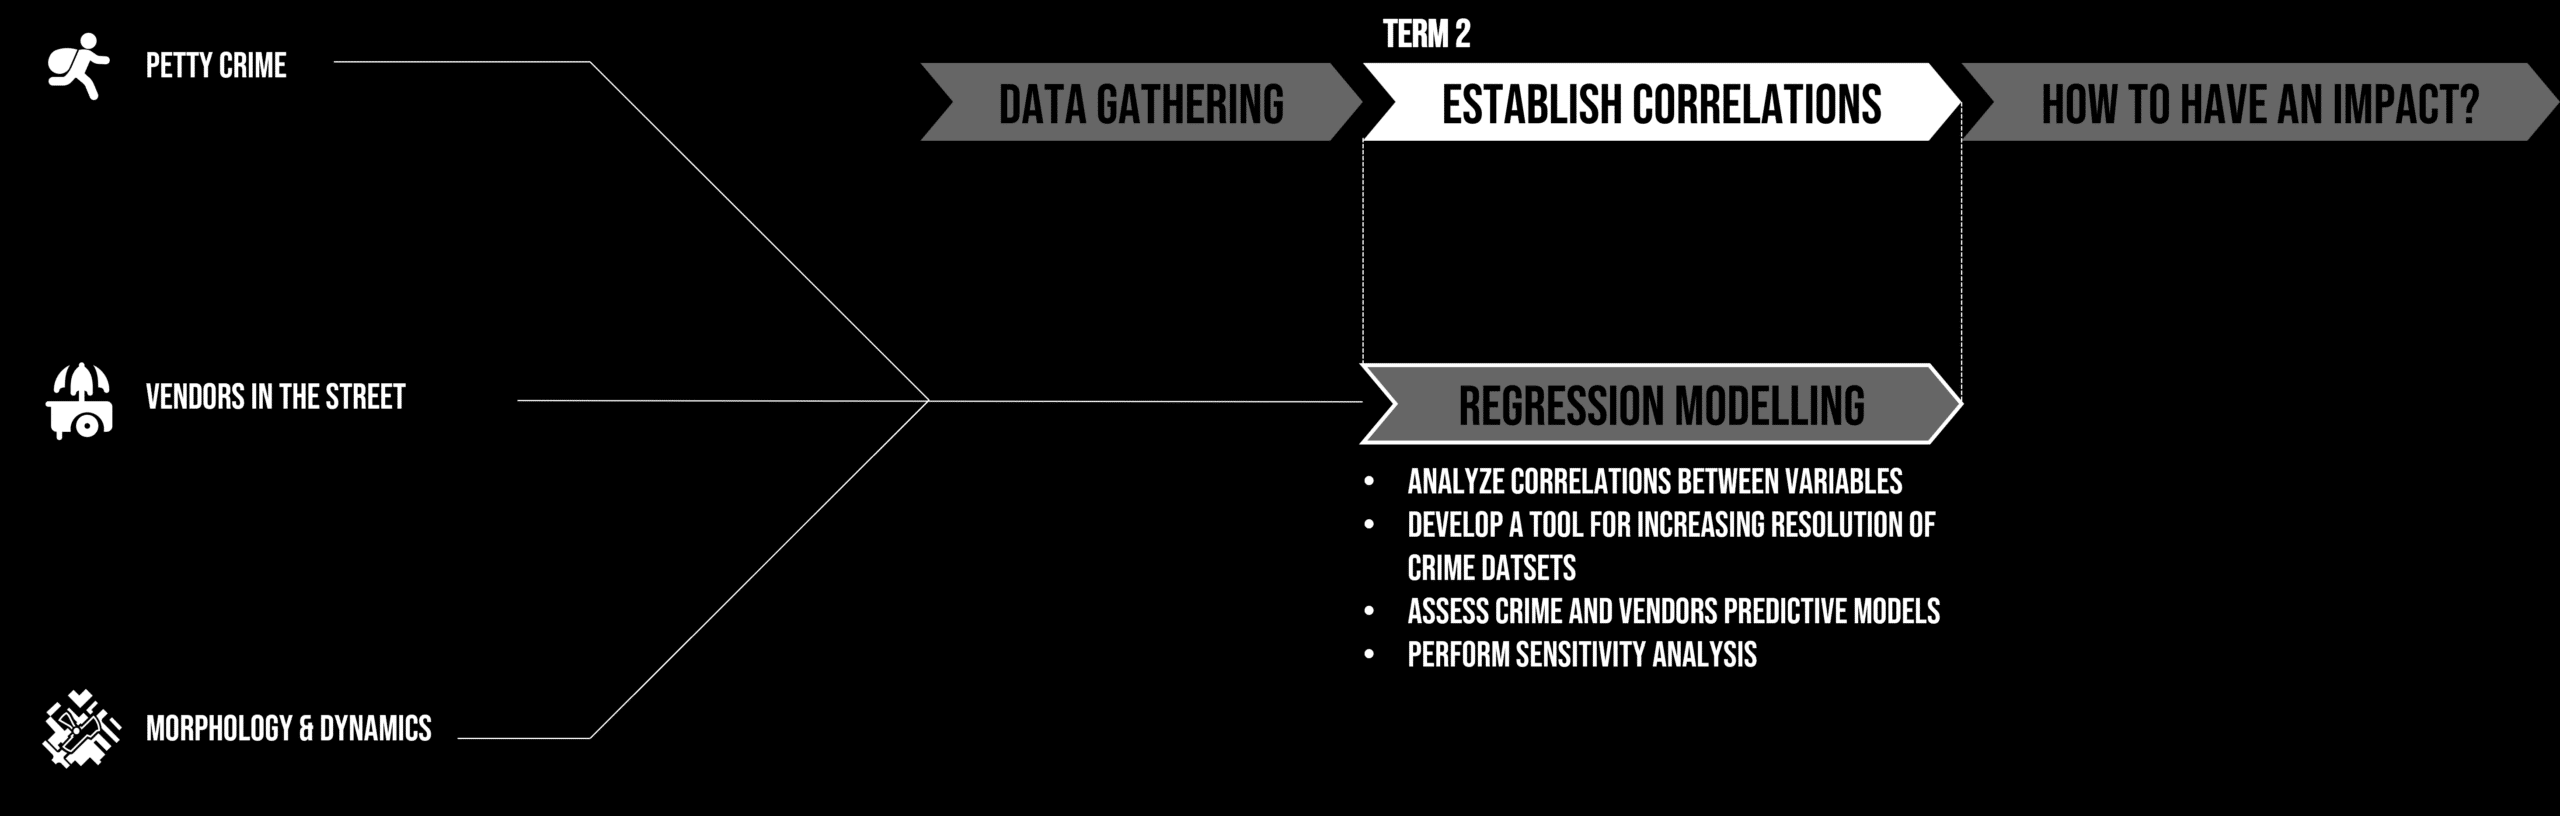
The thesis is to be developed in three steps:
- Data gathering
- Establishing correlations
- Figuring how to have an impact
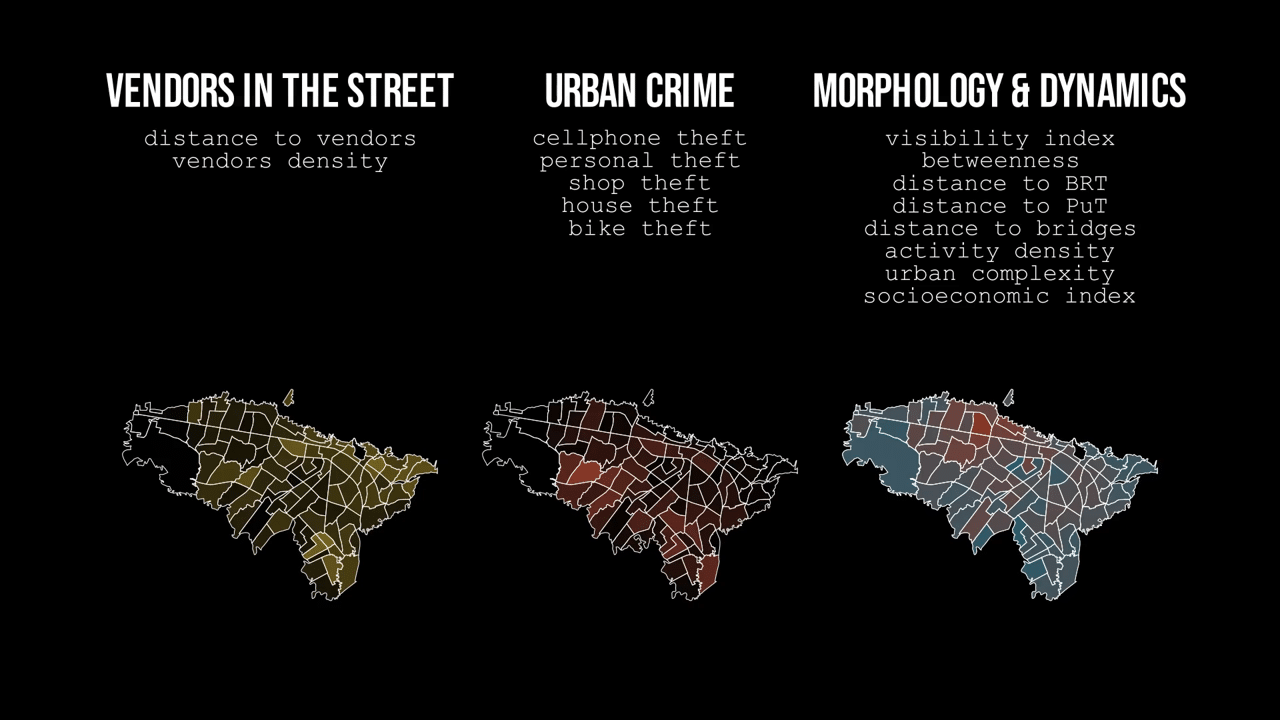
The first chapter concluded in providing an open-source replicable pipeline for retrieving information about these three urban phenomena, and a battery of indicators as shown below:
This blogpost will focus on the current development of the second chapter, Establishing Correlations.
What do I look for in a correlation?
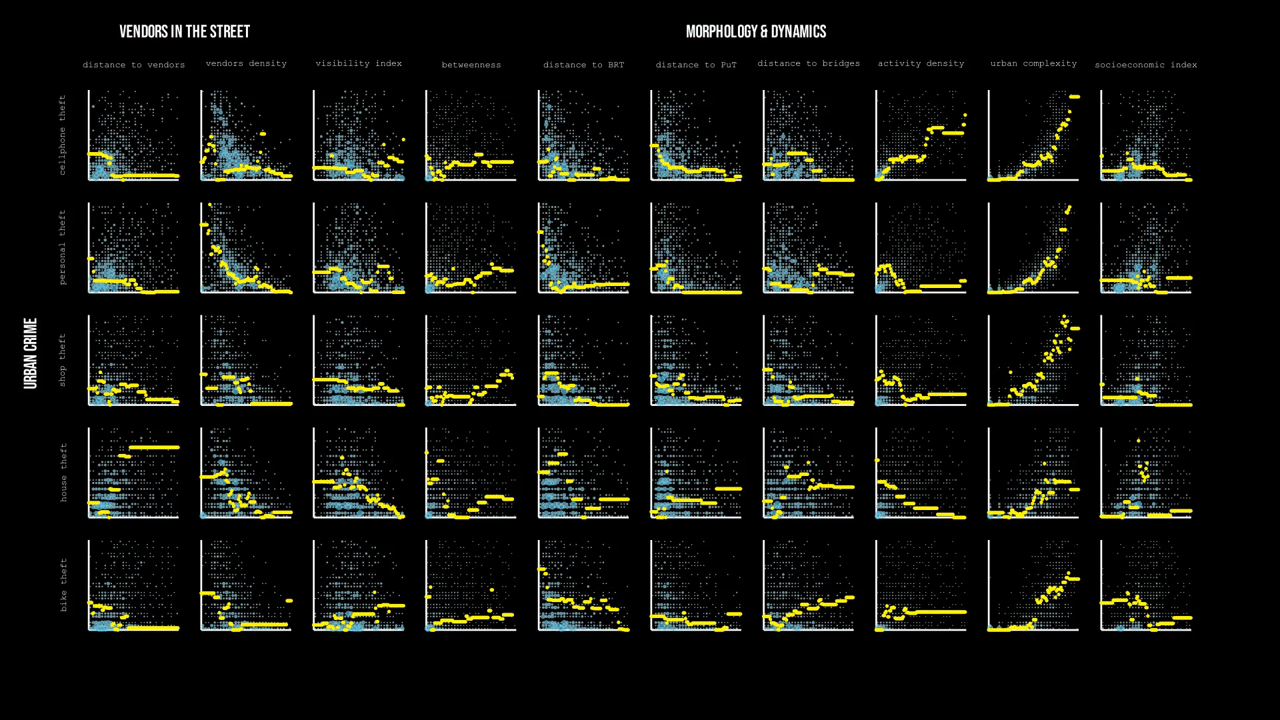
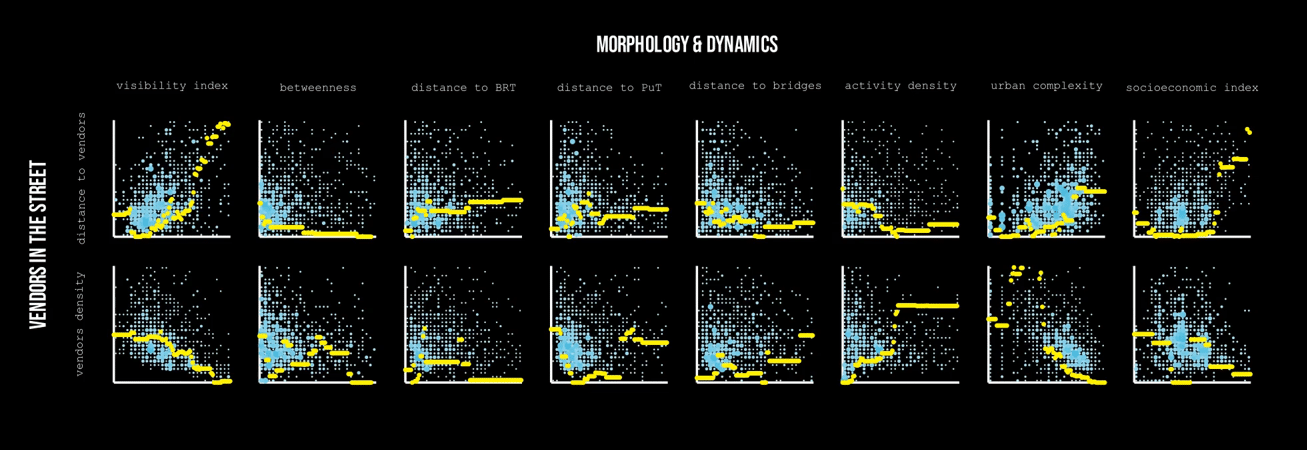
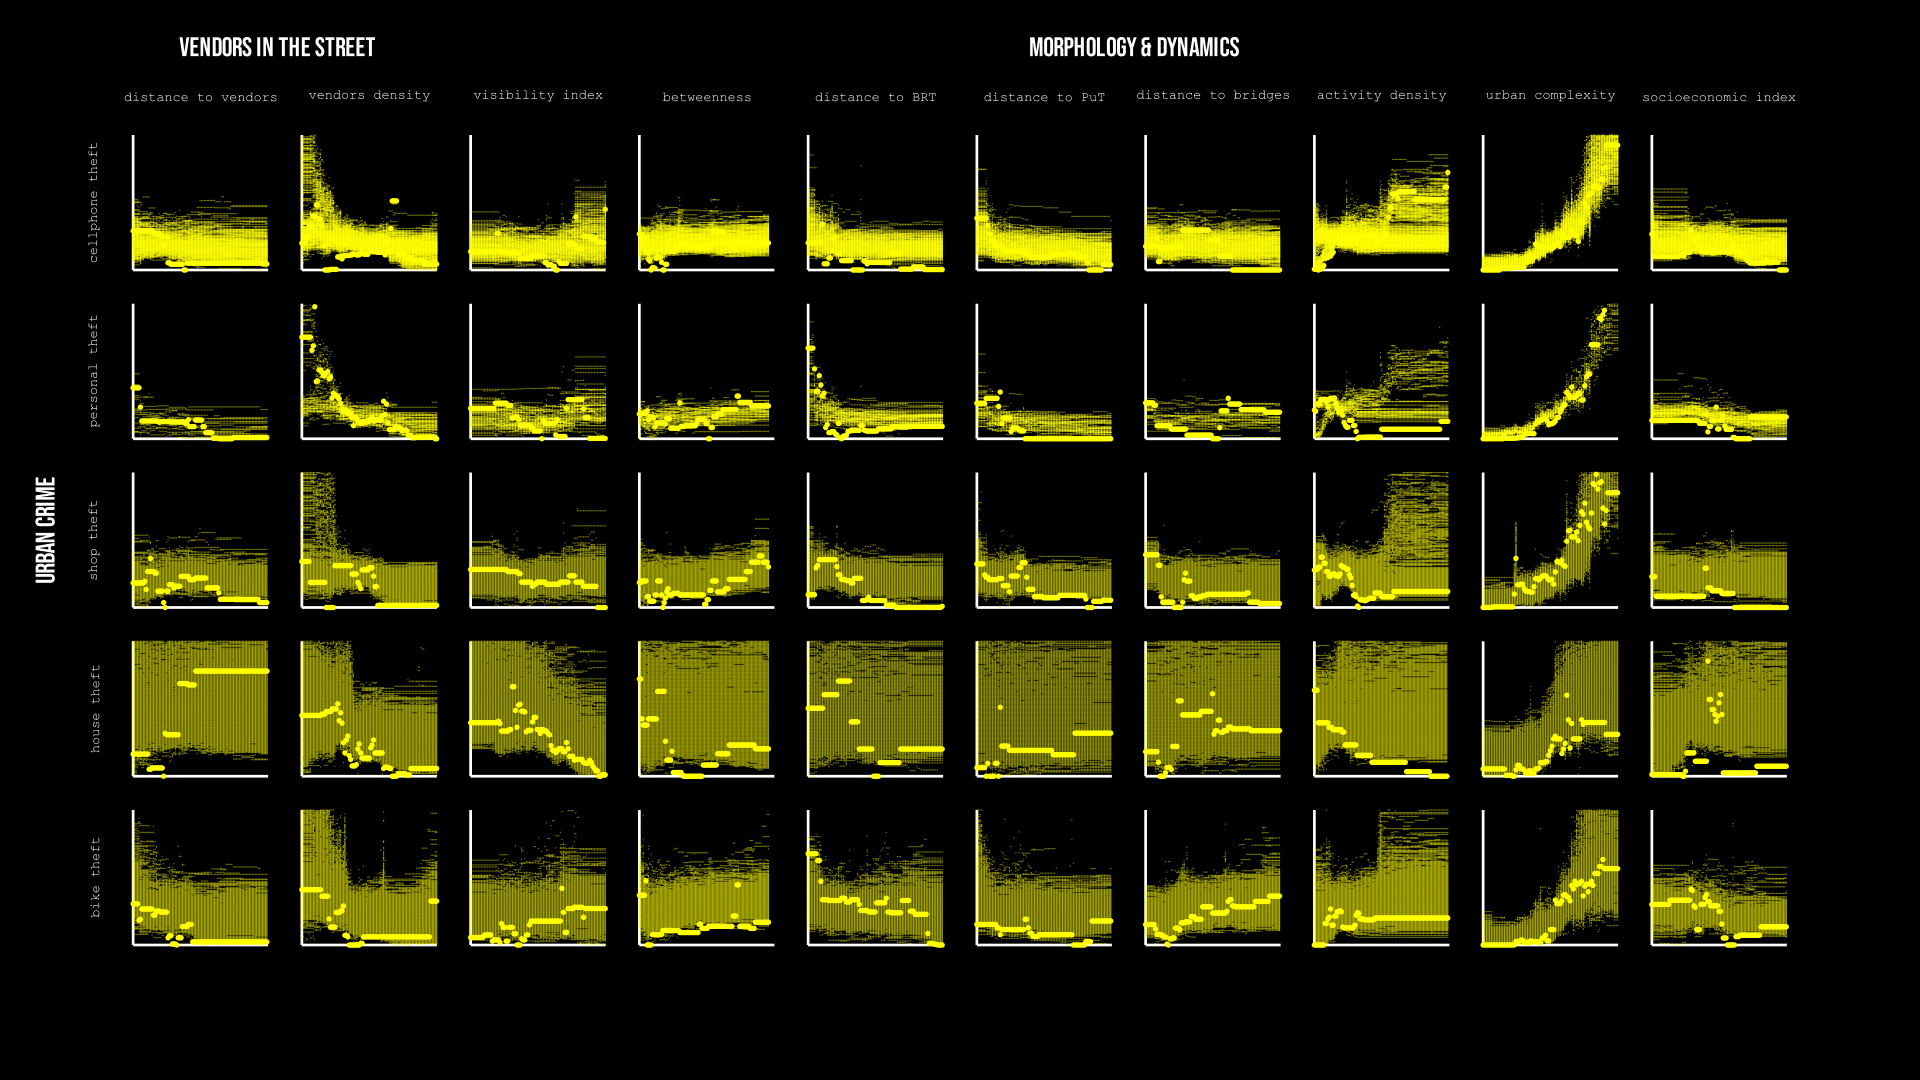
When having a battery of indicators as the shown above, the relationships between the behavior of the variables might provide powerful insights: two variables could grow proportionally, one variable could grow while another one decreases, they could have a linear or an exponential relationship. Regardless, the observed variables don’t follow a trivial pattern as they have a lot of noise in their distribution, therefore stating a correlation through a visual assessment is not so feasible.
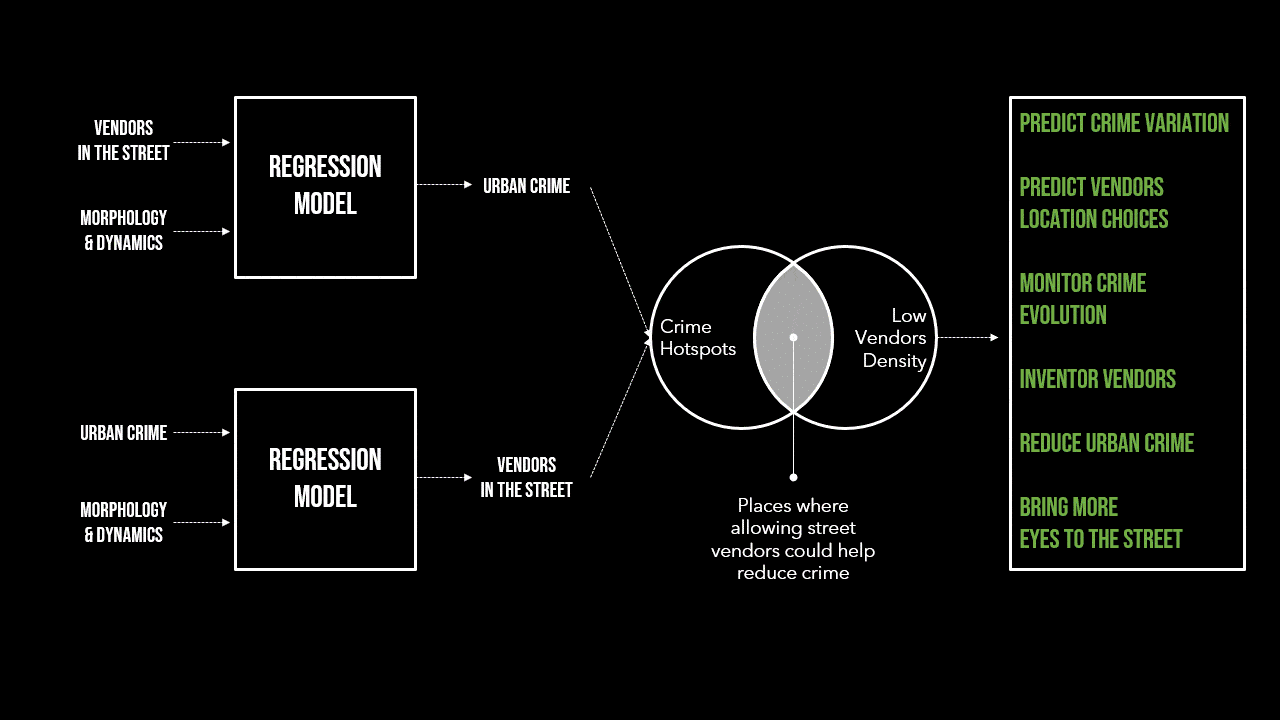
For this reason, regression models are assessed. Specifically for these case, Random Forest Models are assessed for representing how the different types of crime can be explained by the morphology and dynamics or the presence of vendors in the street, as well as explaining the presence of vendors as a function of the morphology and dynamics of the public space. After assessing and comparing over 500.000 models with different combinations of variables, the best fit models were determined using statistical indicators of “goodness of fit” including R2 coefficient, Mean Squared Error (MSE), Mean Absolute Error (MAE) and Root Mean Squared Error (RMSE). These are used to explain how good the models are able to perform at predicting the dependent variables.
Why are regressions useful?
Regression models are a statistically-based tool for identifying and assessing correlations between variables, and they can be useful for several goals, including uncovering hidden trends and patterns, predicting future events or increasing the detail of information that is not available from observed events.
To identify patterns that are not visible at first sight
By selecting the best-fitted model of each combination of 2 variables, it is possible to identify certain patterns, for example:
- All types of theft appear to be proportional to the urban complexity (the degree of mix of uses). In other words, crime seams to be more present in more diverse contexts.
- Cellphone theft appears to increase with activity density, while household theft appears to decrease with more activities density.
- Almost all types of theft appear to increase as vendor density decreases.
When removing crime, and assessing the relationships between vendors and morphology one could interpret that
- Vendor density increases in more specialized areas, or with less mix of uses
- Vendor density increases as visibility decreases.
Regardless that these could be powerful conclusions, these need to be assessed with caution as they state relationships between a dataset of high complexity and many hidden layers. More importantly, although two variables might grow proportionally, or have a degree of correlation, it should never be stated that one variable causes the other one to grow,. For example, eventhough these models indicate that crime rises while vendor density decreases, it cannot be stated that crime rises BECAUSE vendor density decreases, as there can be many variables that cause the behavior of both.
CORRELATION IS NOT CAUSALITY
To predict variables
As the models are trained on observed (or past) observations, these might be useful for predicting the occurrence of some variables when the information is not available. For example, the number of thefts could be predicted based on the morphology variables and vendor density in a given location and timeframe.

To increase the resolution of crime estimations
The information recorded in the crime reports is given by administrative polygons in the city, therefore the estimation of the models needs to aggregate all the other variables that have more disaggregated data into the given polygons for having the same resolution. Nevertheless, Since all the other variables are available in a higher resolution, these trained models would be used to identify the specific hotspots of crime in a higher resolution, based on the morphology and dynamics and vendor density of specific locations within the urban fabric.

In summary, regression models could help predict the occurrence and variation of crime based on the morphology of space and presence of vendors; it could also be useful for identifying the most probable locations for vendors in relationship with the morphology of space and crime occurrence.
As a data collection tool it could help monitor the evolution of crime and inventor vendors in the public space, and as a planning tool, it could help prioritize locations where crime is high and vendor presence is low as strategical points where vendors could bring more eyes to the street and reduce crime based on natural surveillance methods.
But this is one way in which regression models could be used; it could also go very wrong:
It could be used by the authorities to identify crime possible locations to send police enforcement; or use the prediction of vendors to increase the persecution to remove them from the public space.
If these models were used by criminal organizations, they could help them strategize crime and identify locations where more crime victims could be found or where it could be easier to perform petty crime.
Also, as the visibility of vendors increase through this pipeline, they might be pushed away from the public space and away of the “eyes of the system”, or even pedestrians, after identifying the crime hotspots, could be motivated to avoid given locations, therefore decreasing even more the number of eyes in the street.
Are regressions an absolute truth?
Even if regression models are used with good intentions, are they trustworthy enough to make decisions based on them? The insights stated in the previous segments of this blogpost were based on one model with the best fit. If now we take not one, but the 3% of the best fitted models, we identify that, given patterns that were predicted as clear correlations become again more noisy when incorporating or removing more variables. Therefore the apparent relationships that let us to state “connclusions” before, are not absolute truths aymore.
Key takeaways
This critical assessment of the correlations between vendors, crime and the morphology of space demonstrate that
- They should be approached critically and understand their biases, how they can be both assets and weapons.
- We should always be skeptical about what data tells us; even if the insights look promising, they might be too good to be true.
- Correlation is not causation
What comes next?
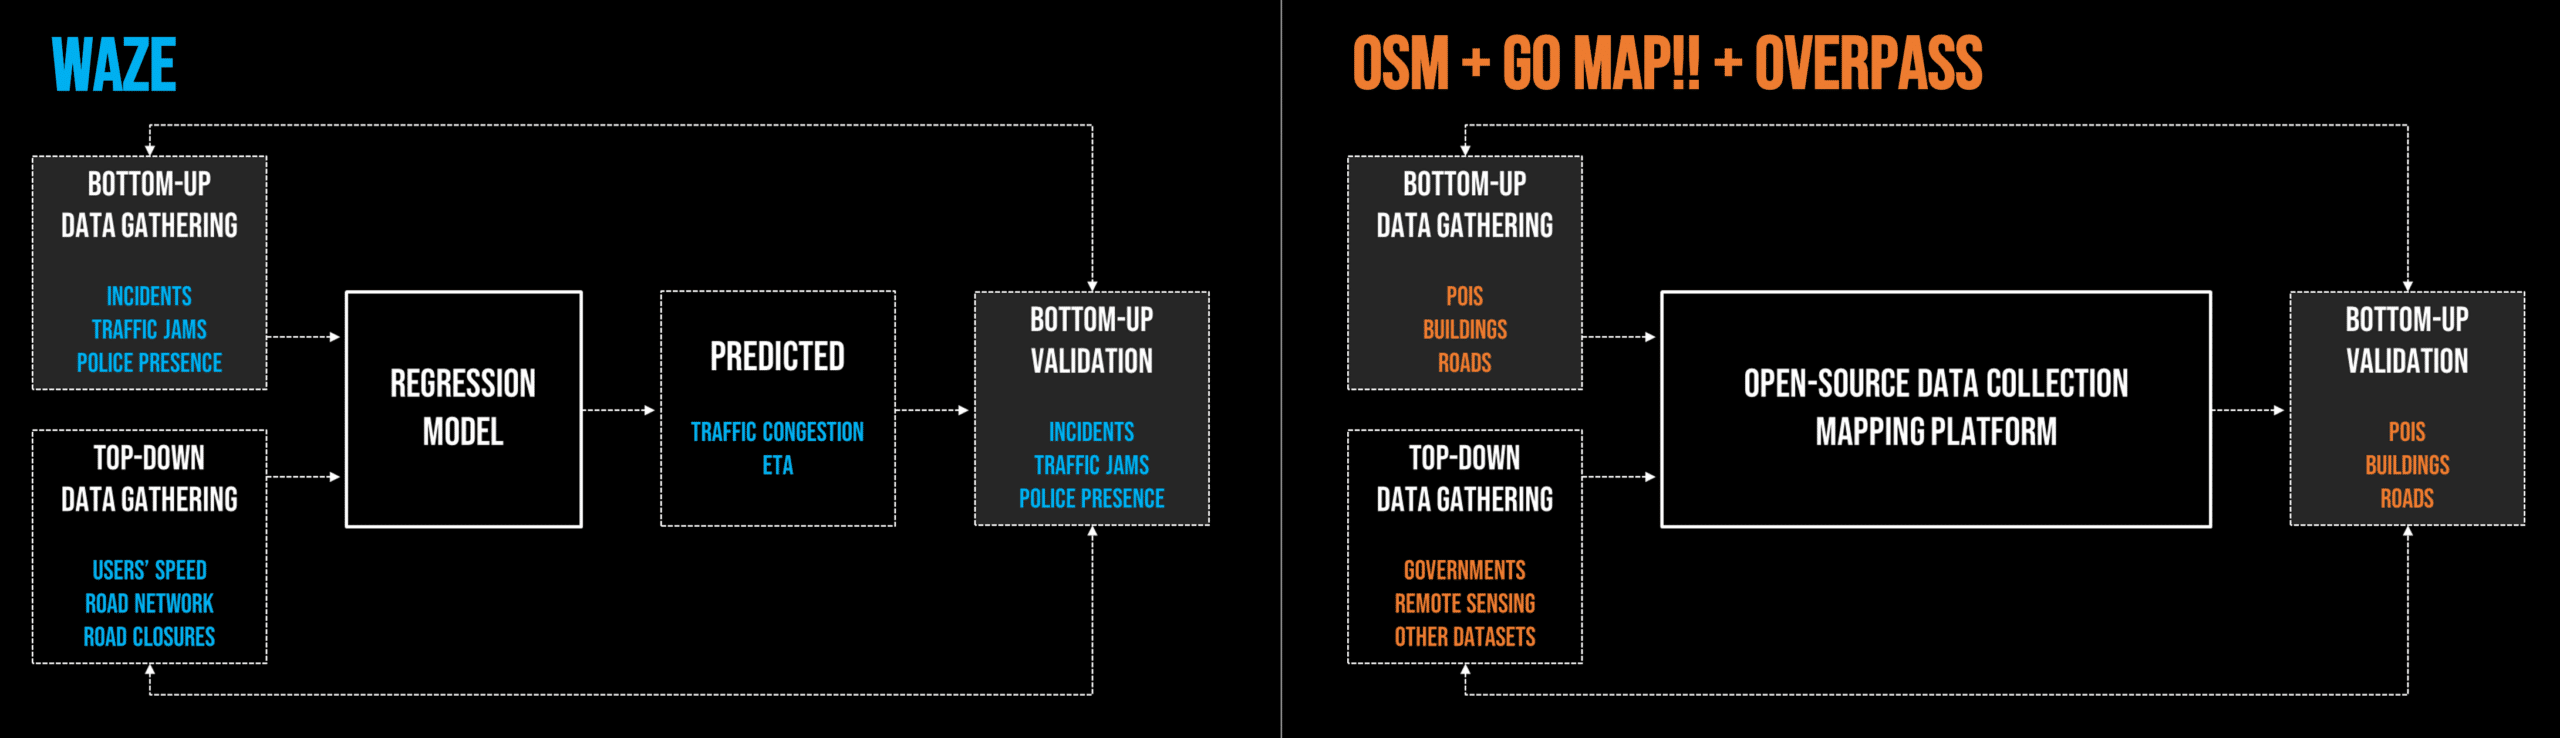
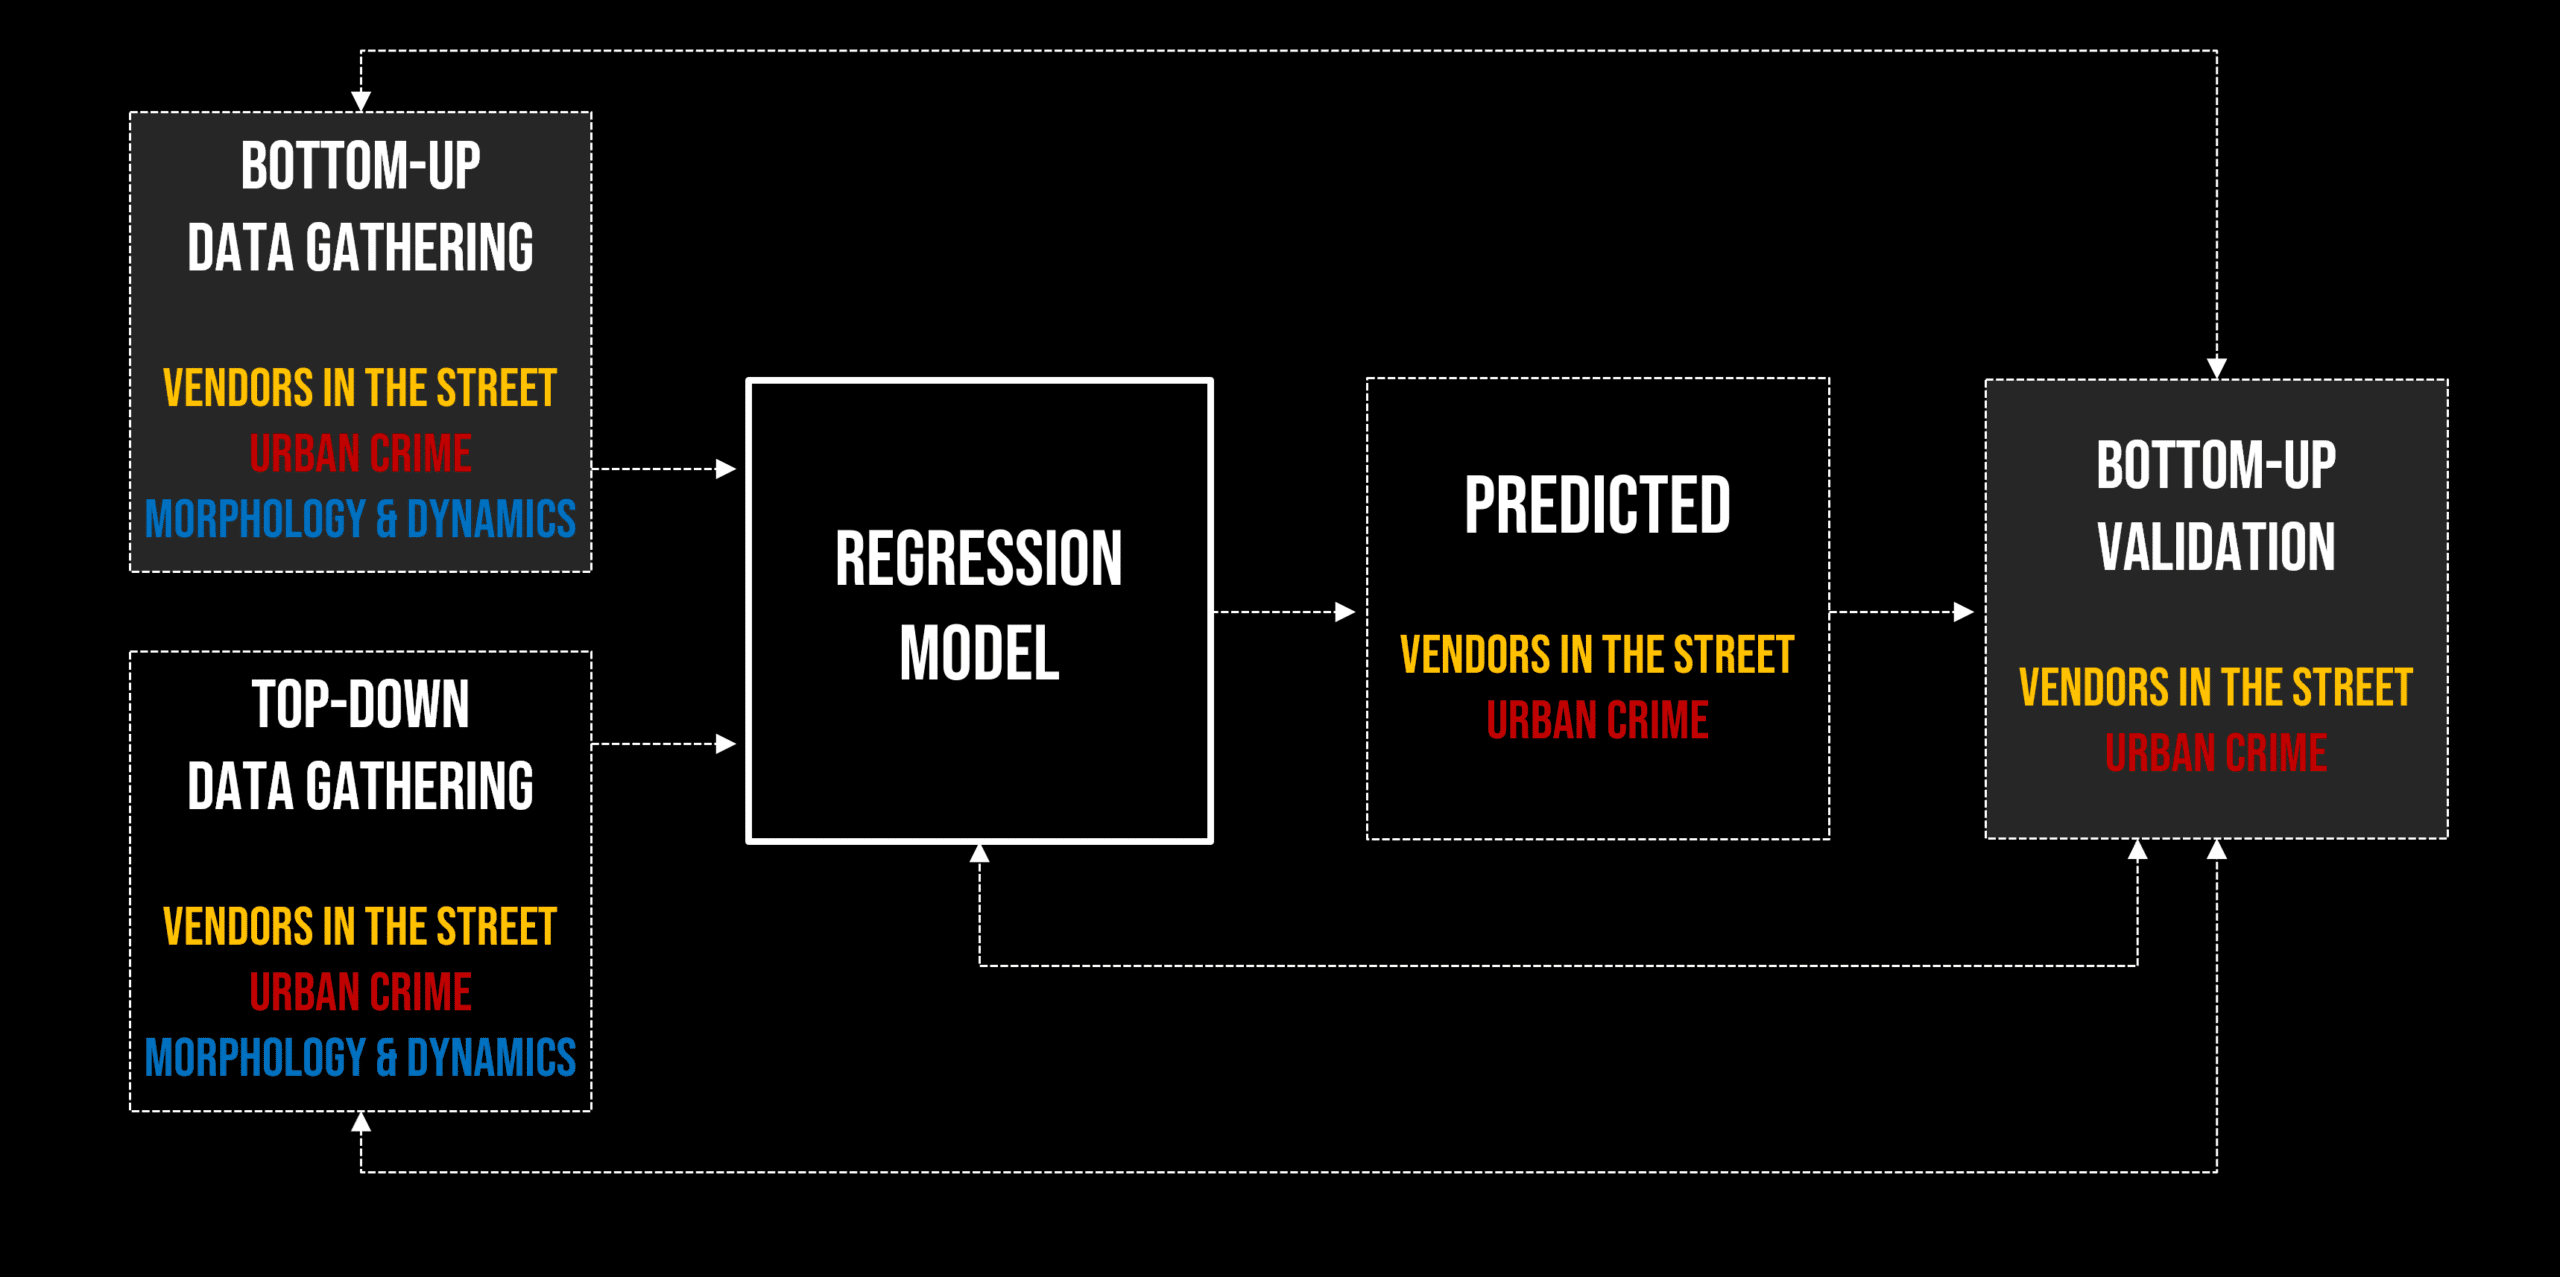
The pipeline developed until now, provides a replicable and scalable tool for retrieving information from open sources and using regression models to predict the occurrence of crime or the presence of vendors. What this pipeline lacks is a bottom-up input of data that provides information from the human scale and from the user experience of the public space. It also lacks the validation from users themselves that can double-check the data that is estimated from open sources and the relationships from the regression models and their predictions.
This synergy between top-down data collection and bottom-up input and validation has been proven useful in tools such as Waze and OpenStreetMap that are constantly receiving information and feedback from users,