Context
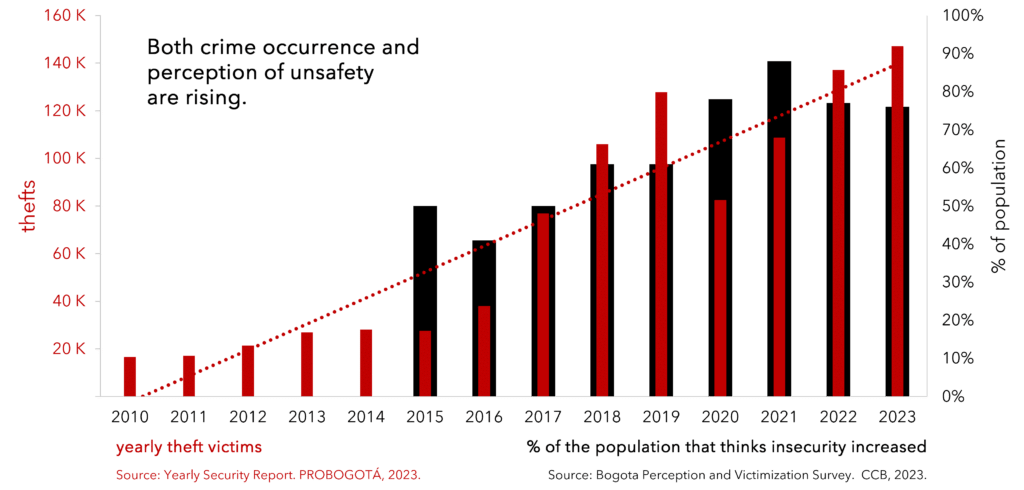
Bogota is the capital of Colombia. Both the perception of unsafety of its inhabitants as well as the amount of urban crime have been rising over the last years, with over 70% of the population feeling unsafe, and more than 120 thousand theft victims in 2023. The local government response to this has mainly focused on increasing the police presence and law enforcement. Is this the only solution? Can we as designers do something to reduce crime in the public space?
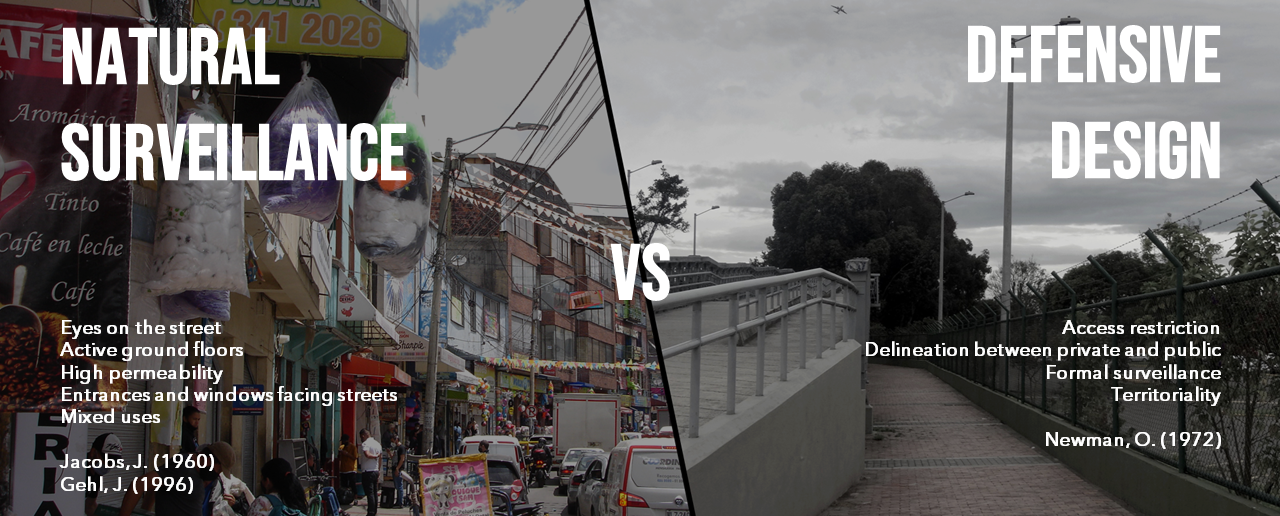
There has been a continuous debate among two principles for safety in the public space: on one side, Oscar Newman (1972) with the theory of “Defensive Space” which states that safety is provided, among other principles, by raising clear delineations between public and private, raising gates and fences to protect what is private, ensuring formal surveillance and demonstrating territoriality <a perspective that matches in some sense with the current and historical efforts of Bogota municipality. On the other hand, authors like Jane Jacobs (1960) and Jan Gehl (1996) have defended the idea of “Natural Surveillance”, arguing that safety in the public space is achieved by encouraging more people, activities and therefore “eyes in the street”, as well as activity in the ground floor, high permeability, entrances and windows facing the streets and mix uses.
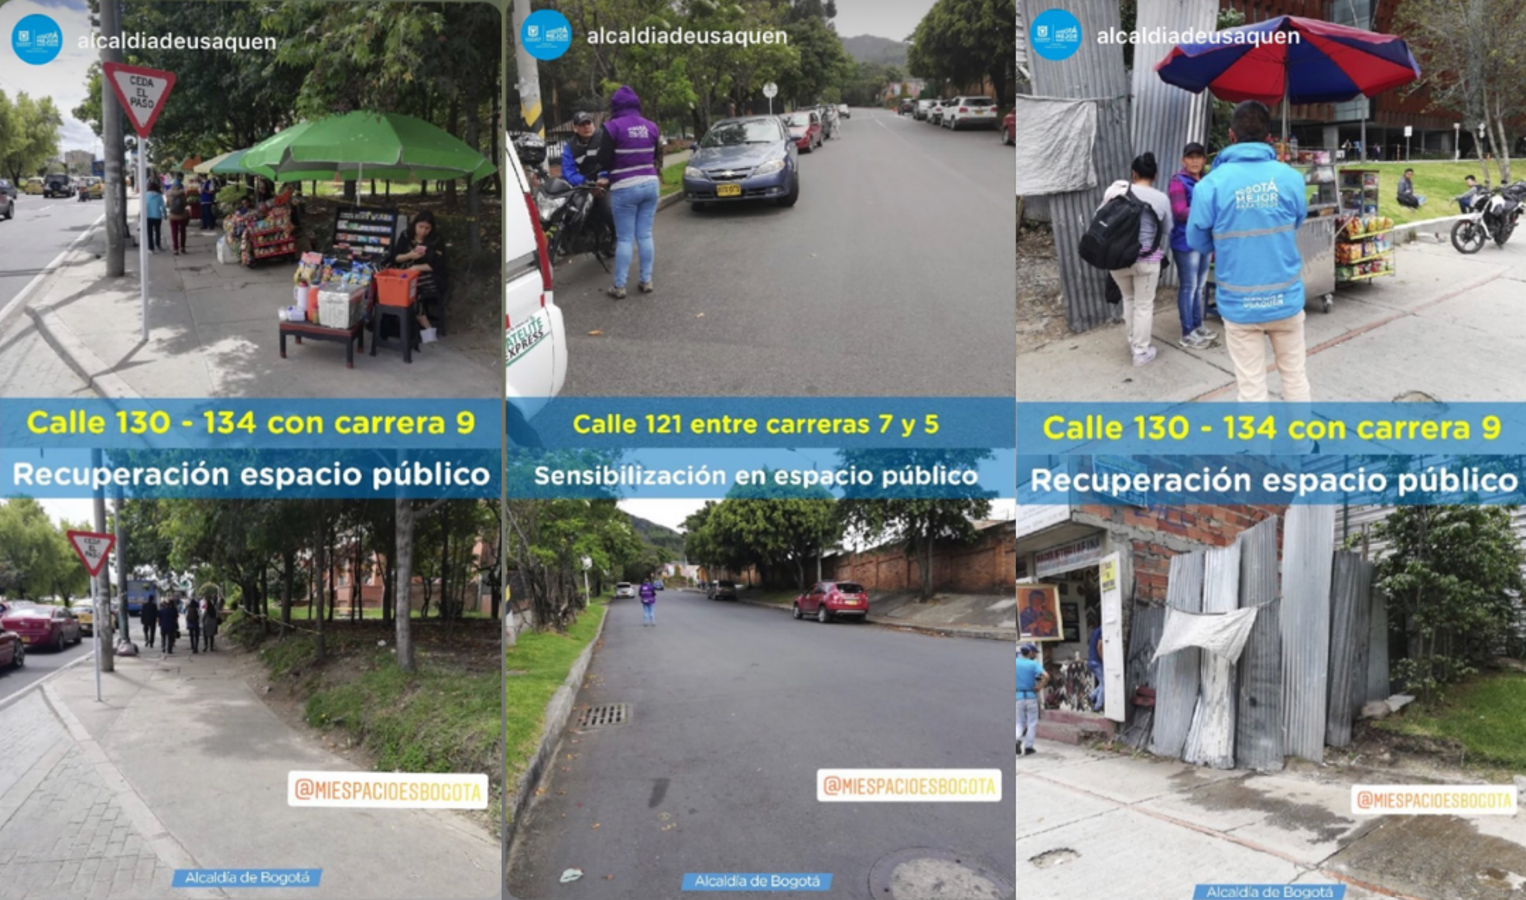
In Bogota particularly, as well as many other in the Latin American context, this representation of “life in the street” materializes as different representation of informal economies. Although informal street vendors are a big part of the urban landscape, they are considered occupants of the public space, as well as an unfair competition to business owners that do have to pay for the use of their premises. Therefore, the strategies of regularization are commonly oriented towards their relocation and they are pushed away from the public space.
Why bring informal vendors and urban safety into one conversation?
- Because there are case studies demonstrating that regularization does not have to mean relocation, such as the case of India’s National Policy on Urban Street (2009).
- Because crime is still rising, regardless of the continuous efforts of solving it through police enforcement.
- Because although are two current problems in Bogota as well as many other Latin American cities, there is not enough research on how to both of them are linked
- Because informal vendors do shift the function of public space as a path for movement into ephemeral destinations for pedestrians to wait for an appointment, wait for a person, have a phone call or have a snack or a coffee.
- Because, although informal vendors do occupy public space, sometimes they are filling up urban voids that would otherwise be unused.
- Because, if proven that they could serve as assets to reduce crime, this could be the excuse that the municipality is missing for encouraging the development of policy to acknowledge them as part of the public space.
Research Framework
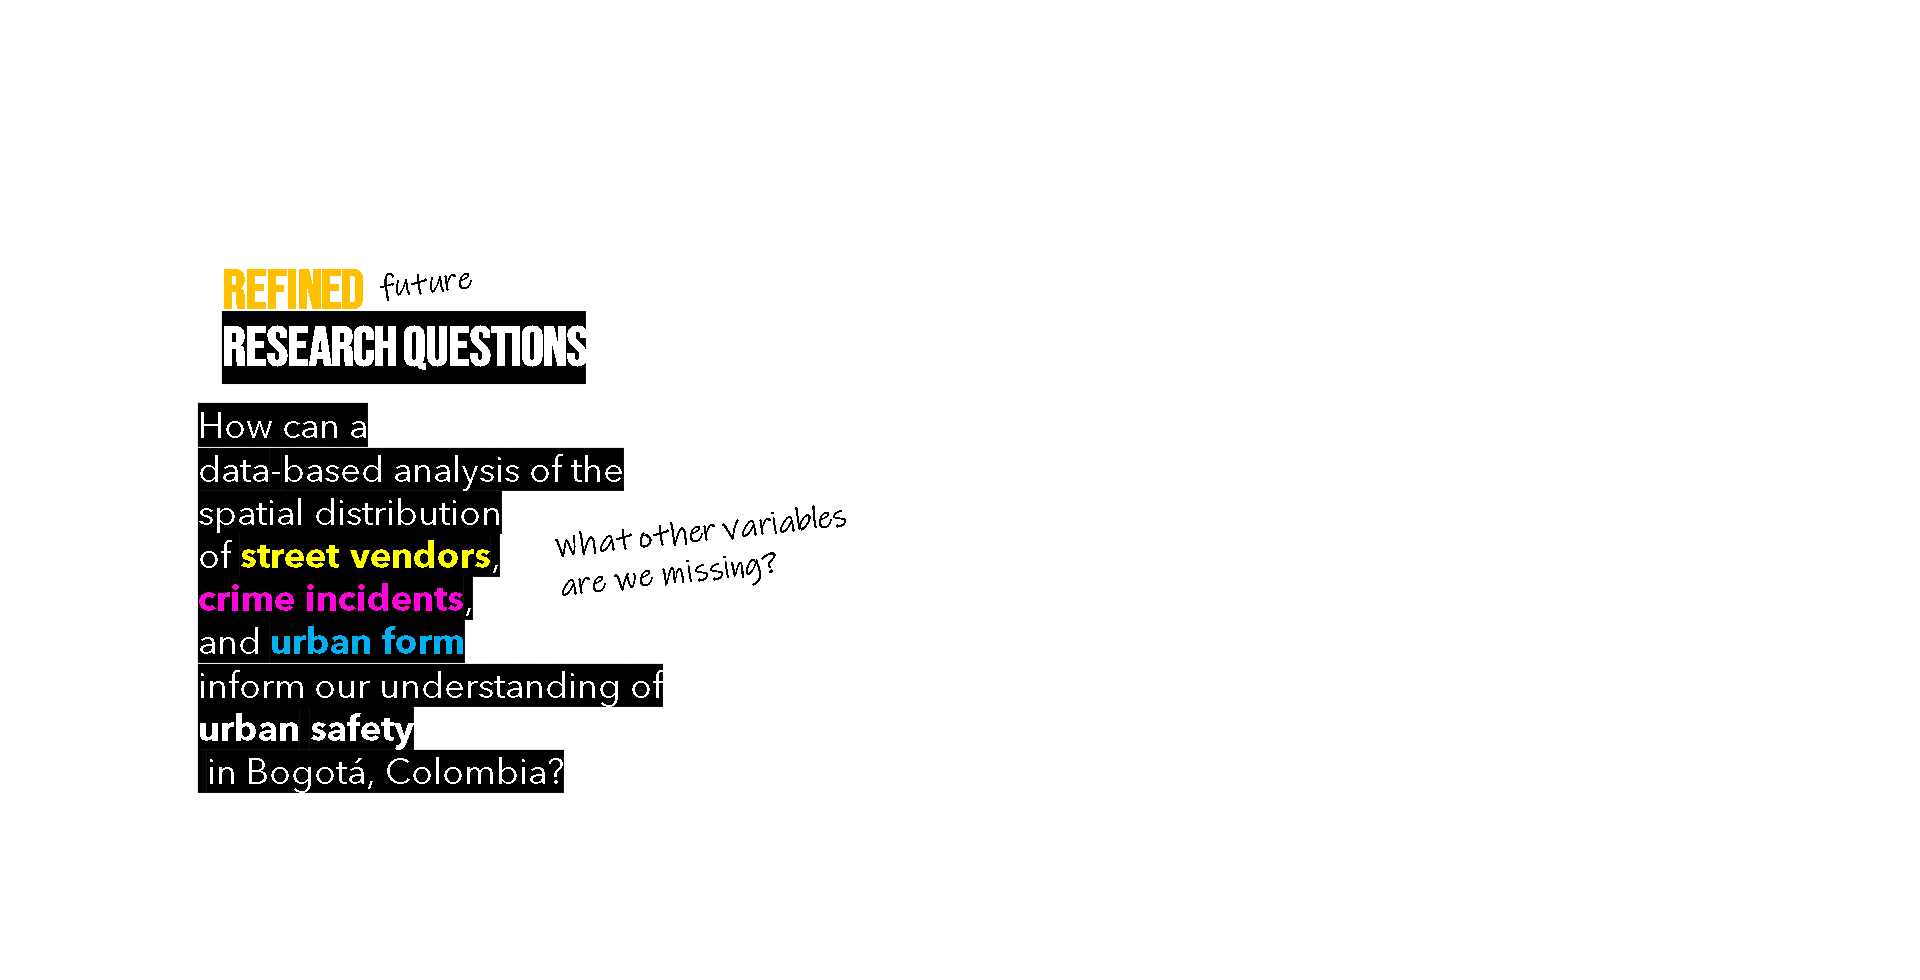
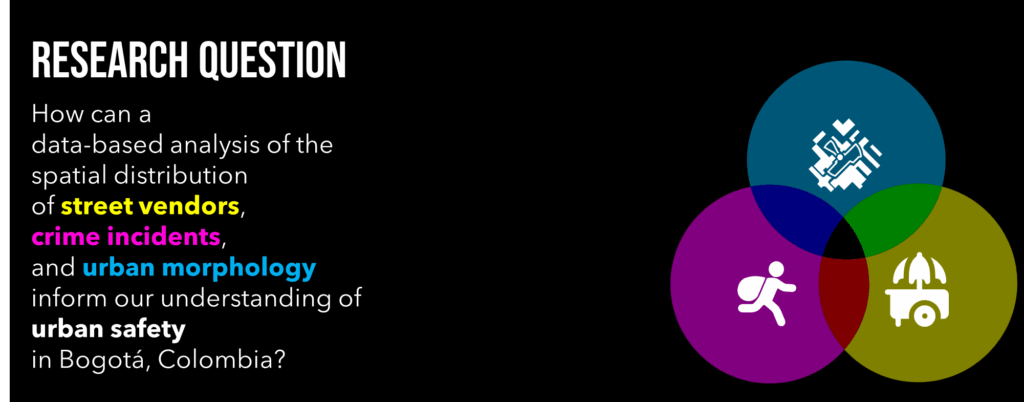
This thesis develops to assess how can a data-based analysis of the spatial distribution of street vendors, crime incidents, and urban morphology inform our understanding of urban safety in Bogotá, Colombia?
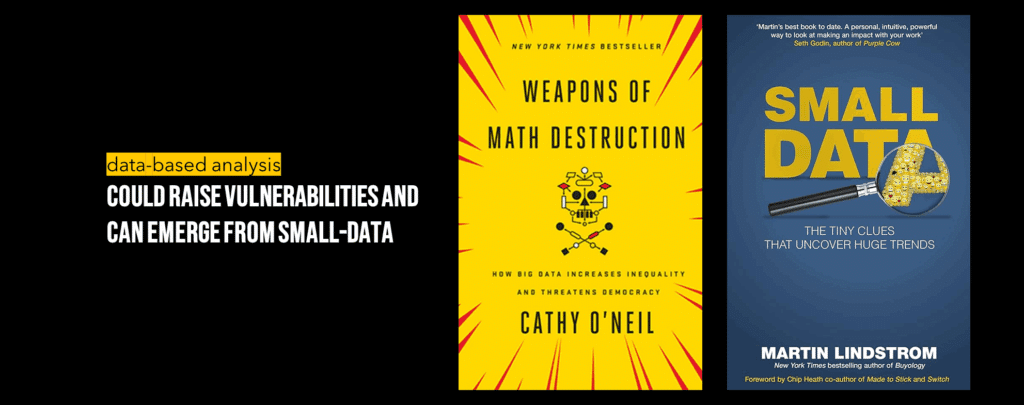
Nevertheless, throughout the development of the methodology it was identified that data-based analyses could sometimes raise more vulnerabilities than it can solve, as explained by O’Neil, C. in Weapons of Math Destruction (2017). In the same way, regardless of the advantages of Big Data, Small Data, defined by 2016.
Methodology
CHAPTER 1: MORE DATA ON THE STREET
In this data-based framework, the first effort is focused on retrieving data on the three dimensions of interest from the distance.
WHERE ARE THE VENDORS LOCATED?
A Python pipeline was developed using the Google Streetview API and the Mistral API for parametrically retrieving images along the pedestrian network and using the Vision capabilities of Mistral Vision model Pixtral to answer 4 specific questions or instructions.
- Is there an informal or street vendor in the image?
- What is distance of the informal vendor in the picture on a scale of 0 to 3 (0: not present, 1: far, 2: midrange, 3: near)
- What is the description of the informal vendor (if answer to previous question is positive, otherwise answer None) using 0 to 5 keywords?
- Provide a description of the context of the picture using 0 to 5 keywords.
This pipeline is 100% free and relies on globally available data with the ability to process approximately 150 images per hour.
After this, it is possible to consolidate two indicators based on the identified locations of vendors:
- Vendors density
- Mean distance to vendors
WHERE IS CRIME HAPPENING?
Although the access to the raw data of crime events is not possible, the police department of Bogota publishes monthly reports for each of the 19 Localidades in which the city is spatially divided. Each of these reports contain the aggregates for seven types of crime: i) murders, ii) personal injuries, iii) personal theft, iv) vehicle theft, v) motorcycle theft, vi) phone theft and vii) bike theft. For each of these types two tables are provided: i) the disaggregation by gender and ii) the disaggregation by spatial subdivisions called Zonal Planning Units (UPZ).
A Python pipeline was developed using the OpenAPI to create an assistant that receives each PDF and outputs a structured dictionary for generating two datasets: i) a timestamped dataset with the monthly sum of victims by crime type, Localidad and gender and ii) a timestamped and geolocated dataset with the monthly sum of victims by crime type, Localidad, UPZ, for the period 2016 to 2023.
By later using products from Chapter 2, it was possible to implement a pipeline for increasing the resolution of these events and reaching a higher level of granularity.
For the scope of this research, this methodology will only focus on the types of crimes that can be more likely affected by the effects of the pedestrian right-of-way and the space street vendors utilize: personal theft, cellphone theft, bike theft, shop theft and house theft.
HOW TO MEASURE URBAN MORPHOLOGY AND DYNAMICS?
For measuring the morphology of the public space, three concepts are taken from the principles of bill Hillier’s Space Syntax for performing a quantitative evaluation of the accessibility and connectivity of the pedestrian street network.
- Betweenness or Choice: is an indicator for measuring how traversed a path is.
- Visibility: is an indicator of how far can an individual reach given a radius and a set of obstacles, commonly buildings.
The Space Syntax methodology is commonly implemented using software such as UCL Depthmap, QGIS + PST Plugin or Rhino + Grasshopper. In this case, a 100% Python pipeline was developed to retrieve such indicators. The graph analyses were performed using OSMNX street network and IGRAPH library that optimizes computation time by running the back-end processing in C. The visibility analyses were performed using the library T4GPD that integrates the calculation of isovists given certain obstacles. Although commonly approached using buildings as obstacles, the pedestrian reach in the public space of Bogota is commonly also limited by other set of obstacles including pedestrian and vehicular vehicles as well as long sections of highways. For this reason, these were also weighted in the analysis.
In another set of variables, the proximity to infrastructure and mobility elements is introduced, represented through the following indicators:
- Distance to public transport stops: taking into account a radial distance from all bus stops of the city.
- Distance to BRT stops: measuring the radial distance from the stops of the city’s Bus Rapid Transit high-capacity-system, TransMilenio.
Additionally, an extra layer of indicators is considered taking into account that normally they choose strategic locations where there is a preexisting cluster of activities, with examples such as commercial or educational clusters. For this, the Overture Maps places open dataset was retrieved.
With this set of points of interest, two types of indicators:
- Activity density: is a measure of the quantity of points of interest within a given area.
- Urban complexity: is a measure of the mix or diversity of uses. Takes its origin from the ecological background using the formula Shannon entropy formula.
Finally, an indicator of the spatial distribution of income was introduced, by gathering the socio-economic stratum indicator used in Colombia, it is possible to spatialize a socioeconomic index as a representation of the concentration of wealth.
CHAPTER 2: MORE DATA, MORE INFORMED DECISIONS?
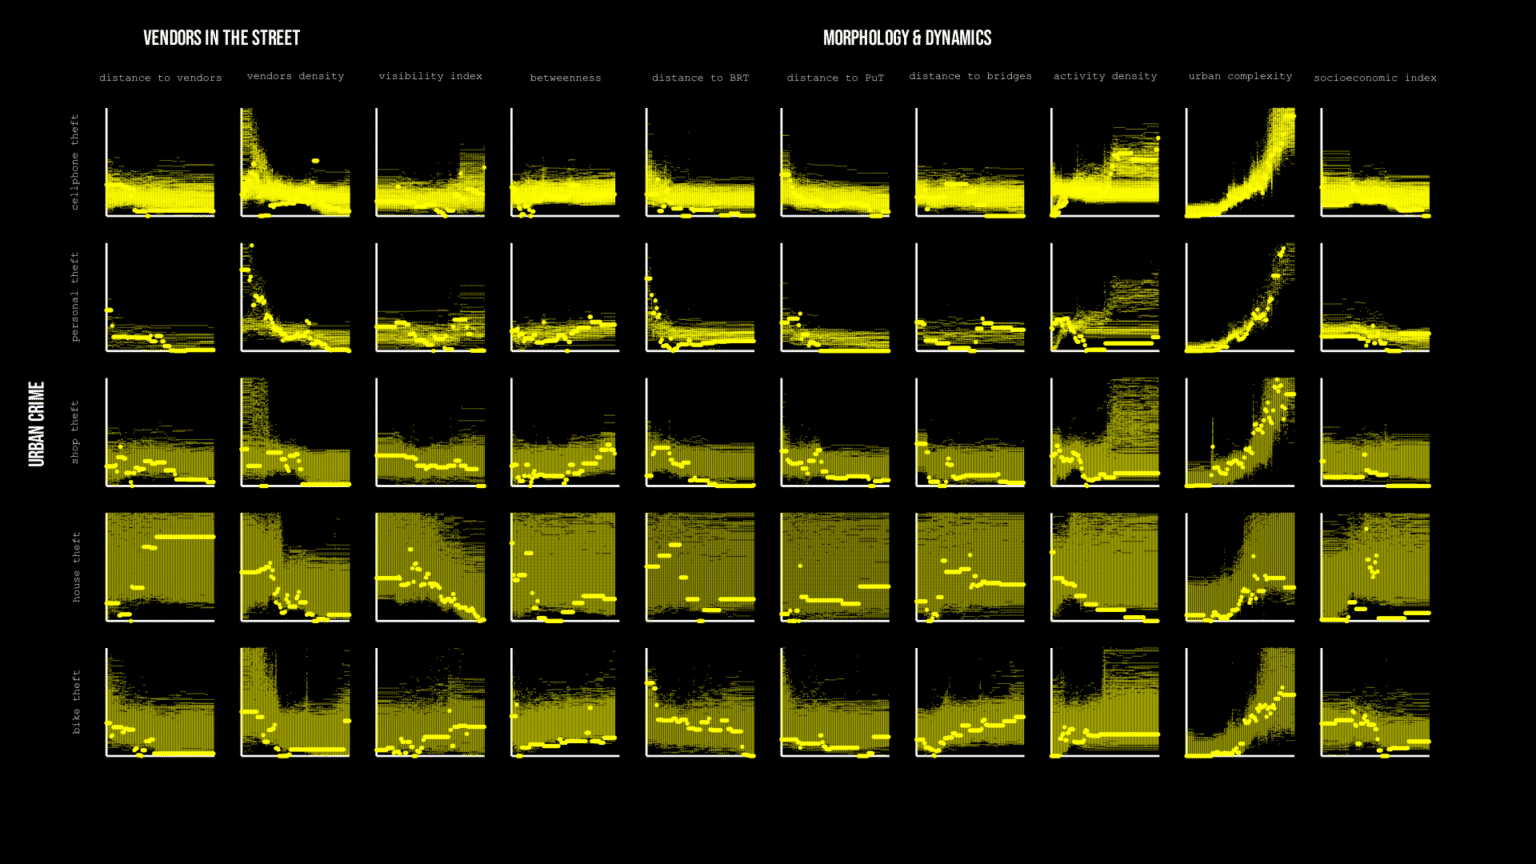
After having retrieved and consolidated a battery of indicators as the product of the first chapter, the relationships between the behavior of the variables might provide powerful insights: two variables could grow proportionally, one variable could grow while another one decreases, they could have a linear or an exponential relationship. Regardless, the observed variables don’t follow a trivial pattern as they have a lot of noise in their distribution, therefore stating a correlation through a visual assessment is not so feasible.
For this reason, regression models are assessed. Specifically for these case, Random Forest Models are assessed for representing how the different types of crime can be explained by the morphology and dynamics or the presence of vendors in the street, as well as explaining the presence of vendors as a function of the morphology and dynamics of the public space. After assessing and comparing over 500.000 models with different combinations of variables, the best fit models were determined using statistical indicators of “goodness of fit” including R2 coefficient, Mean Squared Error (MSE), Mean Absolute Error (MAE) and Root Mean Squared Error (RMSE). These are used to explain how good the models are able to perform at predicting the dependent variables.
Regression models are a statistically-based tool for identifying and assessing correlations between variables, and they can be useful for several goals, including uncovering hidden trends and patterns, predicting future events or increasing the detail of information that is not available from observed events.
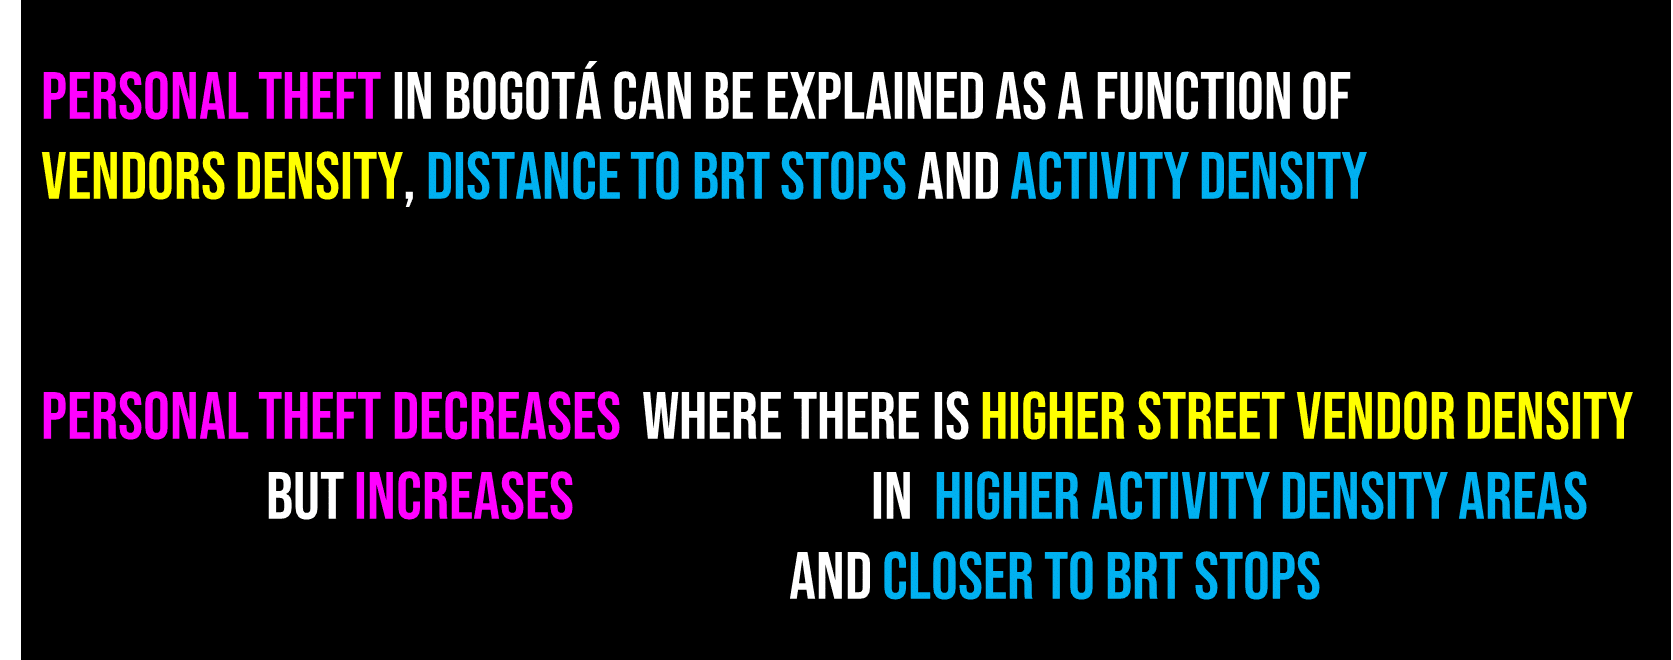
By selecting the best-fitted model of each combination of 2 variables, it is possible to obtain statistically relevant relationships between the different variables assessed. Focusing on the correlation between personal theft and vendors density, it is possible to conclude that there is statistical evidence to suggest that personal theft can be explained as a function of vendors density, as well as the mean distance to BRT stops and activity density.
This can lead to answering our initial research question, and state that personal theft decreases when vendors density increases, and that theft increases in proximity to BRT stops and with higher activity density.
But is this statistically and rigorous methodology enough to jump into conclusions?
CHAPTER 2.1: MORE DATA, MORE JUST DECISIONS?
Even if regression models are a useful tool for identifying hidden patterns in complex layers of variables, the insights stated in the previous segments of this blogpost were based on one model with the best fit. If now we take not one, but the 3% of the best fitted models, we identify that, given patterns that were predicted as clear correlations become again more noisy when incorporating or removing more variables. Therefore the apparent relationships that let us to state “conclusions” before, are not absolute truths anymore.
This reveals that even statistically significant results can give opposite results and even more, could be interpreted in many different ways, which could lead to data raising more vulnerabilities than the ones it could solve.
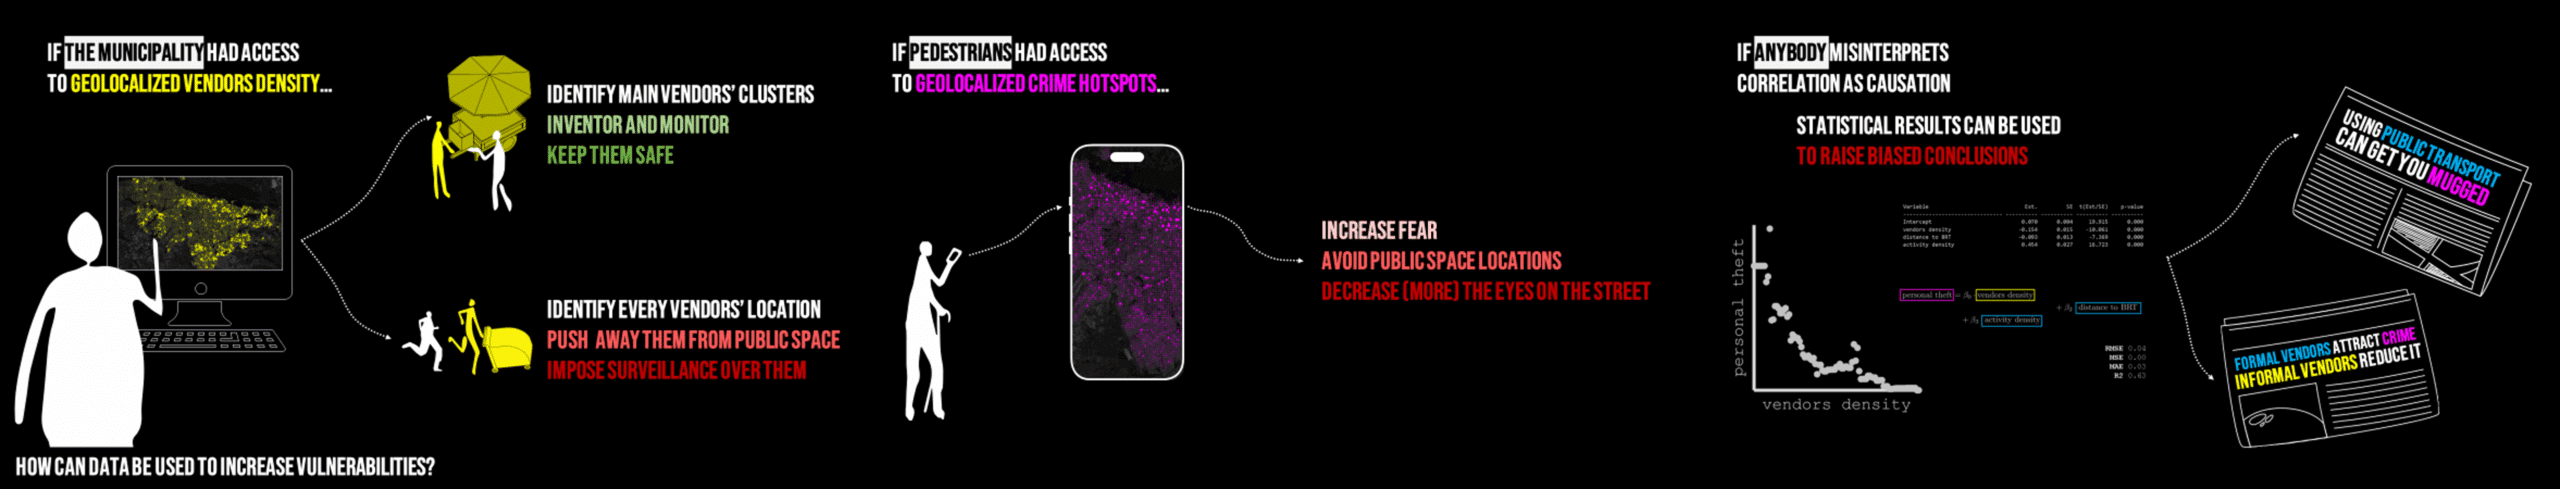
For example, the geolocation of vendors from open-source pipelines could be an useful asset into identifying and inventorying the vendors of the city. But it could also be used to increase the persecution of vendors in the public space and as a driver for oppression over these vulnerable groups.
Similarly, if the geolocation of hotpots of crime was provided to every pedestrian, it could lead into an increase in the fear and drive pedestrians away from the public space, reducing even more, the number of EYES IN THE STREET.
And finally, if any of the statistical correlations where misinterpreted as CAUSATION it could lead into biased conclusions.
This examples evidences all the risks involved in trusting data blindly and the power it could have in the wrong hands.
CHAPTER 3: MORE EYES IN THE DATA, MORE EYES ON THE STREET
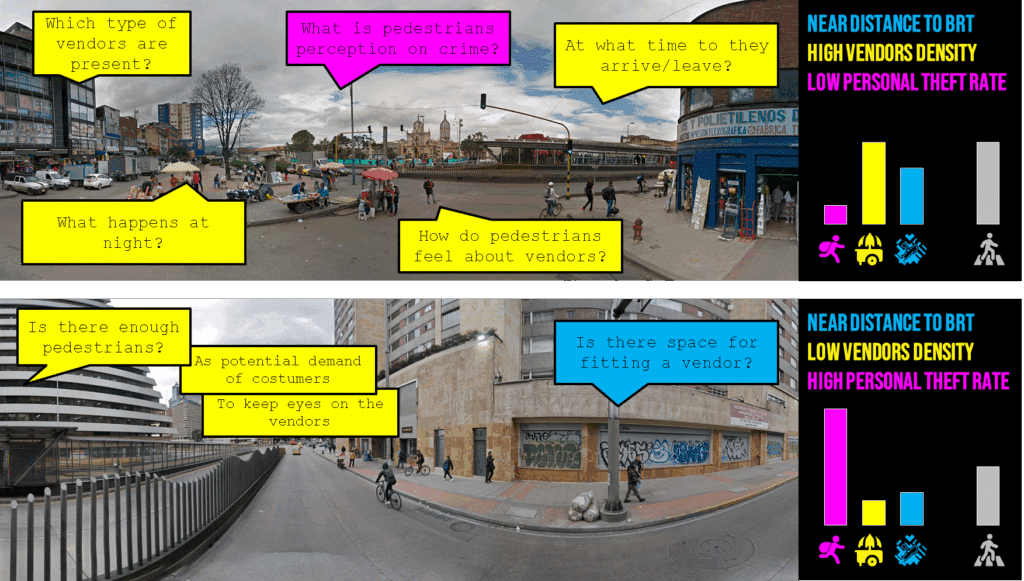
The previous disclaimers demonstrate how data-analysis could go wrong, but if used transparently it could become a very useful tool to identify hidden patterns as well as the long list of possible biases that could exist. An example of this is using the city scale spatial correlations identified to visualize macroscopic trends and prioritize case studies and intervention points. This could help assess points that have relevant dynamics seen from above, to jump into the human scale and prove how the public space actually looks, feels, is perceived and inhabited by its users. This not only allows to validate the quantitative variables mapped from above by translating them into actual elements of the urban landscape, but it also allows to identify other variables that might not have been considered in previous steps, ask more questions that could not be answered from a big-data approach and understand people’s perceptions about crime, vendors and the urban form.
With this, many ways of refining and complementing this research emerge, incorporating participatory methodologies, temporal variation of the different variables as well as a way of benchmarking and comparing the case of Bogotá against other Colombian and Latin American cities.