Environmental Analysis should be performed on every project, although that has not been the case. Previously, it was only the largest architecture and engineering firms that could afford to have staff specialize in utilizing the manual and complex software for energy modeling and climate analysis. With the advent of Ladybug Tools more and more designers, engineers and architects were given access to these powerful tools. By connecting the different specialized simulation engines into industry known design software Ladybug Tools has greatly lowered the bar for performing these greatly needed analysis at any phase of a project.
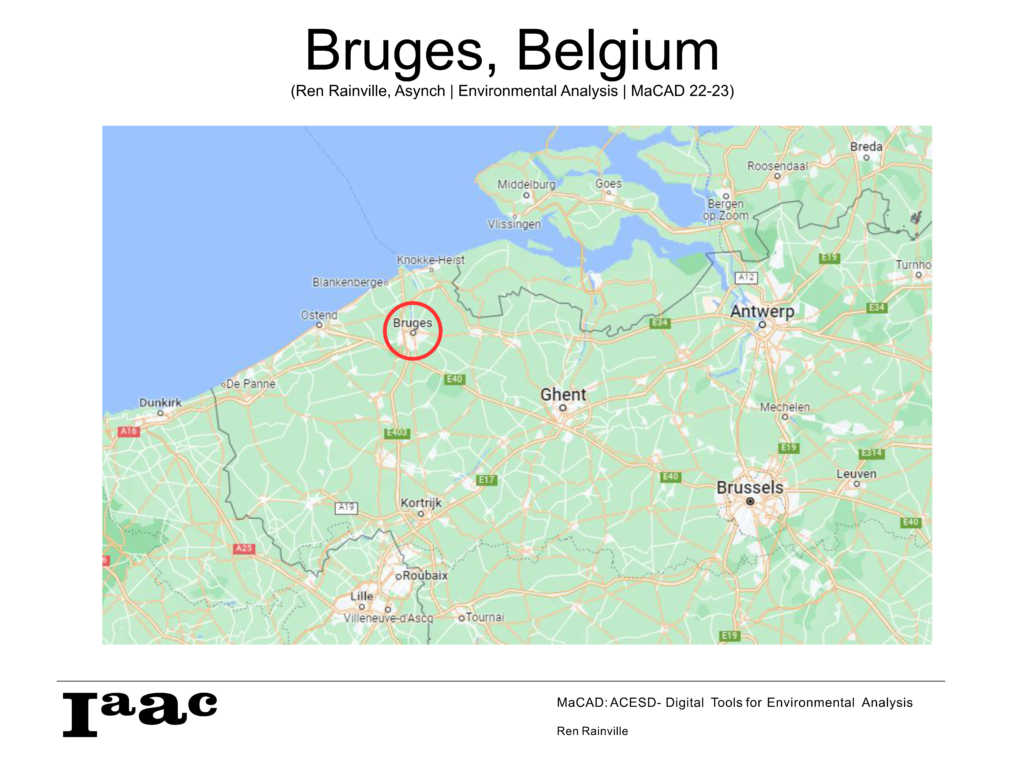
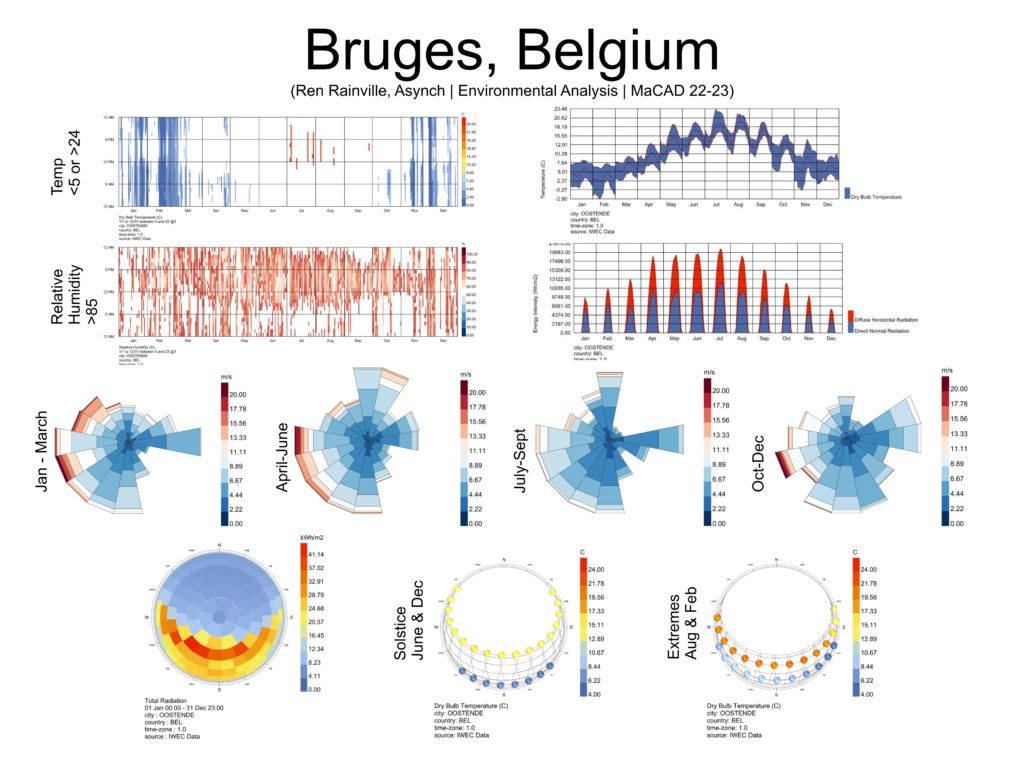
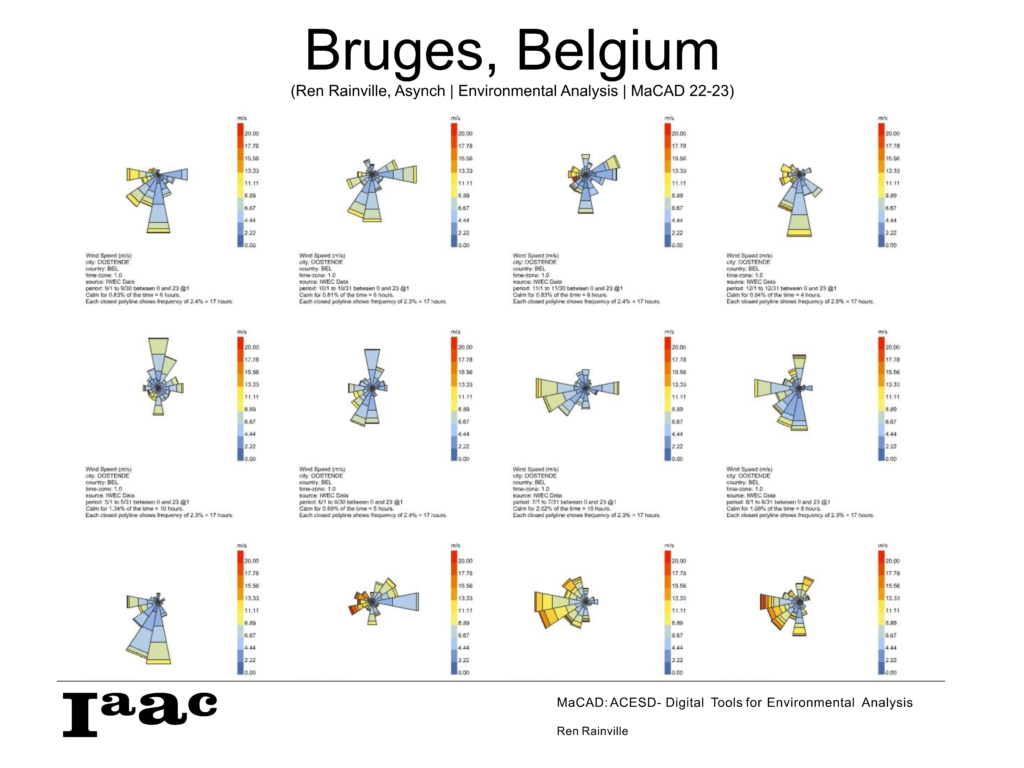
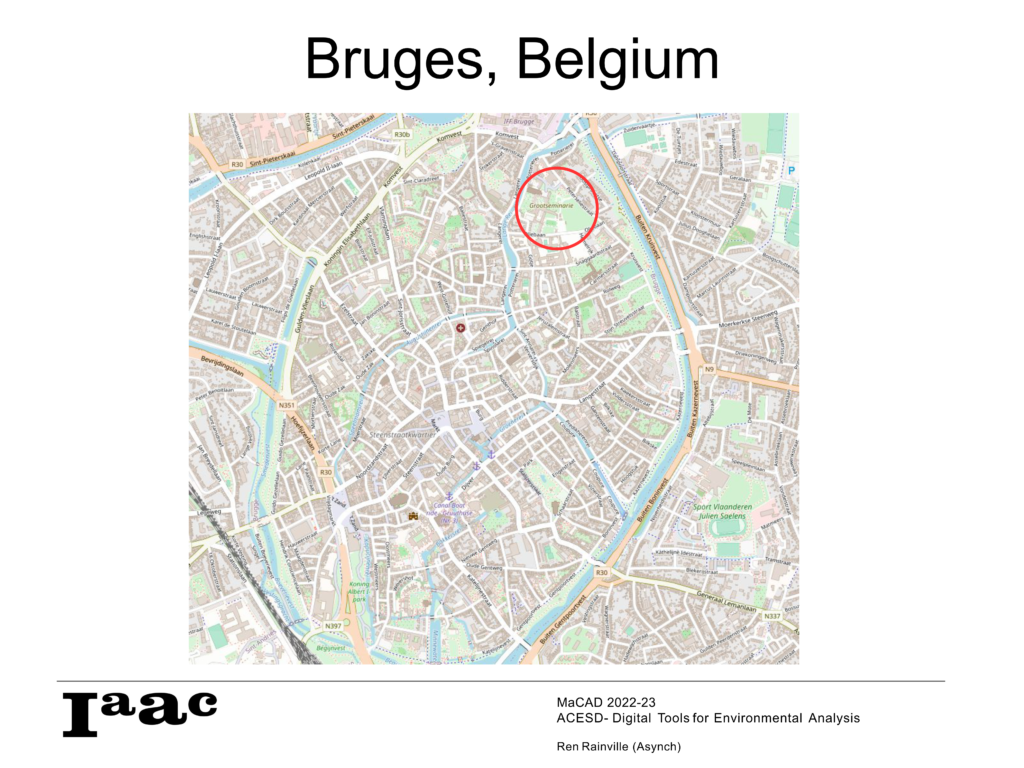
The course: Digital Tools for Environmental Analysis had an initial direction to select a city to analyze from a weather standpoint. This selection was a quick one for me, during my travels I really enjoyed my time spent in Bruges, Belgium. Upon this seleciton I immediately learned that when I had visited happened to be some of the better weather of the year. By setting conditional formatting I was able to isolate the times when the dry bulb temperature was below 5 degrees C or above 24 degrees C, within those temperatures provides a relative level of comfort. There is a high level of humidity, although, it being in a marine environment that is to be expected. The high wind speed took me by surprise, again when I had visited in April and August there could have been some high winds although they did not make much of an impression.
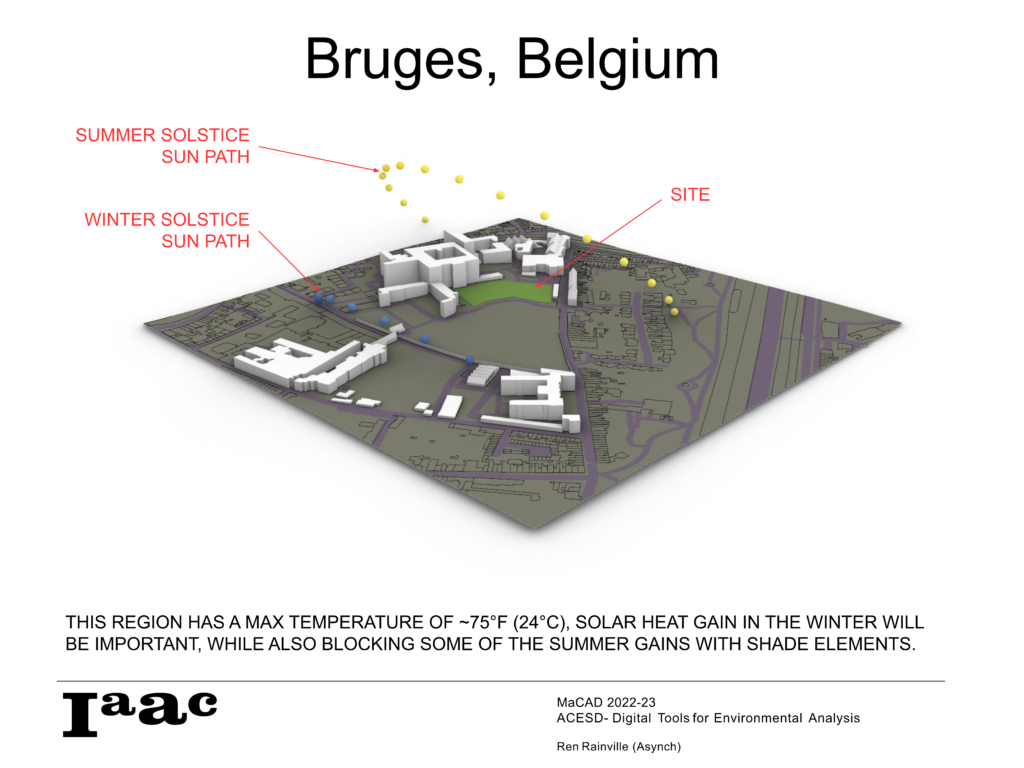
Within Bruges, I chose the UN University grounds as within an old mideaval walled city it was hard to find undeveloped land. The park areas next to one of the main buildings became the site to be analyzed. With this site, I gathered the building footprints and developed the immediate context. With this context, the north direction and the local weather file, I was able to visualize the Summer and Winter Solstice sun paths overlayed on the site axon. Beyond the sunpaths I visualized the radiation domes at the Solstices, both confirming the low angle of the sun. During the summer some of that sunlight may be shaded, and most of that sunlight should be admitted into the building during the winter to utilize the solar heat gain and to warm up thermal storage materials to radiate heat in the evening.

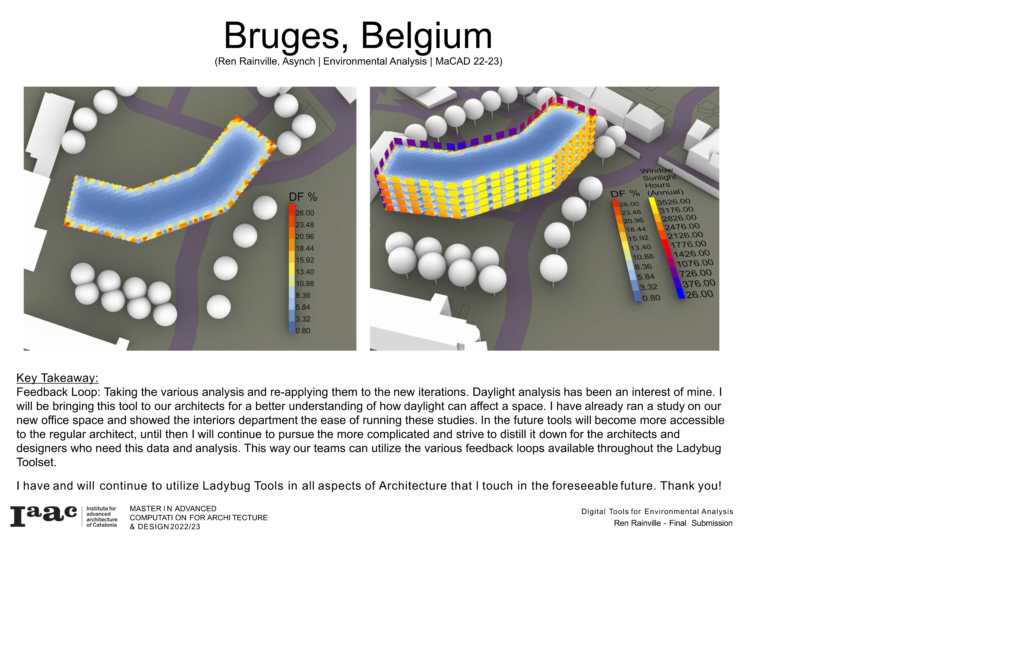
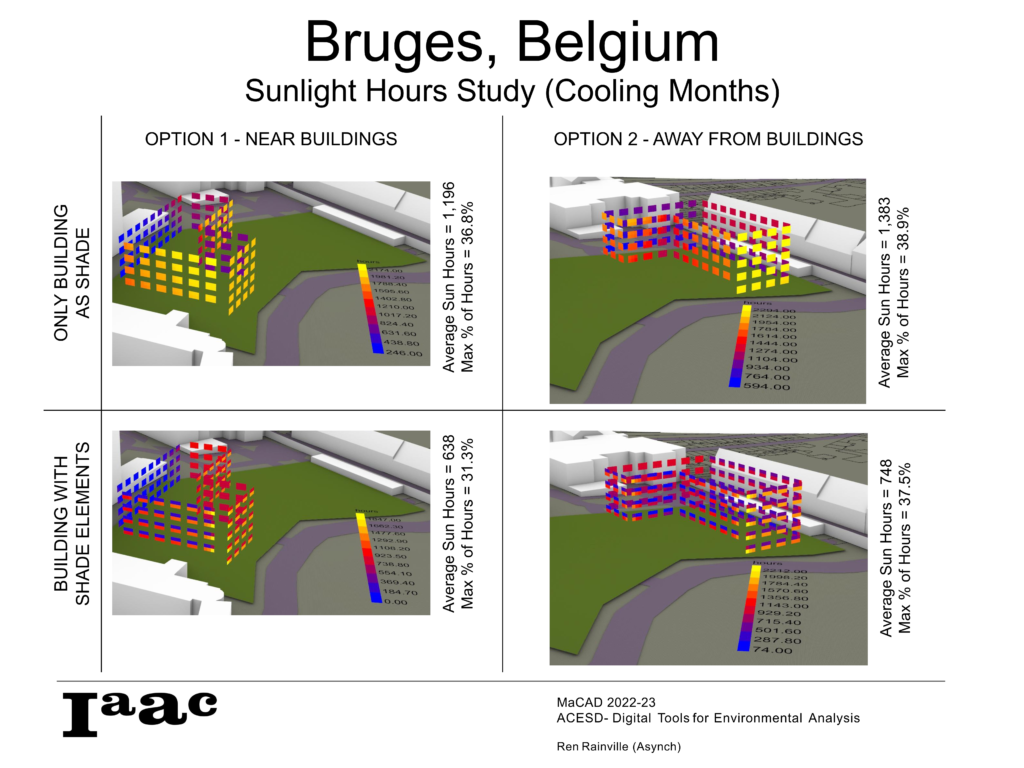
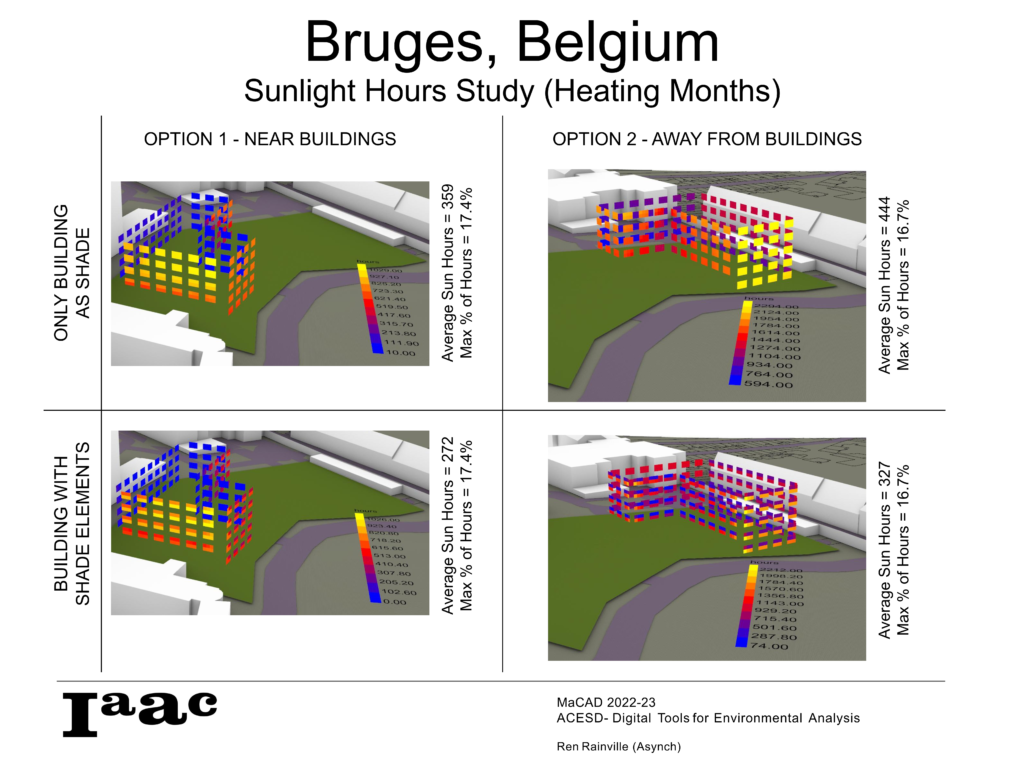
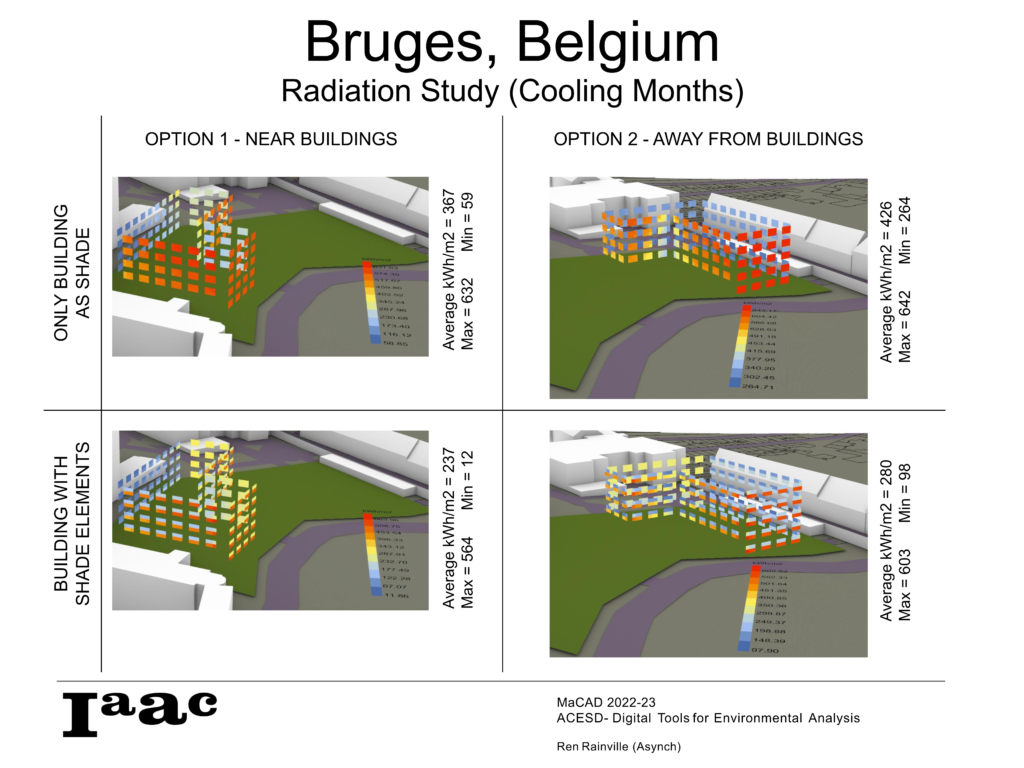
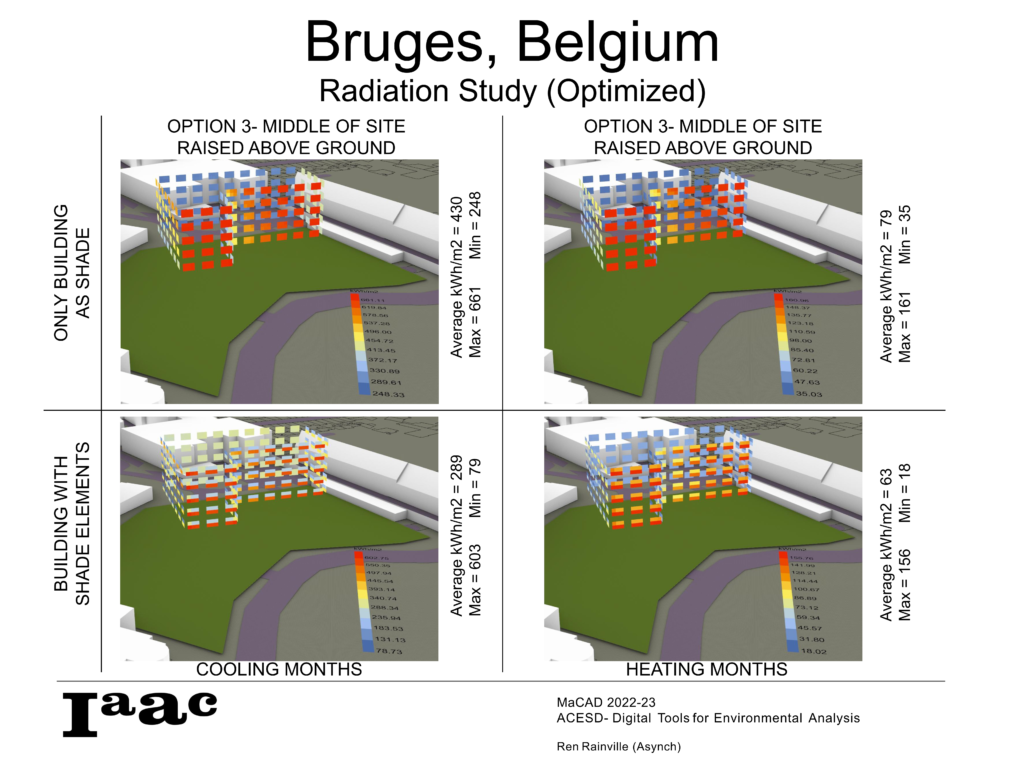
Beyond visualized weather data, a building can be analyized specifically and each group of elements can be analyzed separately or in conjunction. Windows can have sunlight hours and radiation studies to determine which may need some shading or which rooms may not get enough sunlight in the winter, thus requiring further heating. For each analysis two base options were tested, a building of similar shape located and rotated on the east or west side of the site. Then each had an optimized location. For the sunlight hours and the radiation studies this provided a central location raised above the ground. This raised program could have a complete passthrough below, it could be completely enclosed or a mix of the two. In reality it would probably be entirely or partial enclosed.
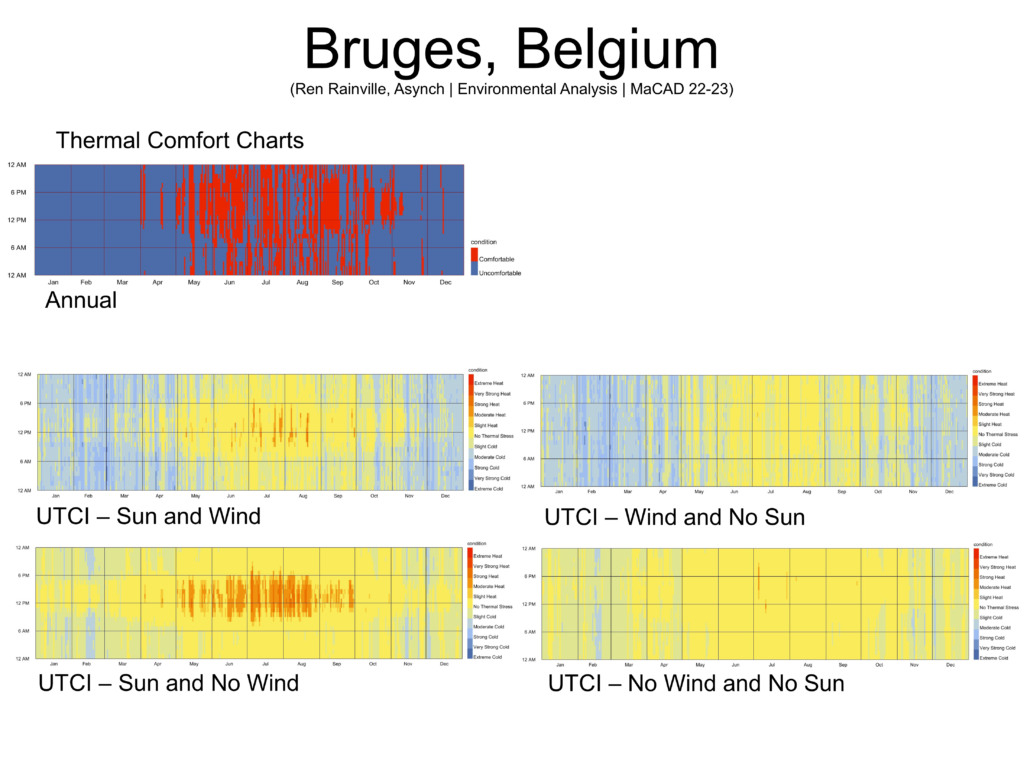
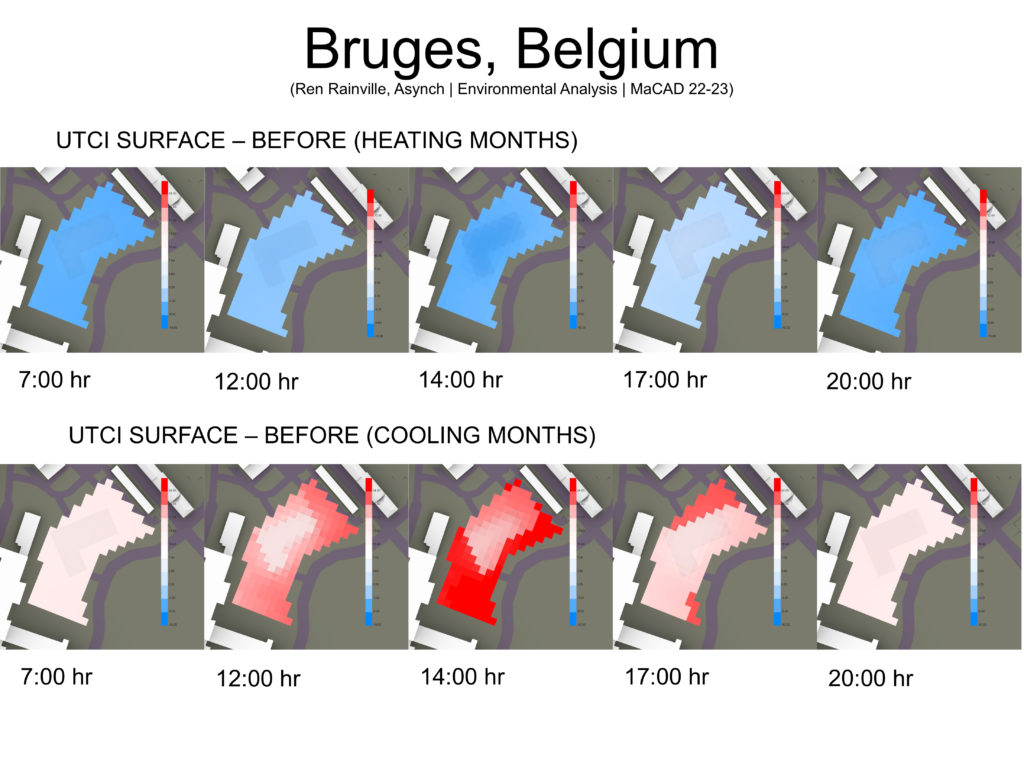
Next the class took UTCI (Universal Thermal Climate Index) into account. Within the psychrometric charts the right most polygon is the typical comfort polygon, the left is the comfort polygon with the passive strategy to capture internal heat. This shows without the ability to make use of internal heat and absorbing the solar radiation it would require mechanical conditioning for comfort. Moreover, the wind determines the comfort in this location, the sun would only make a small portion of hours uncomfortable alone. By analyzing the site UTCI, the addition of trees would benefit in the heating and cooling months.


Beyond the UTCI, internal daylight analysis was taken into account. When investigating the daylight in this region it was found that, with the low sun angle, the closer to clear glazing would be more beneficial to make use of the most solar heat gain.


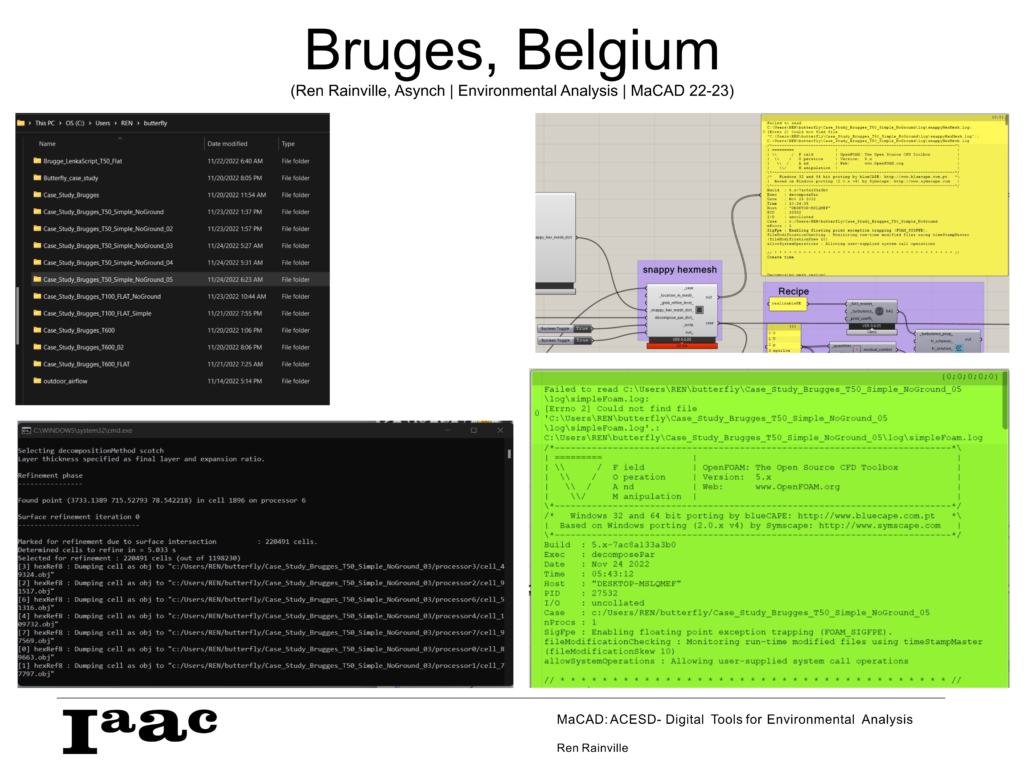
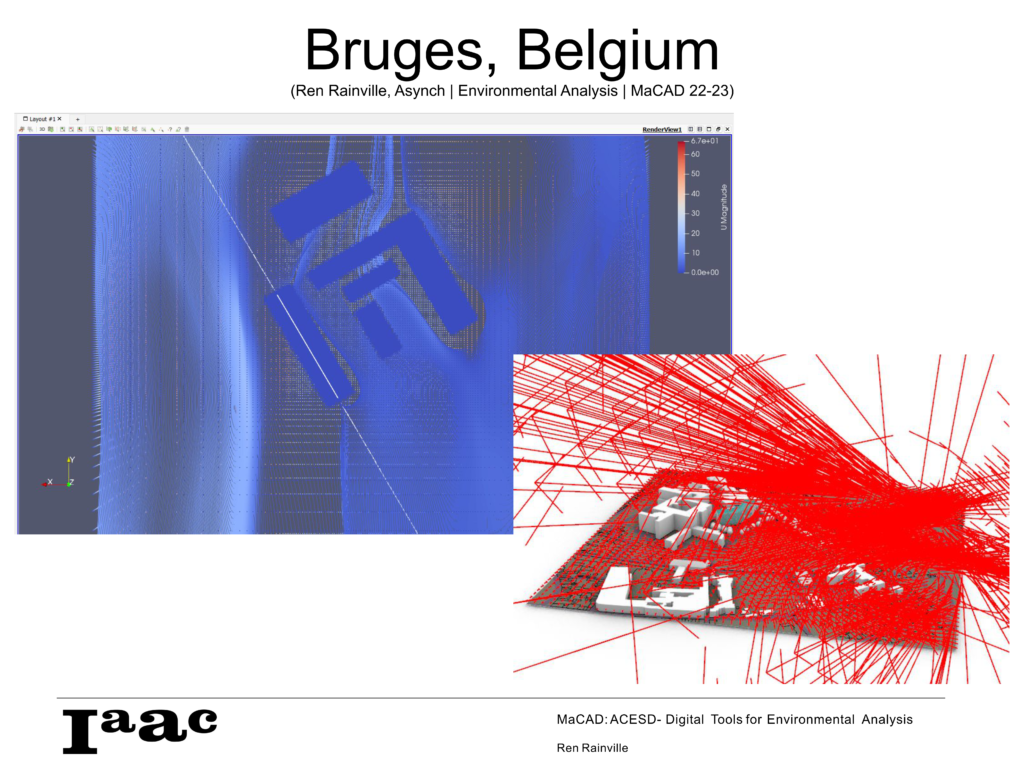
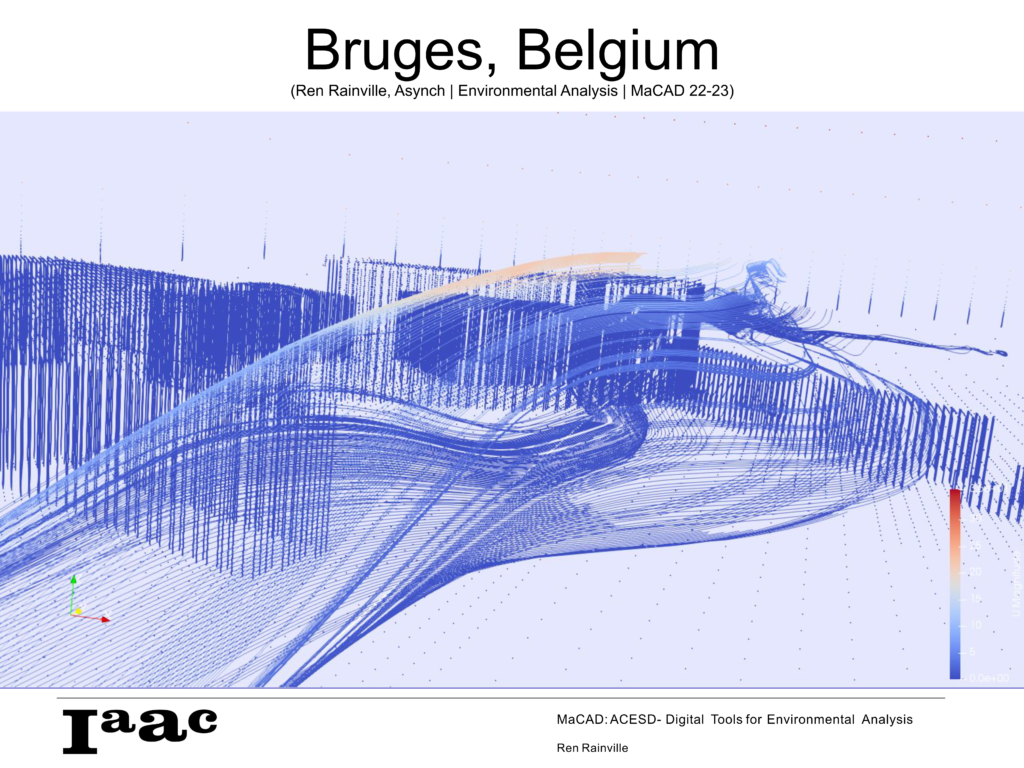
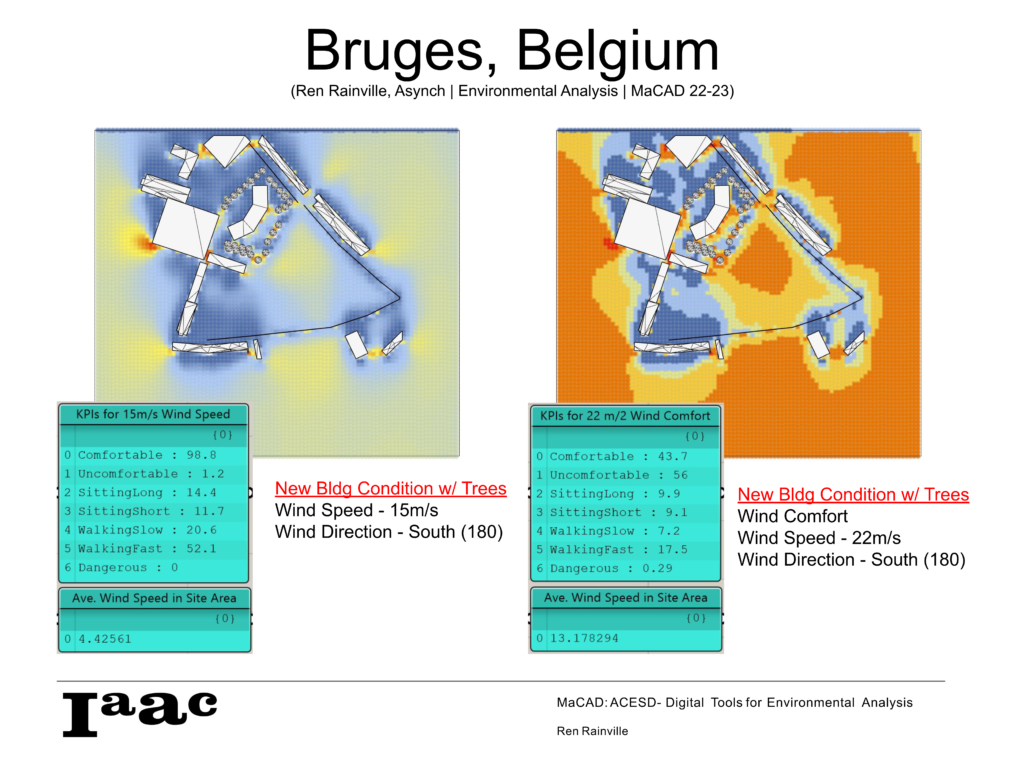
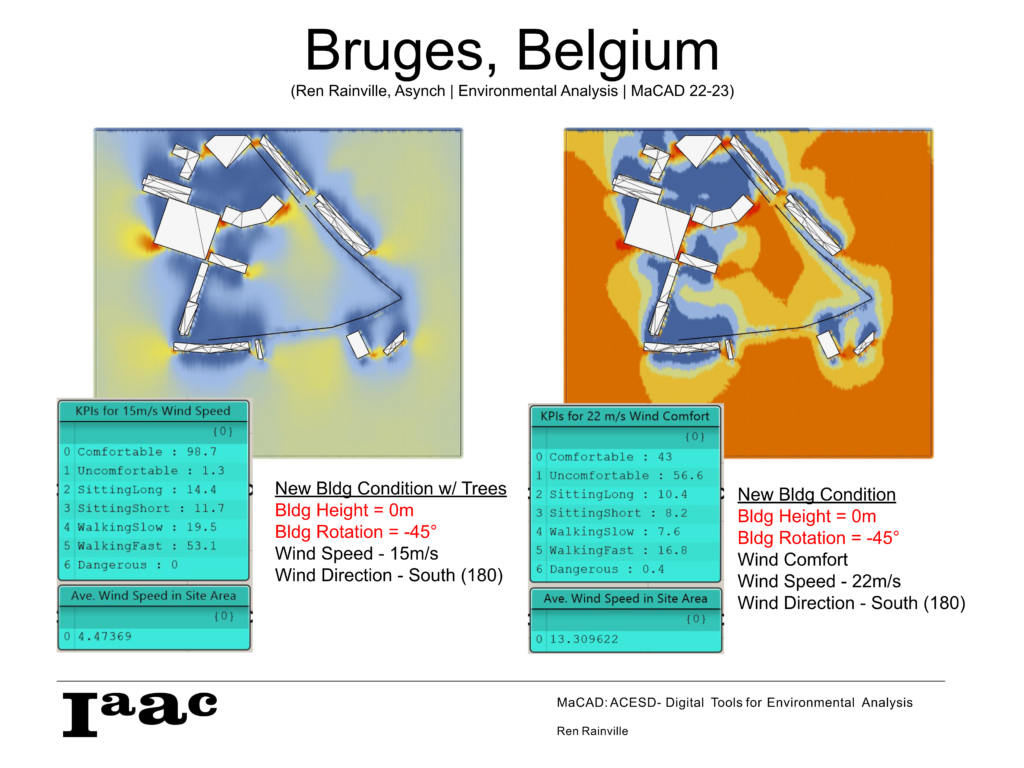
As we arrived at the wind module, I had some previous experience with Blue CFD and the Butterfly tool from Ladybug. This time around I have a better understanding how to utilize the tool. Although, it does require a level of mesh reduction, a flat site, and a reduction in site context. Though quite a bit of trial and error along with a lot of waiting to see if a wind simulation completed or processed correctly. After the trials and tribulations of Butterfly we were introduced to InFraReD where we were able to run many quickly resolved wind simulations with the machine learning backbone. With faster turn around and greater success rate more iterations were possible to determine the building’s location. The downside of the machine learning option is that it does not take into account a structure that does not sit directly on the ground. Even with this downside, it provides many benefits that it should be utilized to its maximum.

Lastly, the conclusion is with all of these tools it is imperative to use them as a feedback loop, Upon the conclusions of one analysis we need to cycle it back through previous analysis steps. There are often conflicting needs or determinizations from the various results of our analysis. Just as with Lean practices, following this Plan-Do-Check-Act process allows more intuition to be developed faster, while also utilizing the feedback loop to better understand our sites and the impacts from and upon our structures.