
It seems we can’t find what you’re looking for. Perhaps searching can help.
Sustainable Urban Technologies: From Information to Impact
Syllabus
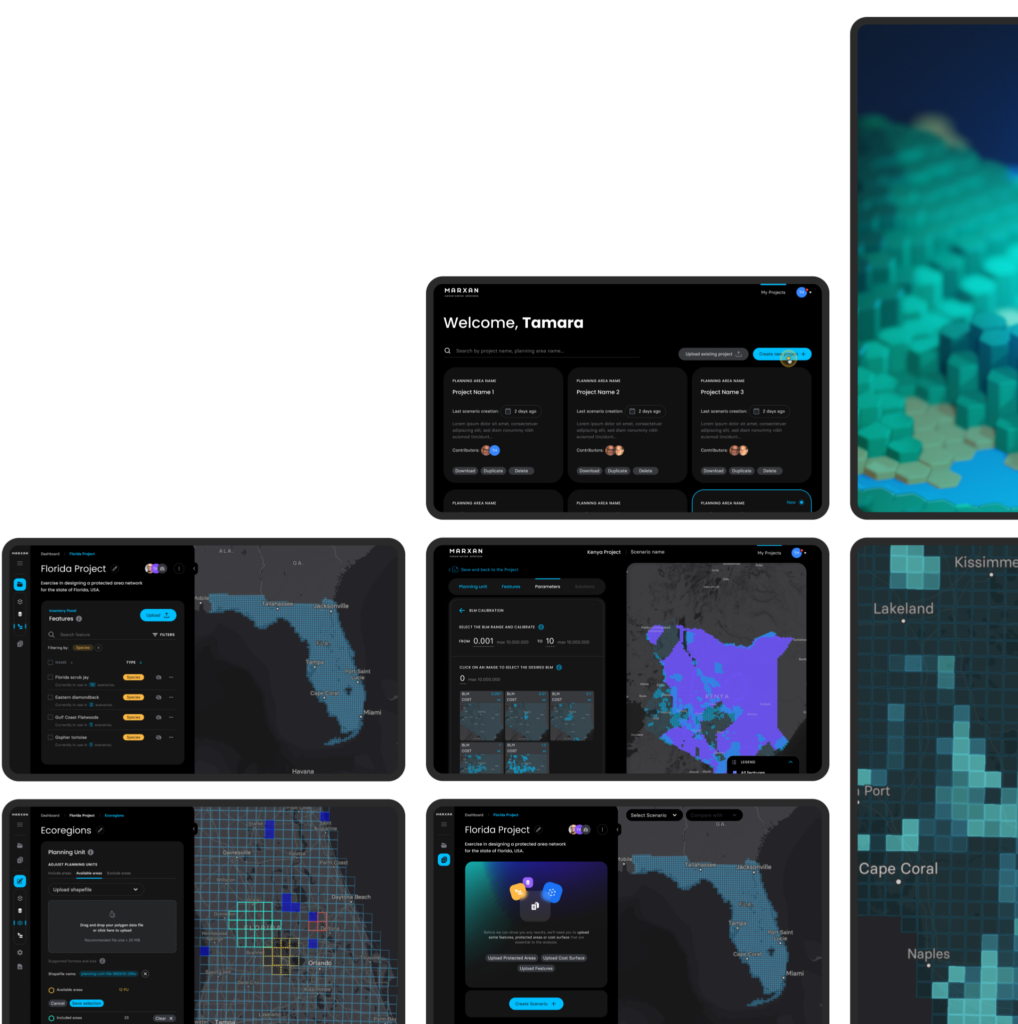
photo credits: MARXAN Conservation Solutions. The Nature Conservancy, Microsoft. Designed and Developed by: Vizzuality
Description
We urgently need worldwide climate, ecological and societal action.
Data and technology can enable that action, but only if it is impact-driven and strategically designed for user needs. When telling a story, it must be supported by data, undoubtedly, but it should also be a narrative that connects with the user, encourages interaction, and effectively communicates why they should care, guiding them through their decisions.
The aim of this course is to gain a broad understanding of the various tools and techniques used to understand and analyze specific challenges within a territory.
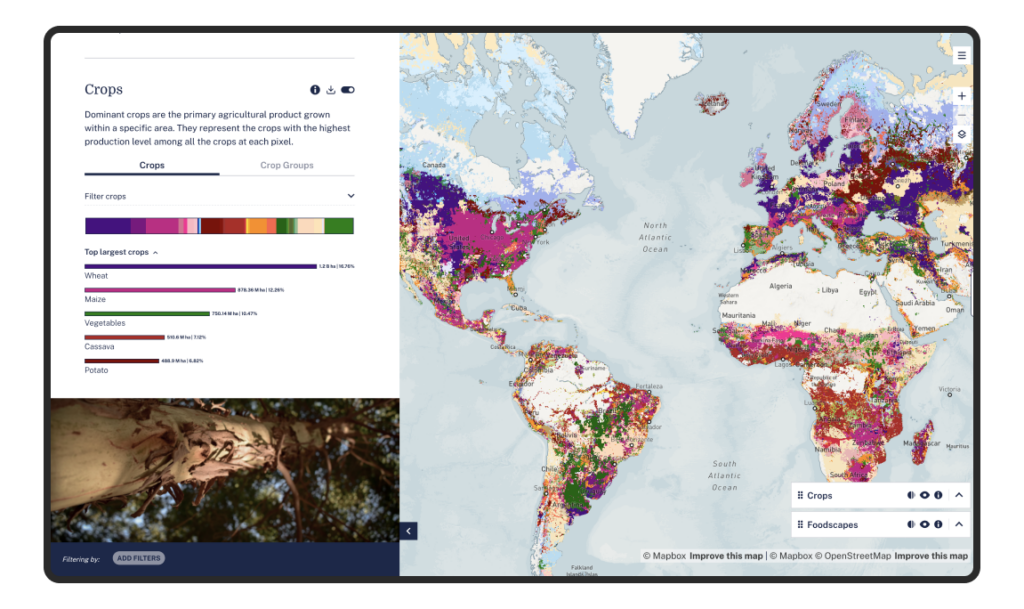
photo credits: FOODSCAPES The Nature Conservancy. Designed and Developed by: Vizzuality.
Through the study of various examples, we will grasp the fundamentals, techniques, and basic principles of data visualization and mapping. This will enable us to craft a coherent and comprehensive narrative, thus developing impactful projects that address real societal needs.
By utilizing historical examples of how city planning influenced inequality and segregation in different cities, we can list and understand which indicators are necessary to identify current issues and thereby reduce inequality and segregation.
Learning Objectives
At course completion the student will:
- Understand techniques and principles of data visualization.
- Recognize the significance of open data.
- Explore key concepts of urban inequality through various examples.
- Acquire the necessary tools to craft a coherent and comprehensive narrative.
- Become familiar with a map creation tool (e.g., Mapbox).
- Begin using application design tools (e.g., Figma).
Faculty
Projects from this course
Nothing Found