Syllabus

Credits: https://abracd.org/

Description

From government surveys to mobile apps, from smart devices to social networks, data has been around us for all human history and its generation has skyrocketed in the past 15 years making it a vital aspect of our daily life when we are monitoring our health, we are choosing our clothes, our food, our entertainment, our representatives, our partners, our routine. There is almost not a single industry that is not using it constantly nowadays.

With this in perspective learning how to deal with data is not a matter of choice anymore.

The Python for Urban Analytics course aims to introduce some key aspects of the vast world of data science and how to use them in our main objective in MaCT: understanding and designing cities.

To do that we will learn some of the various types of data sources and how to deal with them, how to analyse a data set, manipulate it, visualize it and extract useful information from it using one of the most used programming languages at the moment: Python.

By the end of this course, the students will be able to enrich their projects with comprehensive data analysis and transform data into knowledge and new insights.


Learning Objectives

At course completion the student will:

  • Understand the basic concepts of programming, being able to read, write, understand and apply Python codes in daily tasks;
  • Understand basic concepts of data analysis, data mining, data manipulation and visualization;
  • Understand and recognize various types of data and data sources and be able to use them as a key source for academic daily life;
  • Get used to the most common Python tools for data science such as Jupyter, Pandas, Numpy, Plotly, Leaflet and others;
  • Build a useful dashboard for understanding their project context and getting insights from it, using it as a tool for other courses and seminars;


Faculty


Projects from this course

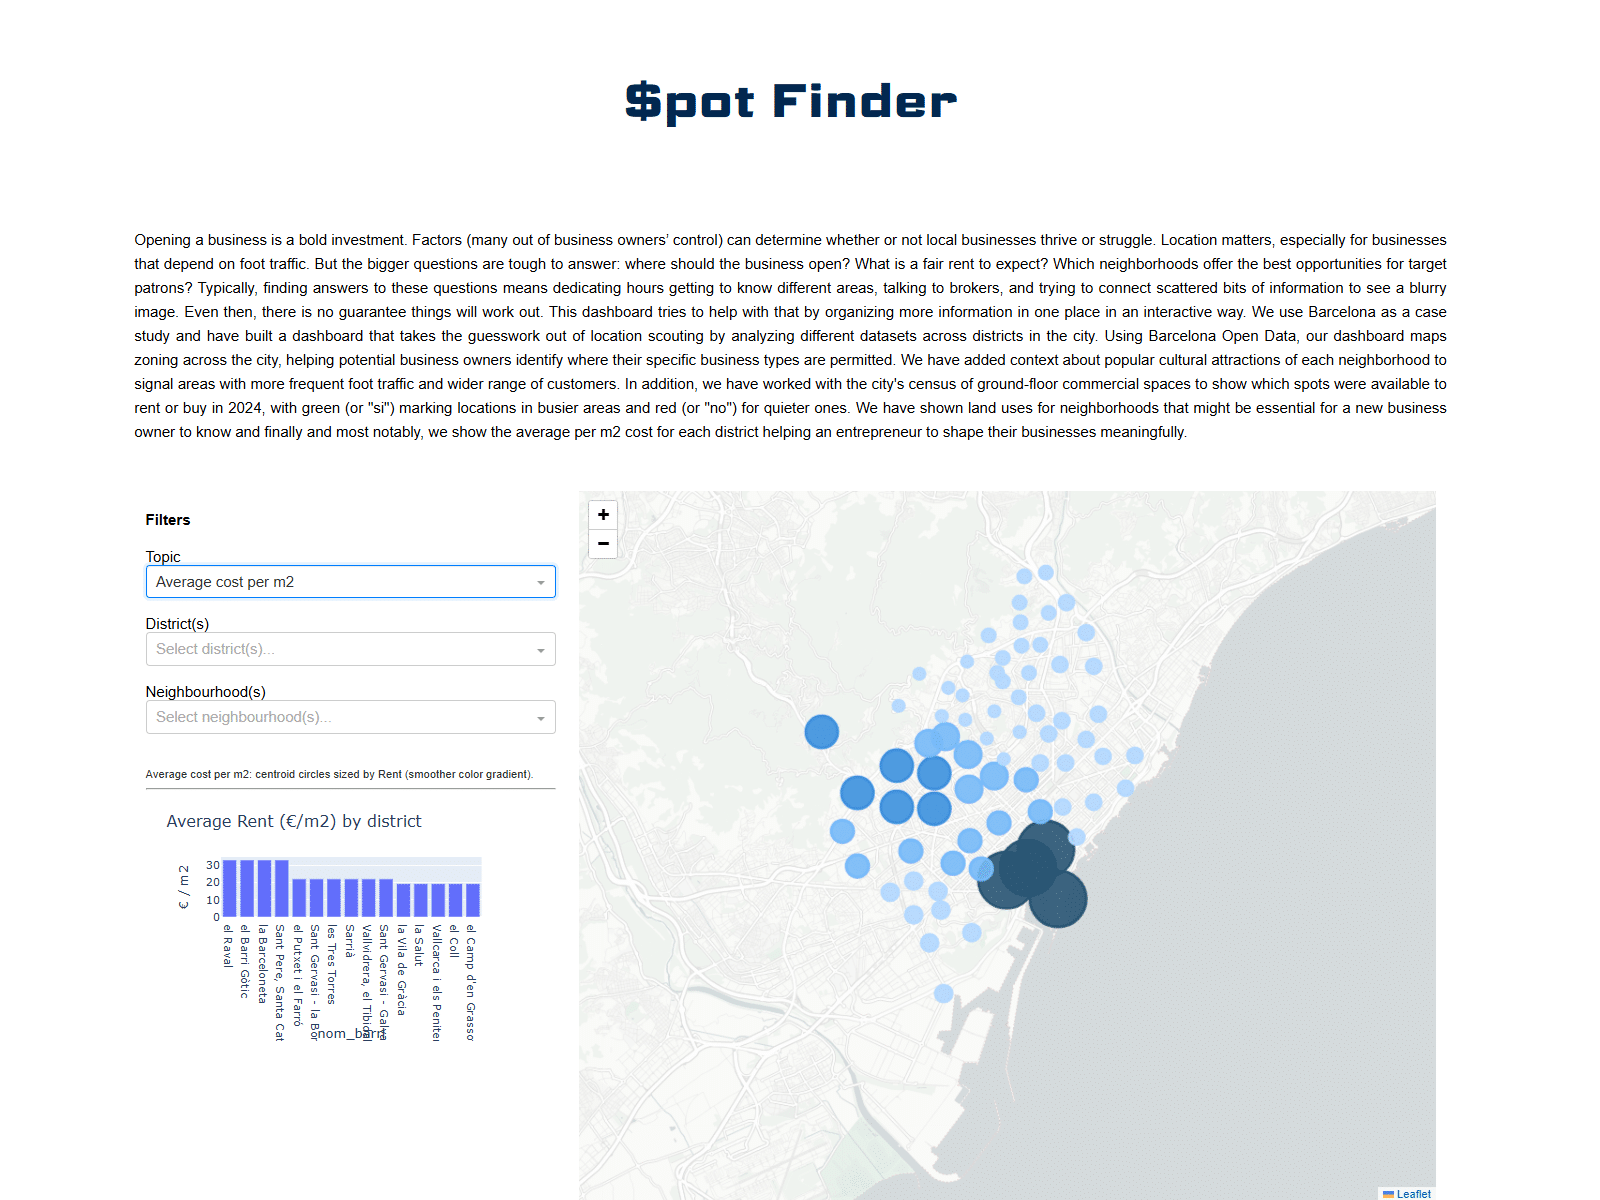
How to park in Barcelona?

Parking is an important element of urban infrastructure, influencing the functionality, accessibility, and sustainability of cities. In Barcelona, where neighborhoods vary widely in character, density, and urban design, parking serves as a lens through which we can better understand the city’s transportation dynamics and spatial planning. This research began with an exploration of key questions … Read more

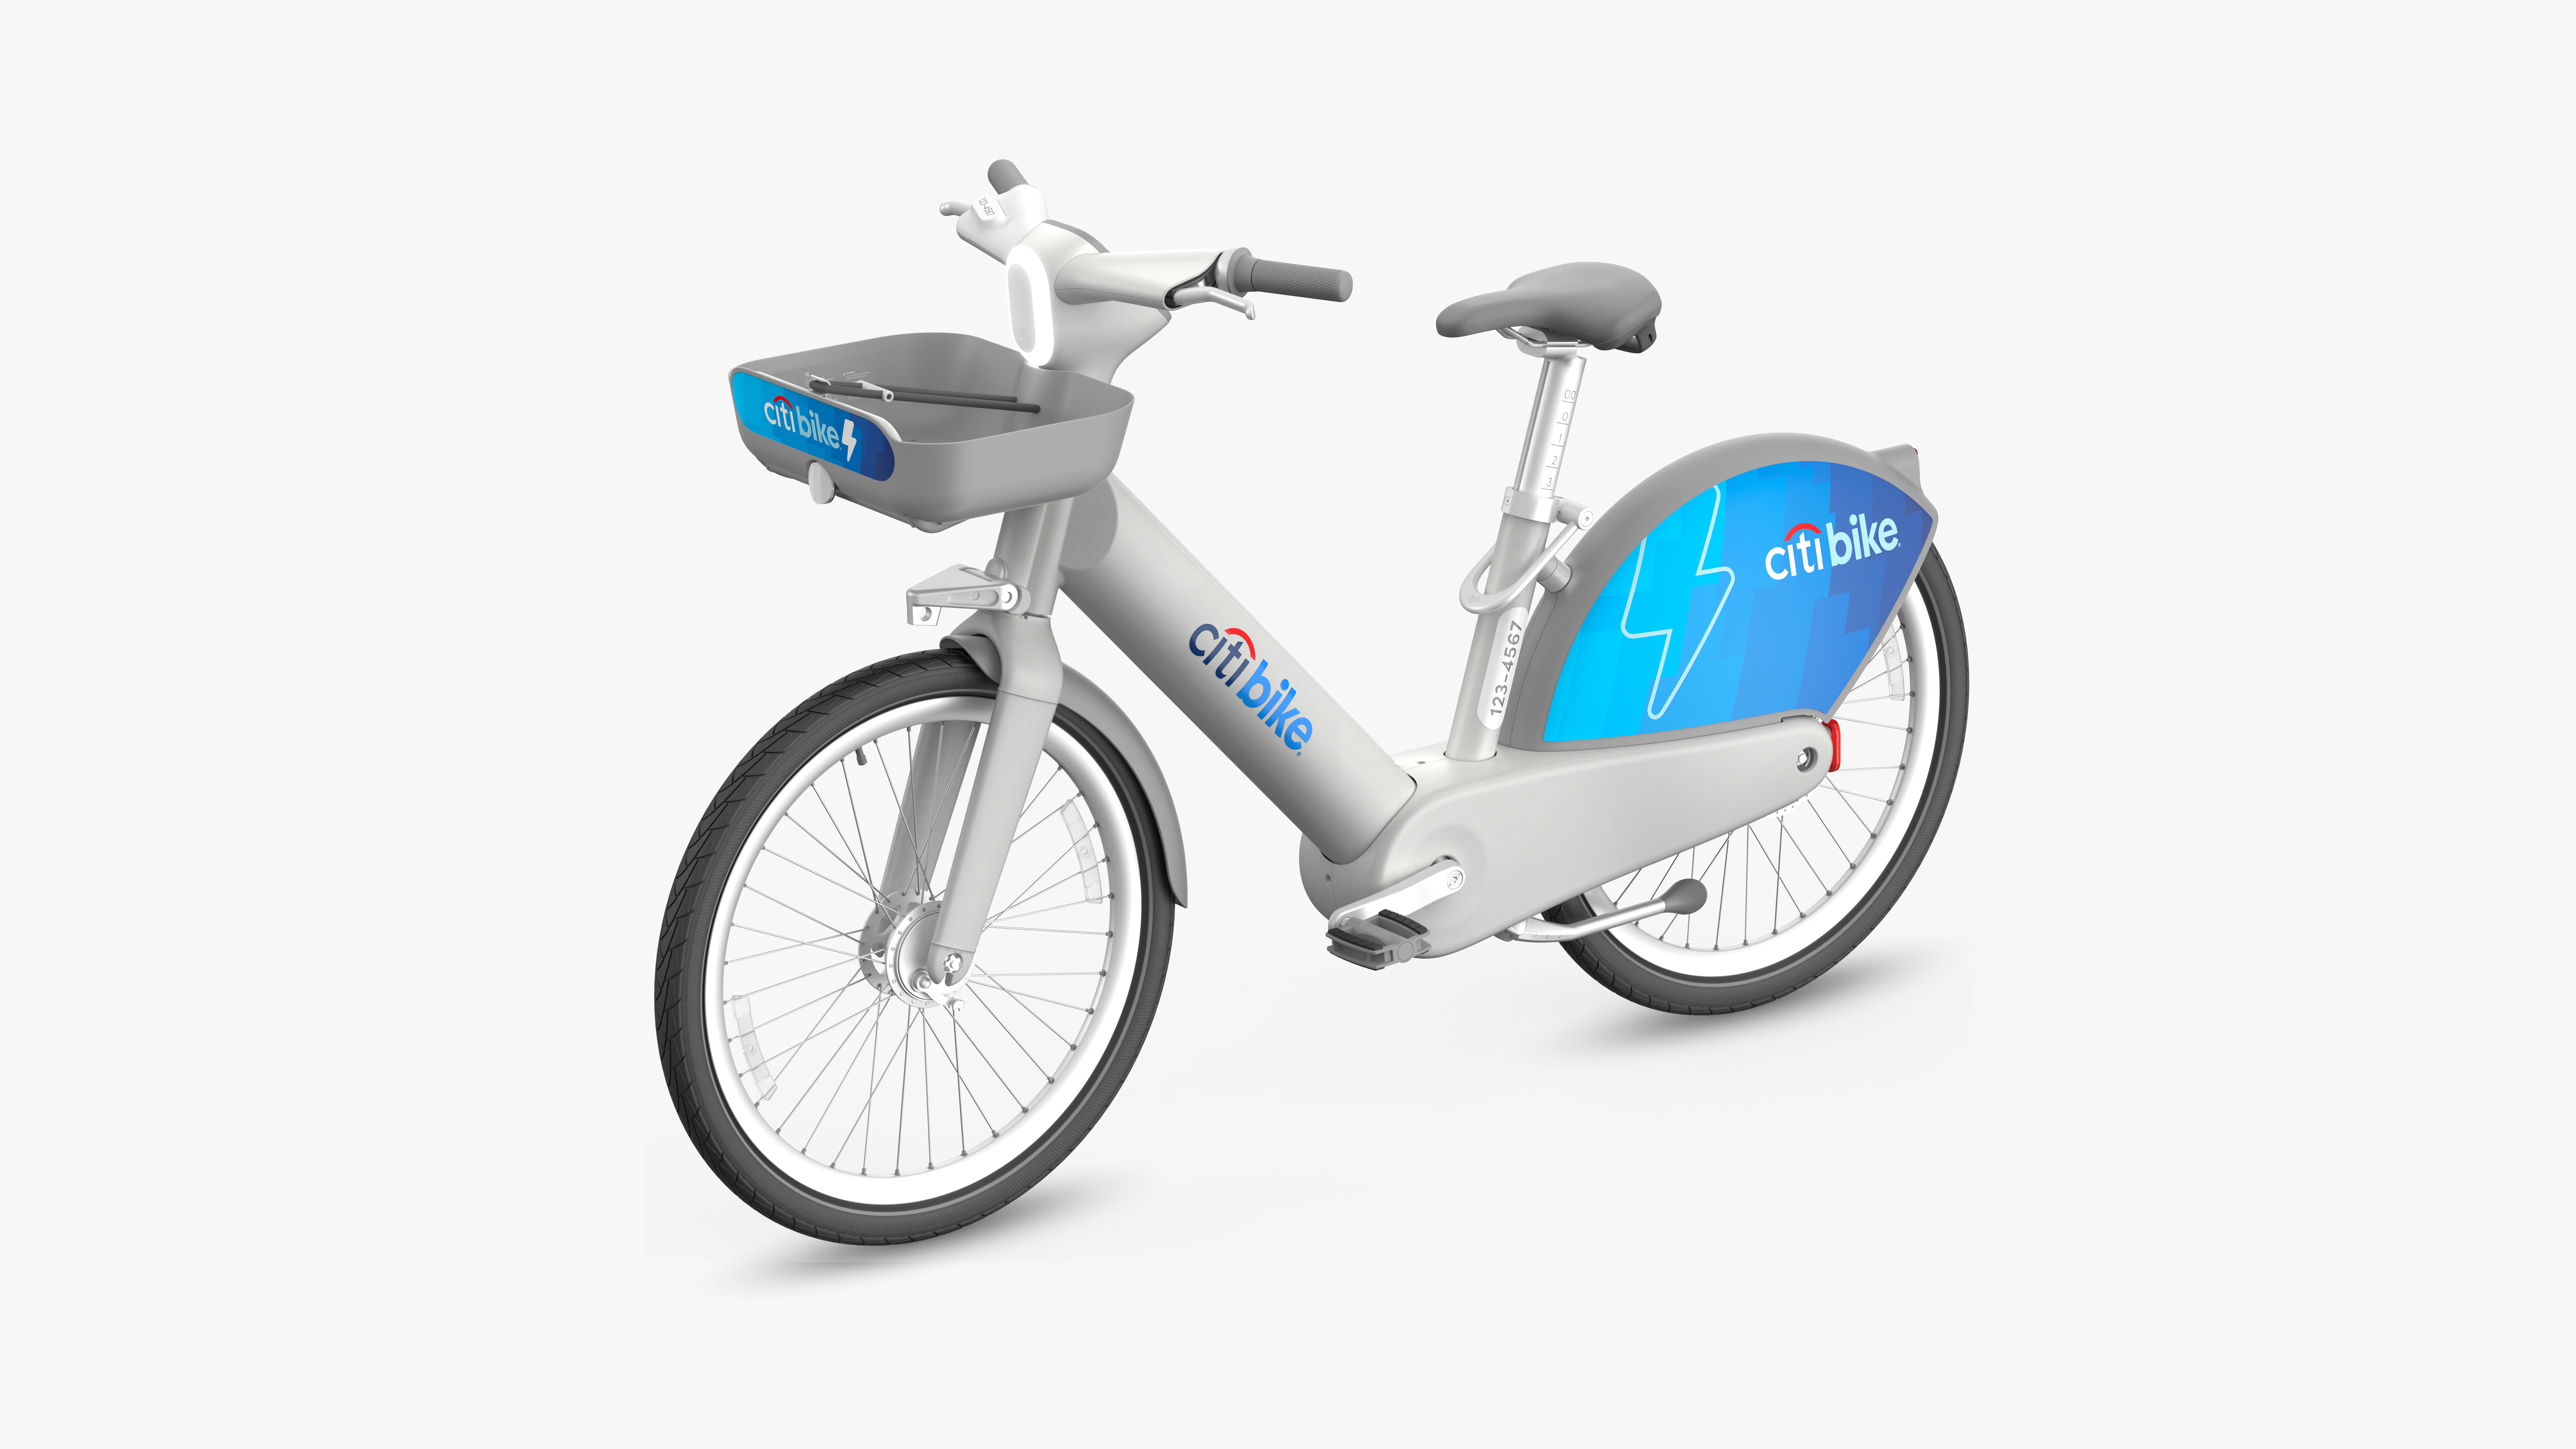
THE CITI BIKE NETWORK IN NEW JERSEY ANALYSIS

The exploratory analysis performed by Josefina Ovalle, Maja Mawusi and Michał Modelski We present you an exploratory analysis on the New York City’s Citi Bike network in New Jersey. We chose the latest dataset, from October 2024, that gives us data on bike stations, bike types, bike users, and bike usage over time. The choice … Read more

US time use change during and after COVID

ABSTRACT Derived from the 2020 pandemic sanitary measures for Covid-19, Google created the Community Mobility Reports, which provide valuable insights of how people’s mobility changed as a result of the established health policies. The objective of this analysis was to understand how United States residents’ mobility behavior changed over time due to the COVID-19 pandemic. … Read more

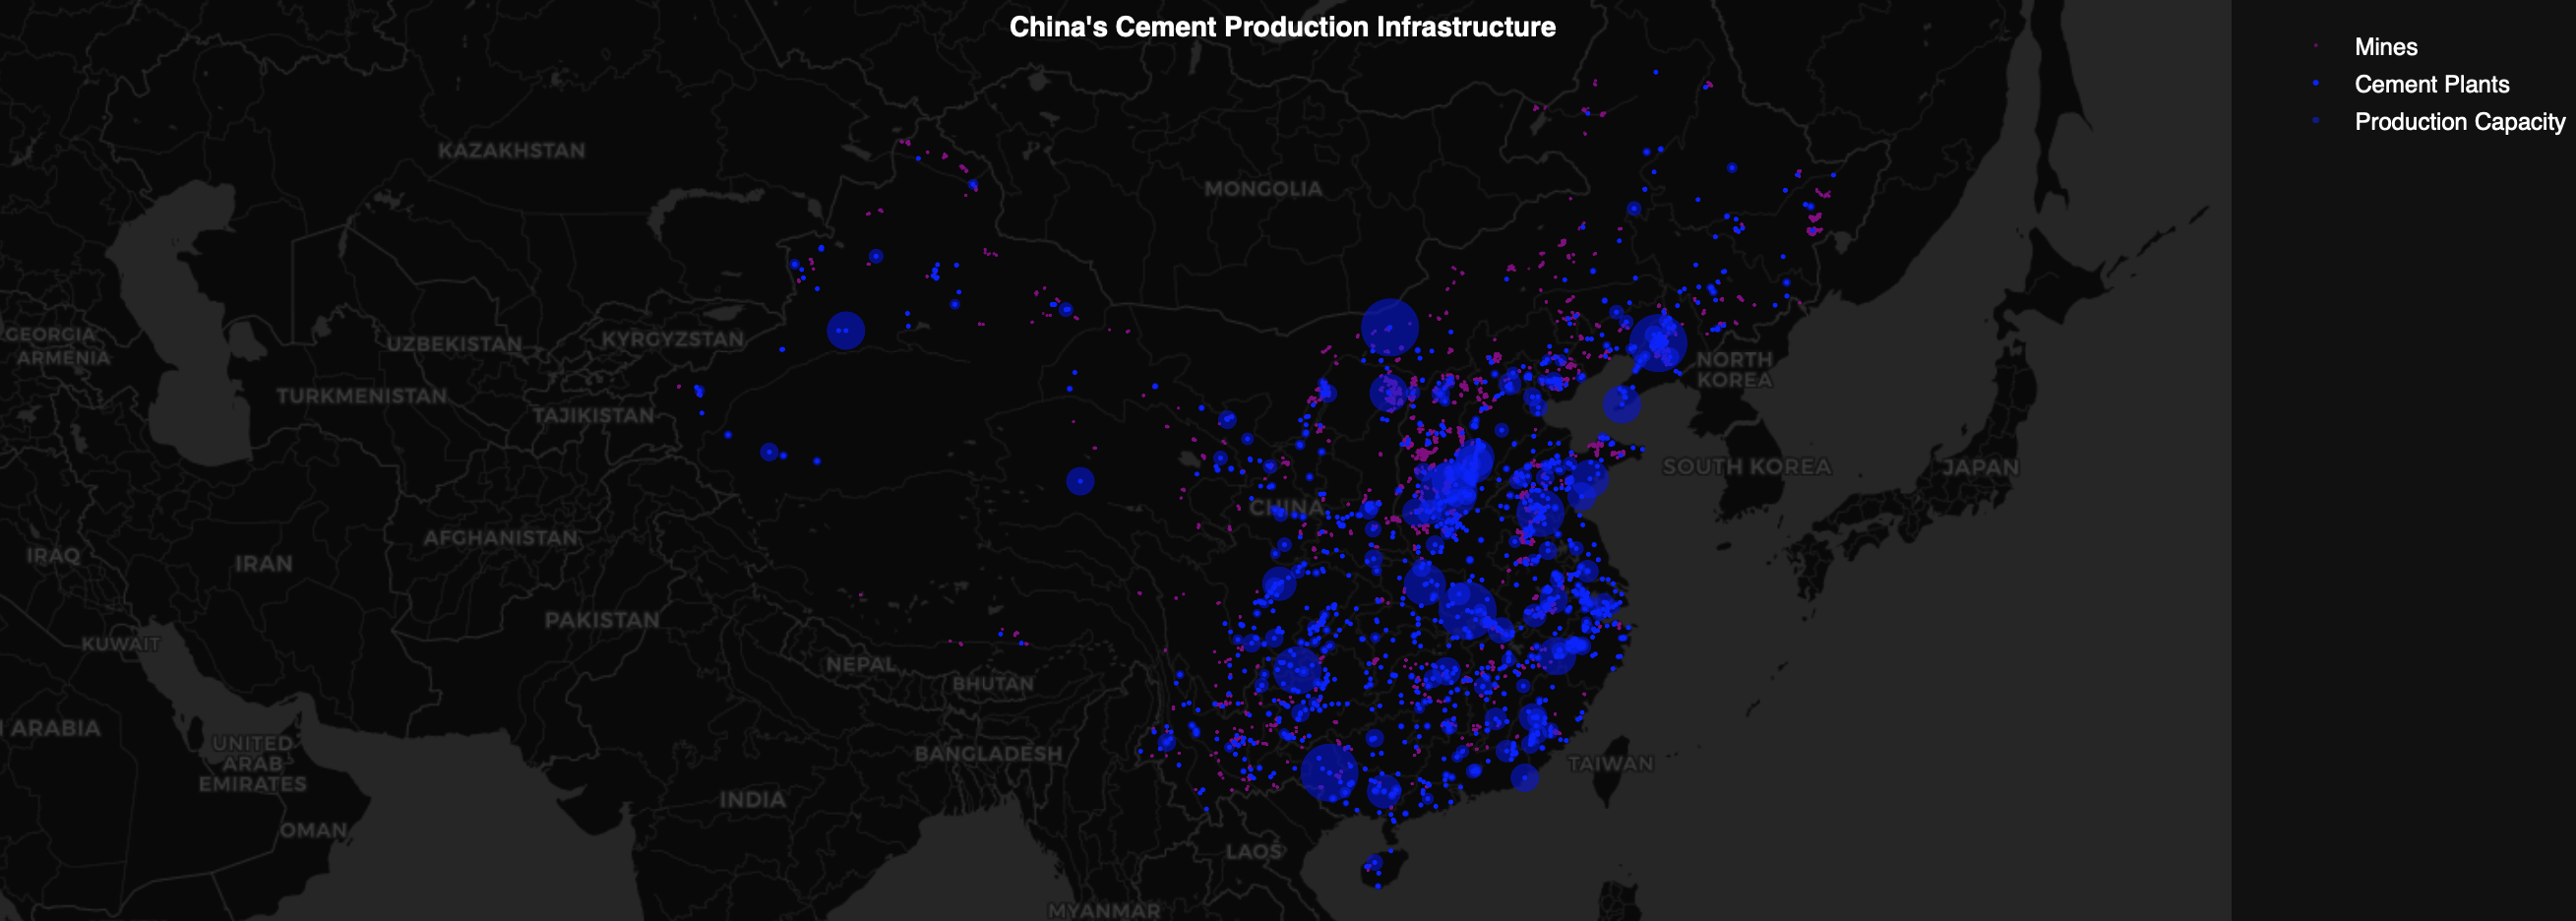
The Global Story of Cement and Its Environmental Impact

The Backbone of Modernity – Since its invention in 1842, Portland cement has become a cornerstone of modern construction. Its role in shaping cities, infrastructure, and economies is unparalleled, but this comes at a cost. Cement production is energy-intensive, emits significant carbon dioxide, and has become a key driver of global greenhouse gas emissions Cement … Read more

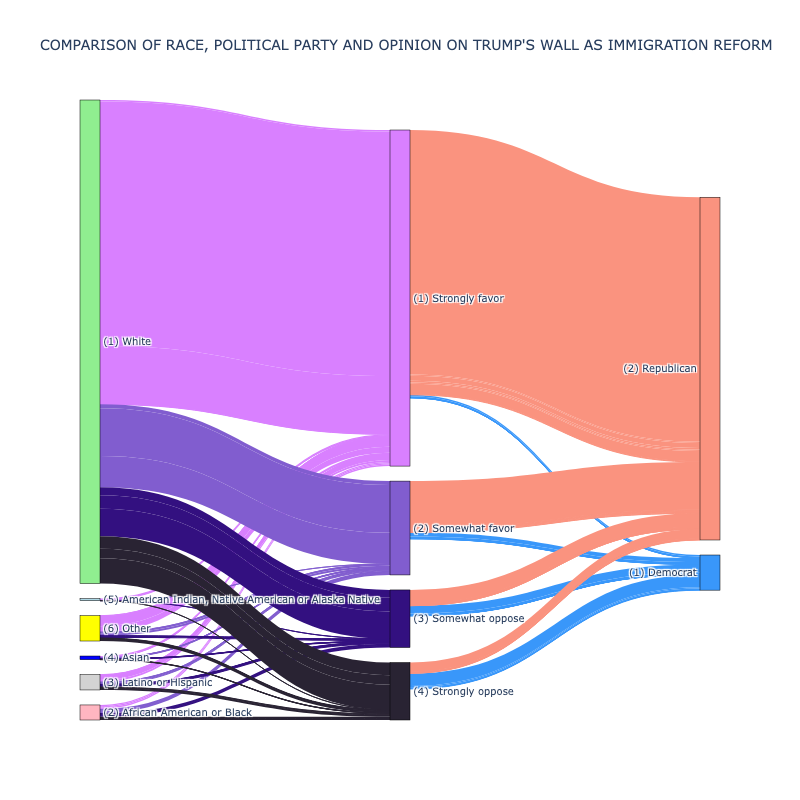
UNMASKING U.S. VOTES

As an introduction to Python, this course explored the foundations of data analysis and visualization using a variety of powerful libraries, including pandas, geopandas, contextily, matplotlib, numpy, seaborn, and plotly. The project below demonstrates the practical application of these tools. Inspired by the recent U.S. election, we focused on analyzing voter behavior and the factors … Read more