Taking this city as case study, I implemented multiple climatic analysis tools in combination with a sensible assessment of results in order to achieve the best environmental performance of the site.
As first approach, diagrams of climate factors were collected to compare them to west Europe conditions.
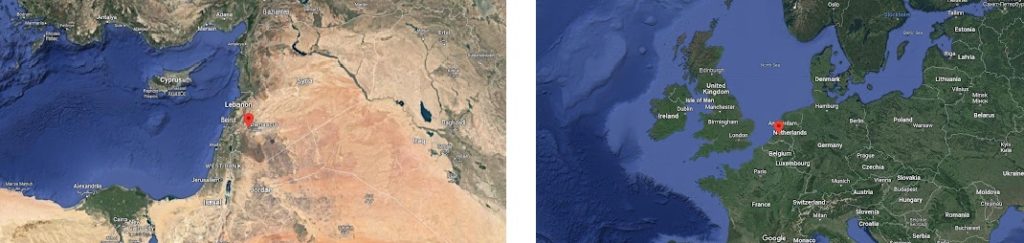
Damascus {33°30’42.6″N 36°18’18.7″E}
Weather last read: 21/12: 11°C
Wind: S at 16 km/h
Humidity: 63%
Area: 105 km²
Population: 2,503,000
Rotterdam {51°54’54.9″N 4°26’46.3″E}
Weather now 21/12: 5°C
Wind S at 16 km/h
Humidity: 78%
Area: 324.1 km²
Population: 623,652 (2015)
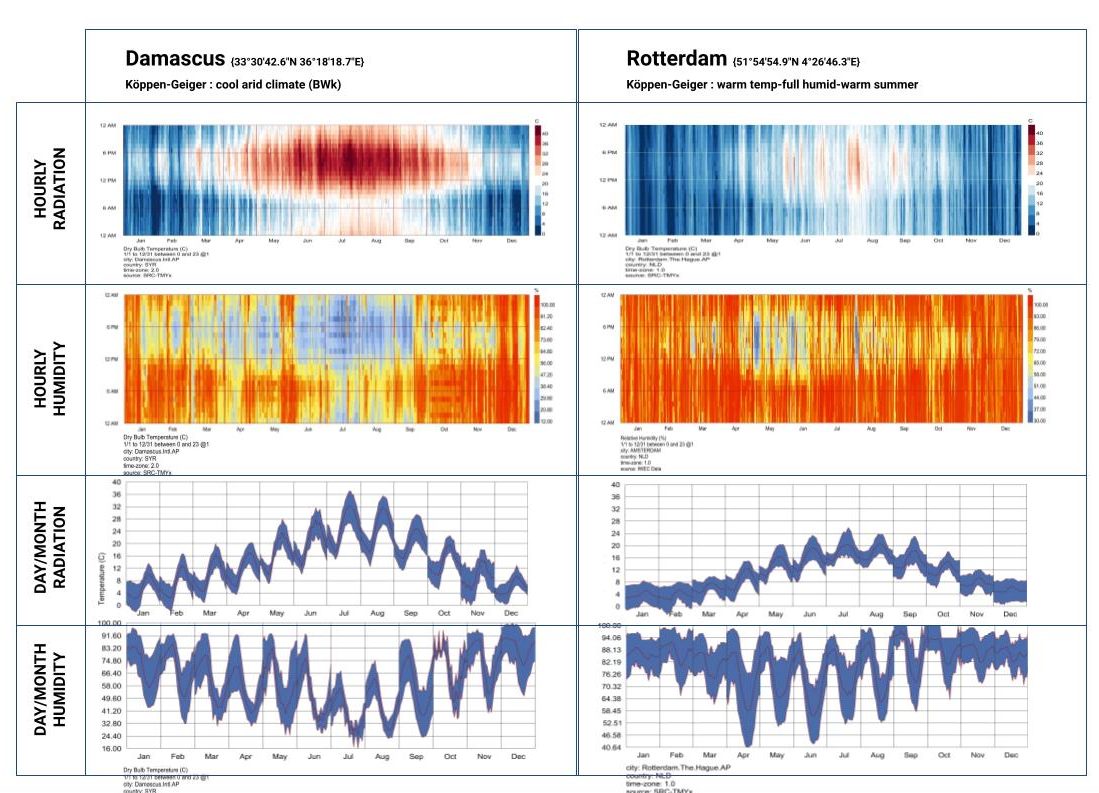
The lesson was to focus the climate performance on the harsh temperatures between 12 and 7 PM.
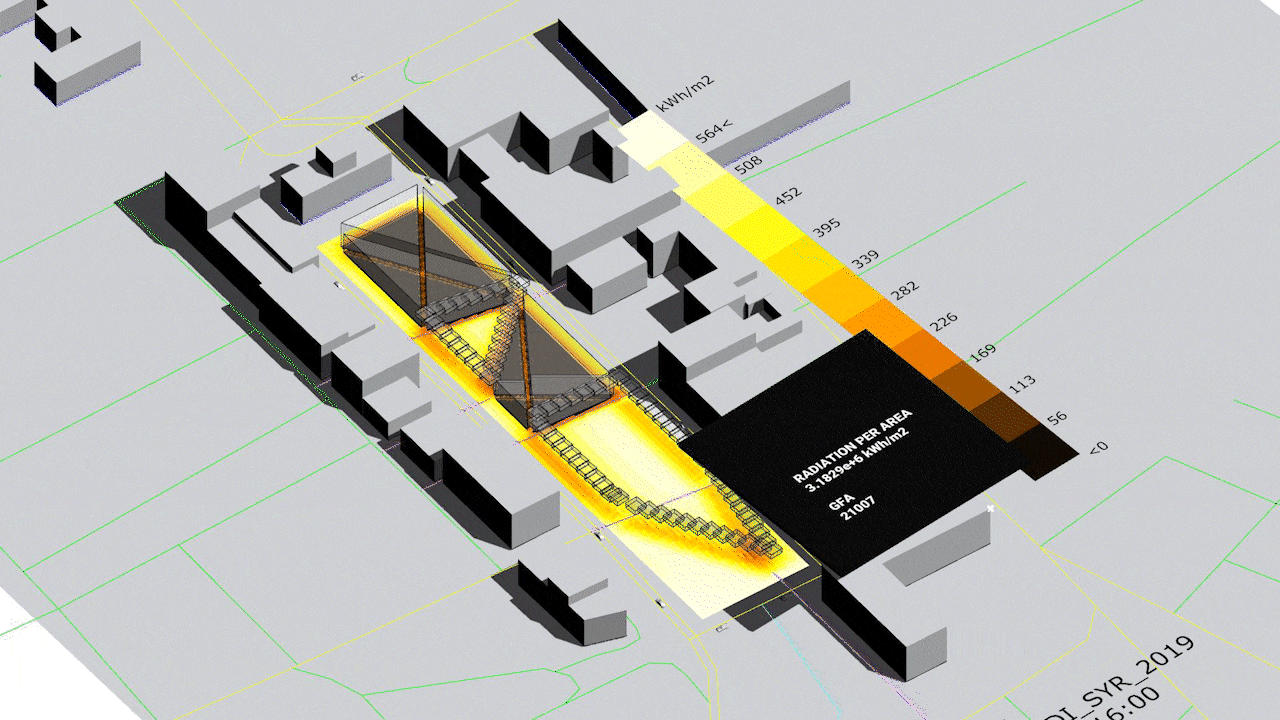
RADIATION ANALISYS
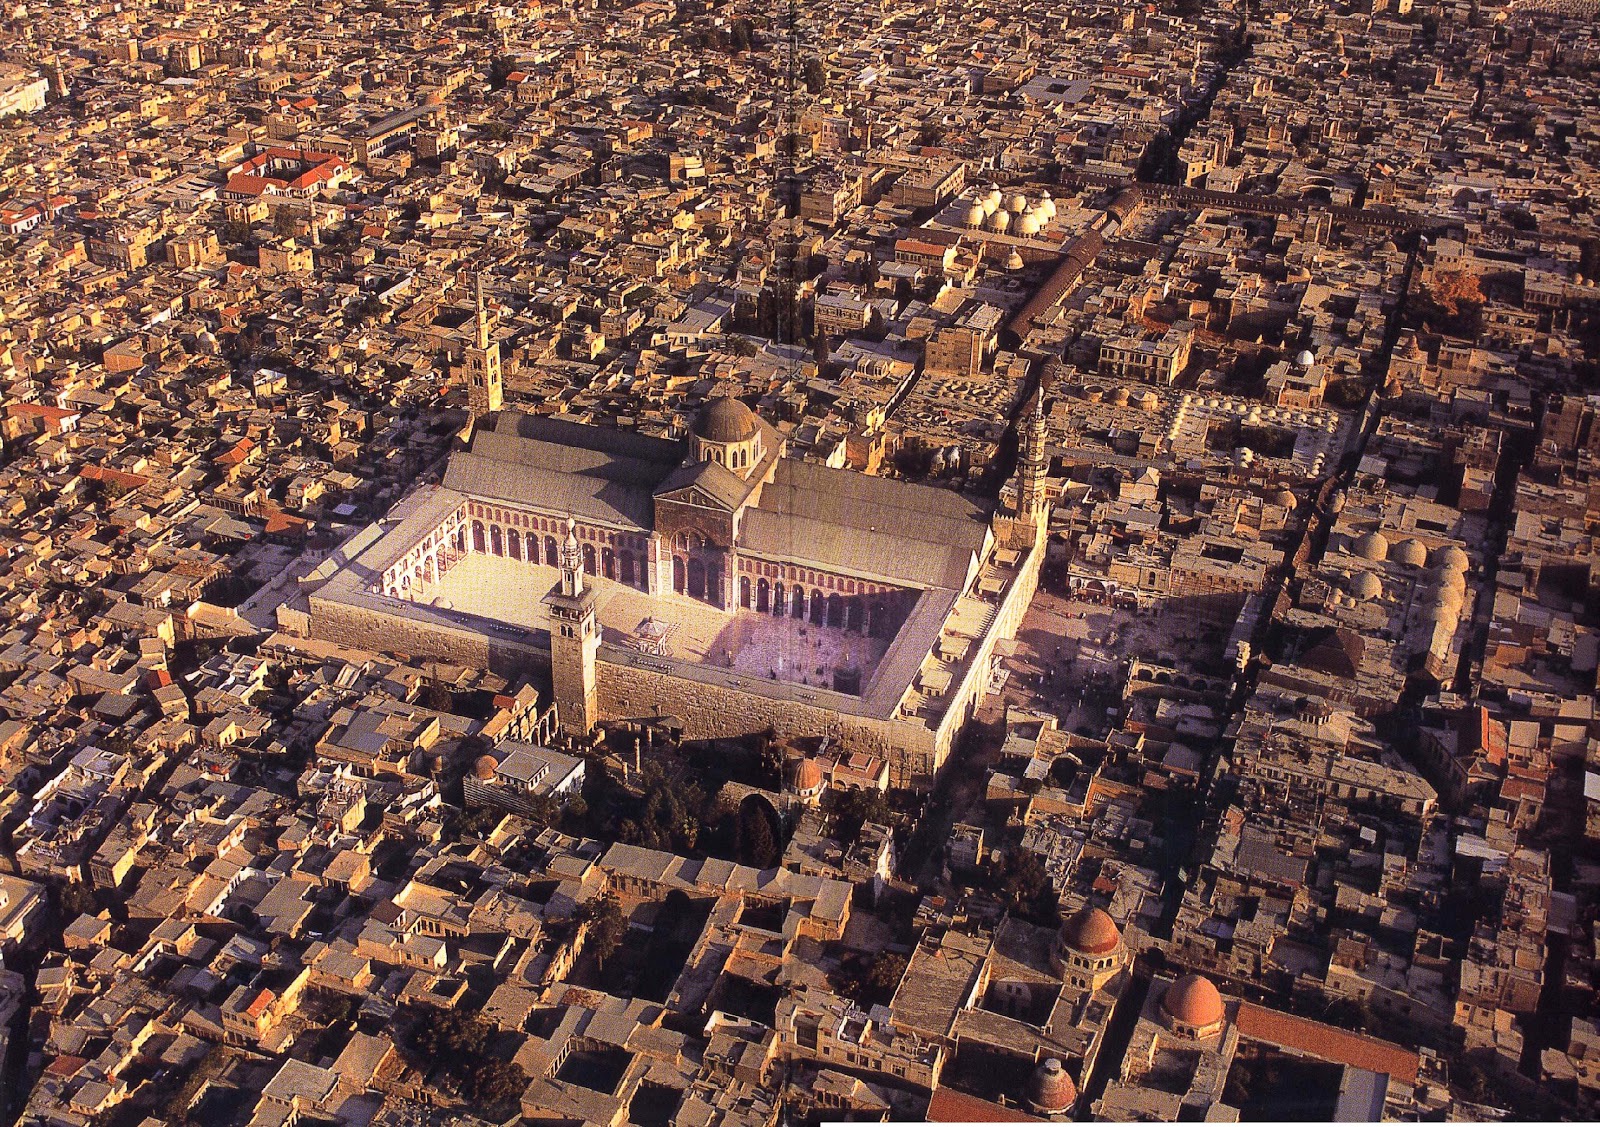
The project is located between the new neighborhoods and the old city of Damascus.
In this 14 000m2 empty square the plots are divided manually trying to connect new paths between the two sites. The optimization setup took as variables n-empty plots and two type of tree covering for squares while minimizing floor radiation.
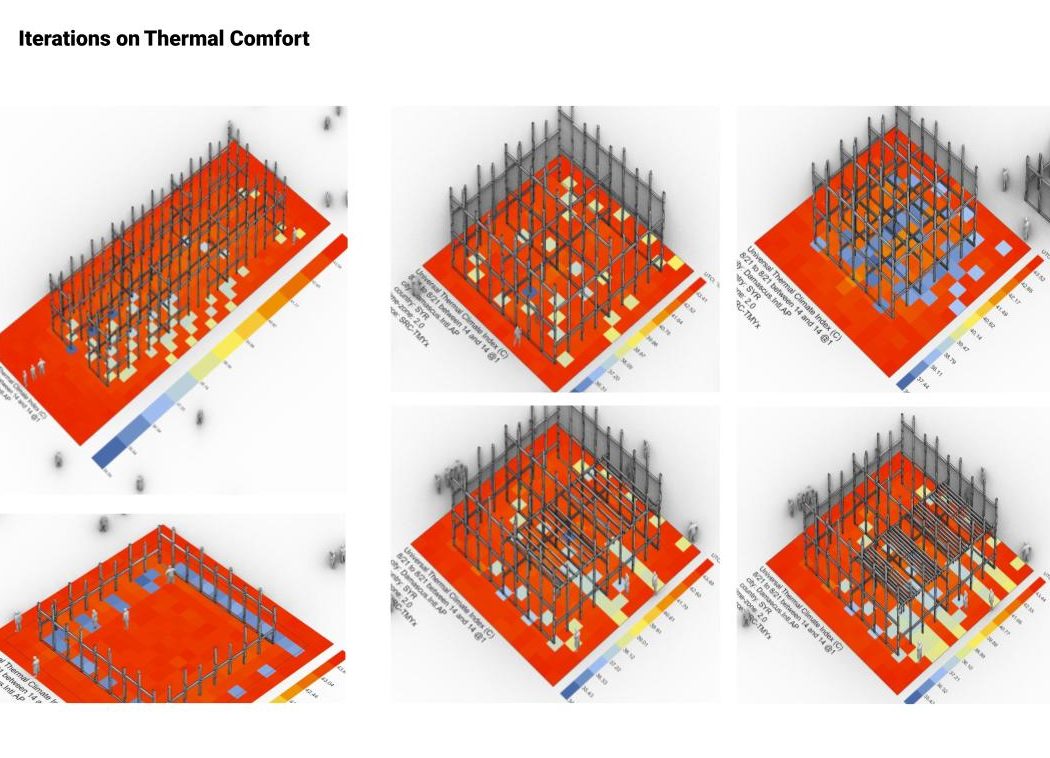
UTCi COMFORT

DAYLIGHT FACTOR
In this case, daylight was tested to optimize three facade options from my workplace. First, the facade was parametrized to a pattern of balconies and windows, an the for simulation purposes, each block was represented by a set of two consecutive floors.
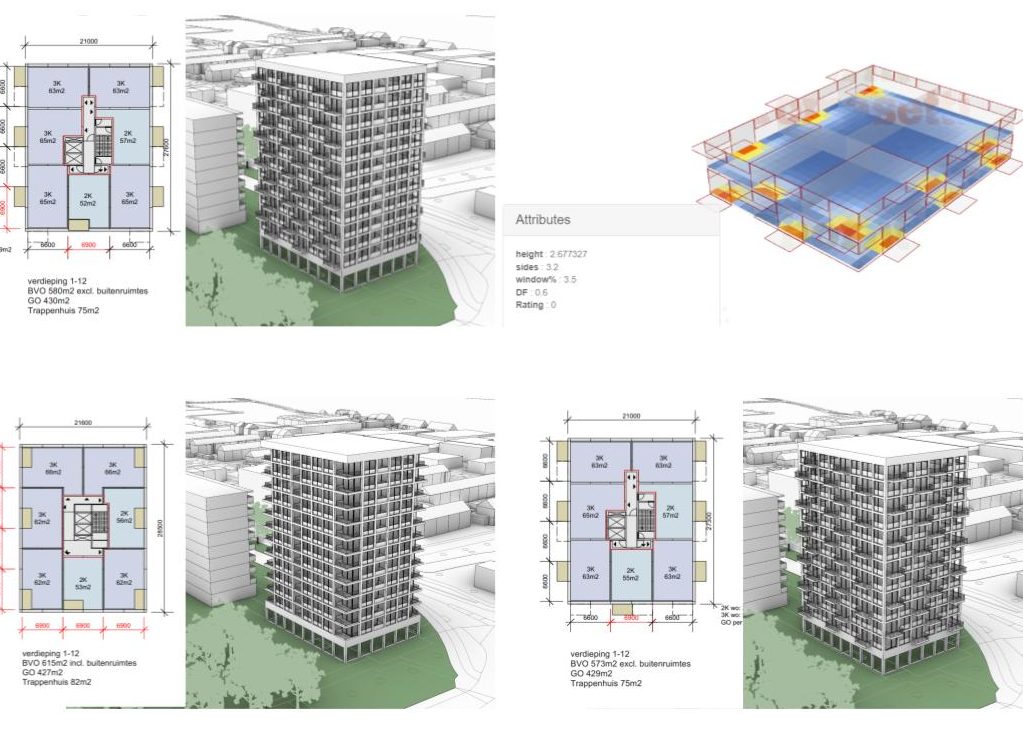

INPUT: parapets heights, balconies disposition and percentage of windows.
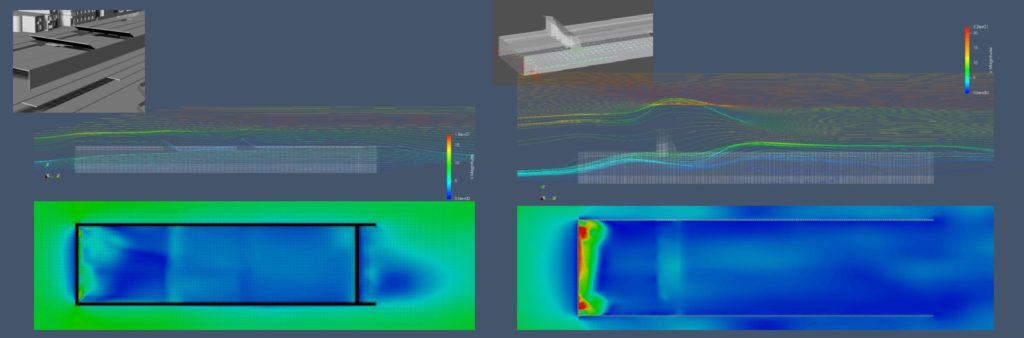
CFD SIMs
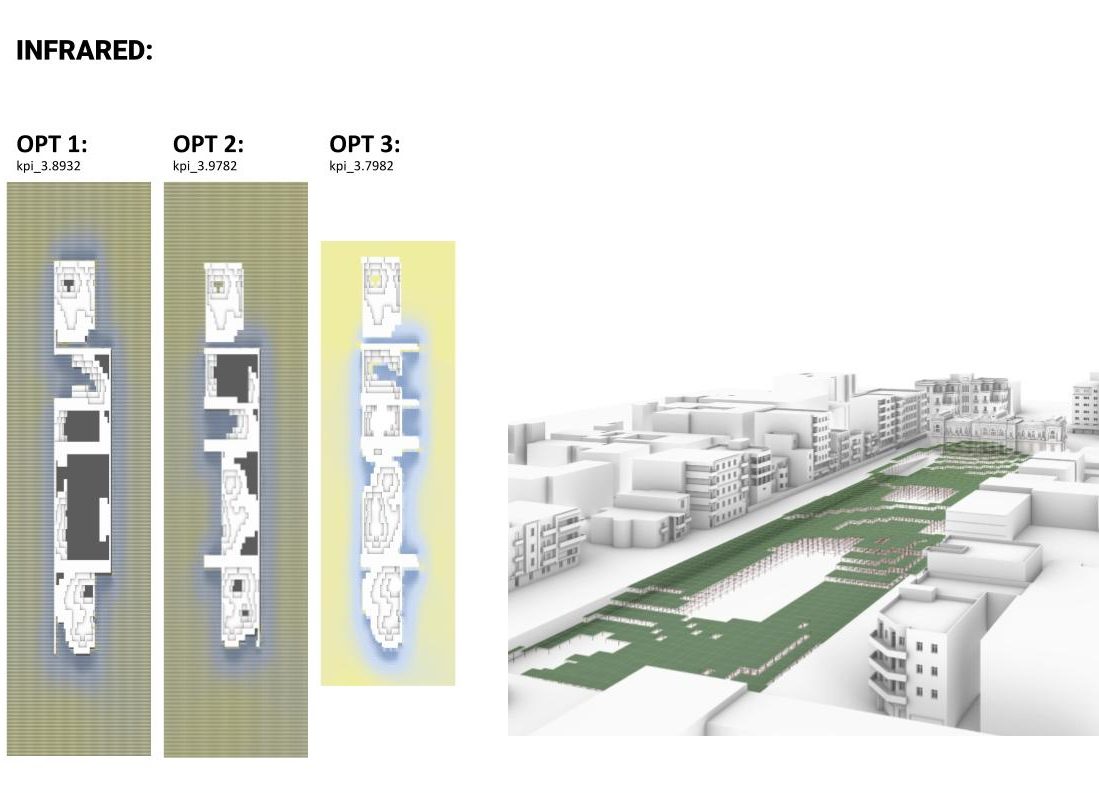
The new proposal for the square is completely exposed to the sun of Damascus, which makes essential the implementation of cooling strategies from the wind. For that, the optimal courtyard conditions was ensured using Infrared software, while the openings design was approached with Butterfly for a finer detail.
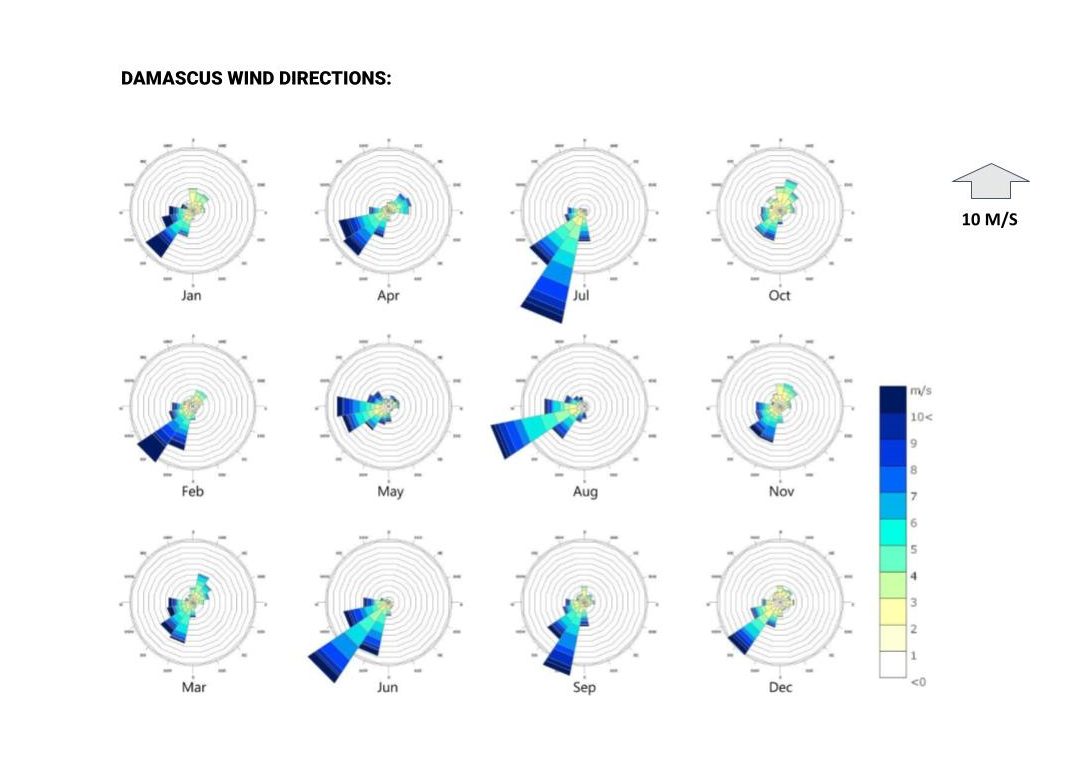
Syrian wind tower implementation: