
“Floor Zero” is a new methodology for evaluating and optimizing retail property investments. Instead of simply comparing one property’s data to another’s, it looks at how each factor influences overall value for different property types based on the price tag people put on those factor. A concept inspired by the Moneyball approach, where a team instead of comparing players to buy—it compared the runs they produced, which is what actually wins the game. In this project´s case. Parameters are the data itself and runs are the value that people gives. By gathering information from diverse sources—like socioeconomic metrics, street-level imagery, and property listings—the project uses machine learning to capture the importance of each parameter. It then provides actionable insights: from pinpointing undervalued spaces and suggesting ideal usages, to generating visual previews that showcase potential improvements. Ultimately, “Floor Zero” aims to give investors, planners, and municipalities a smarter, data-driven way to unlock the hidden worth in commercial real estate.


The central question of my research is: Should I invest in THIS retail property?

To answer this question, we need to consider factors such as fair pricing, rental yields, market demand, location analysis, and much more.

Typically, our process involves looking around the neighbourhood we want to invest in and asking around. We check portals like Idealista to compare similar spaces, visit agencies to learn critical information about the building (though not so much about the surrounding context), and maybe rely on some other scattered pieces of information.

My project addresses that “something else”.

In this presentation, I’ll first share some background research, then introduce my proposal and its methodology, and finally discuss next steps along with its limitations.

First of all, “Value.”
Value represents the economic worth derived from a product or service, determined by demand. In liberal economies, price is the biggest indicator of value, but real value can deviate from price based on buyers’ specific demands and preferences. Ultimately, the true value of a property for its optimal usage is just waiting to be discovered.

Which methods are used today for valuation?
- Market Approach – Basically comparing data of similar properties.
- Cost Approach – Determining value based on the costs of the investment.
- Income Capitalization Approach – Calculating price based on return on investment, which tracks how much money you make compared to what you invest.
This proposal focuses on introducing a new approach to market analysis.

To understand market dynamics, I’d like to share some real estate valuation graphics from different countries. The upper line in each graph represents residential real estate, and the lower line represents commercial.
Across all these graphs, while residential prices keep rising, commercial prices remain relatively stable. This indicates reduced demand and slower economic activity in the commercial sector. It also suggests that commercial real estate is somewhat more resilient to external factors such as economic reforms, politics, or legal changes. These stagnating trends mean commercial real estate valuations can provide more reliable results than residential, partly due to their relative independence from many variable factors

Here in Spain, we see a similar pattern to the other countries’ data.

We currently lack optimized decision-making tools, dynamic analyses, technological integration, and tailored data for the commercial real estate industry

That’s why I propose a platform that integrates the latest technology with dynamic datasets, providing tailored and optimized suggestions for investors, planners, and municipalities.

It will look like other real estate marketplaces but will highlight the most undervalued spaces along with each space’s suitability for different types of businesses.

I have five milestones in my project:
- Building a comprehensive dataset
- Mapping all relevant data
- Performing estimation and feature engineering using machine learning
- Generating scripts and keywords through Large Language Models (LLMs)
- Generating images

I use machine learning tools at each step, prioritizing automation. So when someone lists an advertisement on Idealista, the process I’m aiming for would be automated—even image generation.

Let me explain this approach with an analogy. It’s similar to what happens in Brad Pitt’s movie Moneyball. Traditionally, players were chosen based on whether they appeared to play well, had the right mentality, or could perform under pressure. Moneyball introduced a new method that didn’t just compare players—it compared the runs they produced, which is what actually wins the game.
In my scenario, the parameters that determine a property’s value are much broader than “goals,” and we don’t know how much each parameter affects different individuals’ demand. So instead of comparing only the spaces by their data, I compare the value people assign to these parameters. I identify all the elements that can affect value for each investor, even if their impact isn’t immediately obvious.
I obtain these importance values by training a model to estimate marketplace prices. Then I compare a property’s parameters to the model’s coefficients of importance, which represent the optimal ratio for each factor. This way, I achieve an automated and specialized analysis of commercial property demand.
Finally, based on what the property lacks, I provide LLM-generated suggestions and keywords to create a modified image of the exterior—showing how it should ideally look from the outside.

I started with dataset creation.

Here are my data sources

I divided my dataset into three areas of interest: Neighborhood Sections, Streets, and Coordinates.
Neighborhood Sections: Economic, demographic, and contextual indicators

Street Data

Point Data: Distances to key indicators (transportation, educational centers) and property data from Idealista.

All these data points are drawn from five districts of Barcelona, which is my study area. I’d like to illustrate how I created this dataset through my computer vision case, where I used it to cluster the features of streets where these properties are located.


I downloaded four images per location (with 90-degree headings) and merged them into panoramic views. Then I segmented them, took the average of two points in these streets, and reduced the probability of capturing anomalies like a truck blocking the camera.

After processing the results, I started my analysis. First, I identified features that showed no variation across images and removed them.

Next, I generated a Silhouette Score to determine which number of clusters provided the best separation while also comparing feature correlations.

After some back and forth, I decided on seven clusters. I analyzed their proportions and named them. That finalized one column out of the 85 in my dataset.

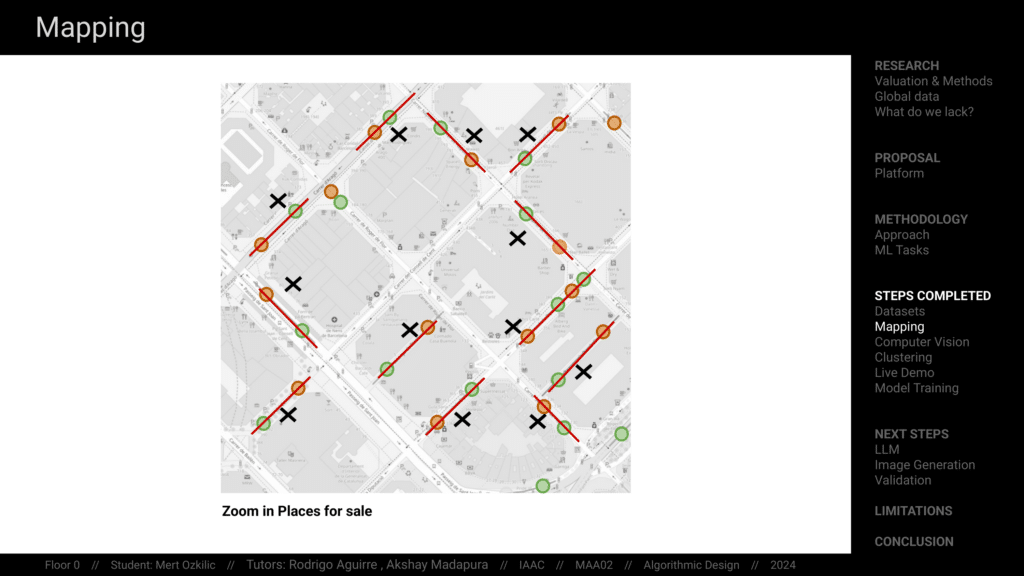
Then I mapped all other parameters that didn’t require such extensive preprocessing, integrated them, and created an interactive interface.

So, what am I working on right now?

For the machine learning algorithms, I started with direct Python implementations but found it challenging to fine-tune certain models. I switched to Altair’s RapidMiner software to train five different models. Theoretically, the most suitable for my task is Random Forest, which specializes in calculating feature importances. Currently, my relative error is around 30%. That result covers all five districts of Barcelona and all types of retail spaces. If I filter by district and property type, I expect the relative error to drop to 10–15%.

Here are my top 10 results in the Random Forest model. Different models give different results, but some parameters consistently appear at the top.

For example, the Gini Index—which measures inequality in income and consumption—often ranks high. I mapped and plotted it to investigate further and identified some outliers that need filtering.

I also checked the distributions of other parameters. In the population chart, a few outliers significantly affect the distribution, which I’ll need to filter out.

Next, I examined the correlation matrix. I noticed a strong correlation between Gini Index and Nationality Index, then plotted their data to understand how they relate to price. With this kind of investigations, I am aiming to filtering my dataset.

Now, I’ll move on to the LLM part.

This segment focuses only on restaurants.

At the end, I aim to generate modified images of restaurant façades.


To validate, I plan to compare existing restaurants (which have similar parameters to those on Idealista that are transferring their business in exchange for a certain amount) with the performance indexes of those current restaurants. That transfer price usually reflects their return on investment percentage, an indicator of performance. If I had access to income tax data for these spaces, this step would be much easier.


“Floor Zero” aims to redefine how retail properties are valued by providing actionable insights through advanced regression methods and machine learning. By addressing challenges like missing data, complex relationships, and varying property characteristics, I believe this project can bring clarity and optimization to retail real estate investment and urban planning.
