
Floor Plan Evaluator using graph machine learning
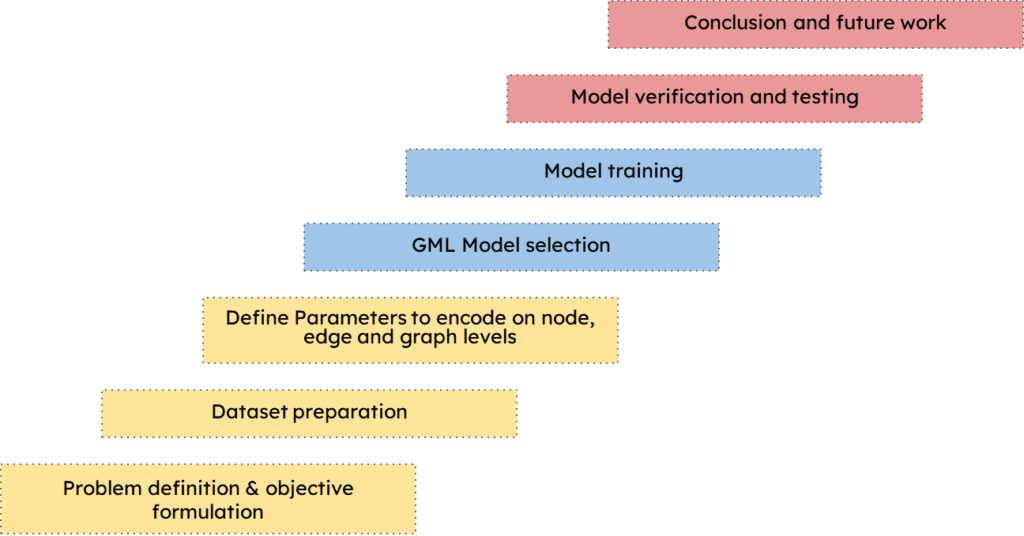
Project Workflow
Problem definition & objective formulation
With the growing pressure on cities available spaces for vertical or horizontal expansion, it’s crucial to make the most efficient use of the available spaces without compromising the space qualities.
Conventional work flow of floor plan design is rigid regarding evaluating the designed plans as most of times they are evaluated at the end of the design process.
It will be more interesting and time saving to get to evaluate the designs while designing the floor plans, to provide a continuous feedback loop that helps designers enhance and modify their designs.

Project Objectives
The objective of this project is to develop an AI model that can instantly show floor plan performance metrics “Efficiency and quality” during the design process to help the designer in tackling the design problem
Data set preparation
Generation

Using magnetizing rooms and topologic plugins we generated around 4000 floor plans with different number of rooms and a circulation area.
we ensured good variation within our dataset Through varying:
- rooms count
- corridor type “ one sided or Two sided “
- plot size
- Plot proportions
- entrance position


Parameters Encoding
To encode relevant parameters into our dataset some steps need to be done:
- Generate Random Floor plans
- Classify the spaces into Rooms / Corridor
- Classify space edges into “ To corridor , To Exterior & To neighbor”.
- Calculate each room space quality index = (1- to corridor %)+to exterior %
- Build a graph
Nodes = rooms centers
Edges = connections between nodes - Encode node data as:
Room type
Room Quality index
Room Area
Room perimeter - encode edge data as:
Edges Vertices
Edges Vertices to neighbor % average - Encode graph data as:
Plan Quality
Plan efficiency “Corridor% to plan area”
Floor plan Area


note: we decided to drop room area and room perimeter because they are already influencing room quality index and this will result in more generic model.
GML Model selection
In order to predict Graph classification based on quality and efficiency we decided Using Graph SAGE graph Classification model.
Data distribution check
After selecting the training model, it’s essential to check our data distribution first.
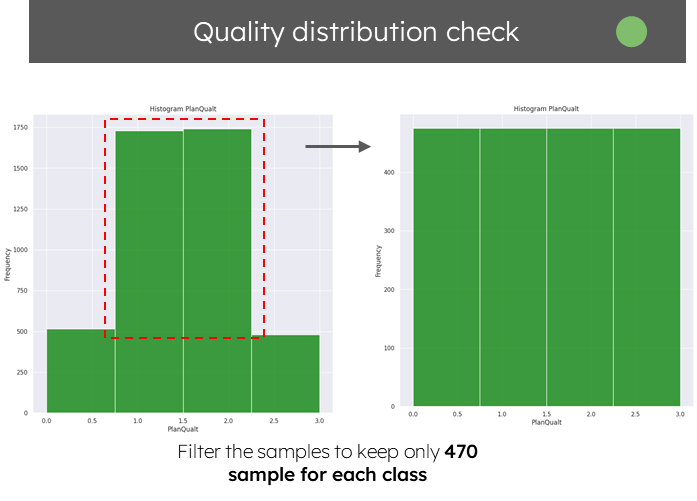
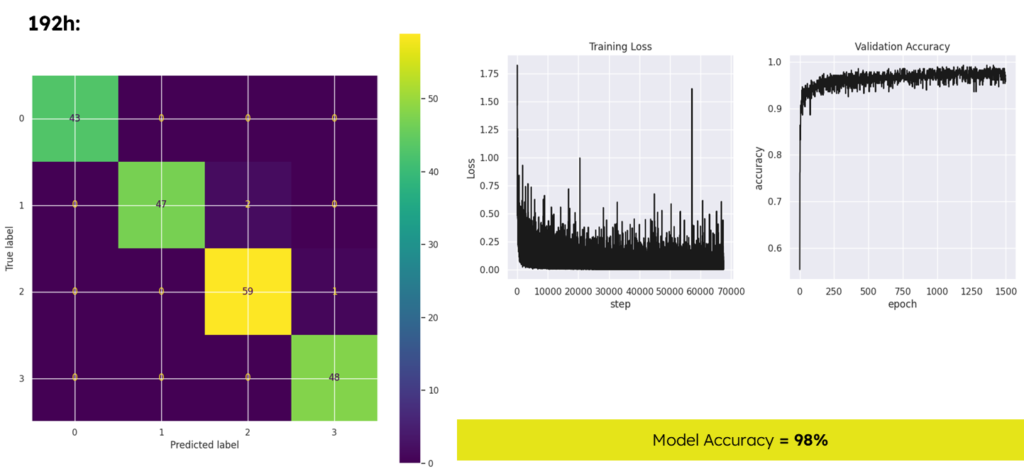
starting with quality measure, we observed some inconsistences due to the way the magnetizing floor plan plugin is working classes 0 and 3 were less presented in our dataset, to overcome this issue we filtered our samples to keep only 470 record per each class with total dataset size 1,880 samples, instead of using all of the 4000 generated samples.
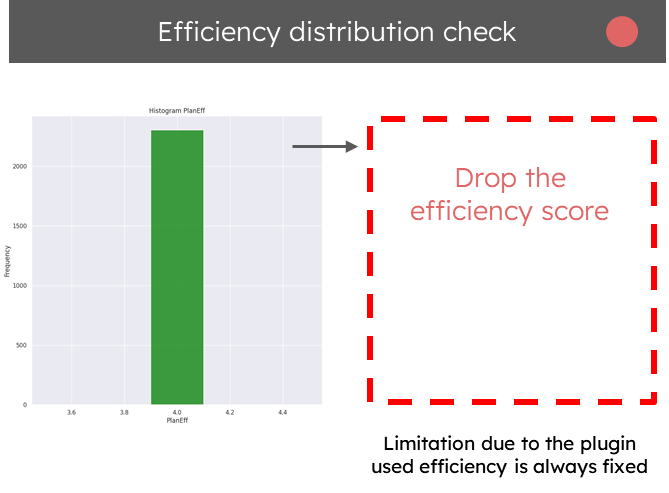
Moving to efficiency part only one class existed in our dataset again because of the way the plugin is working, no way to fix this using the same workflow so we decided to drop the efficiency part for now.
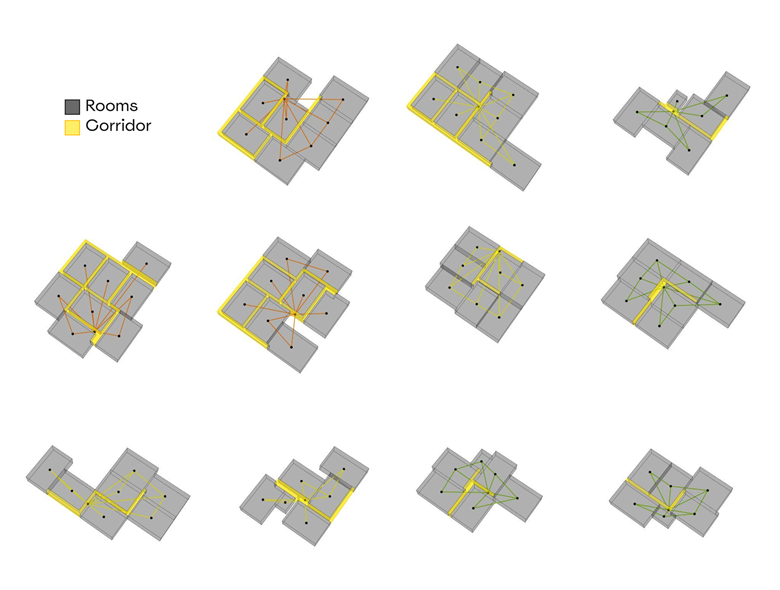
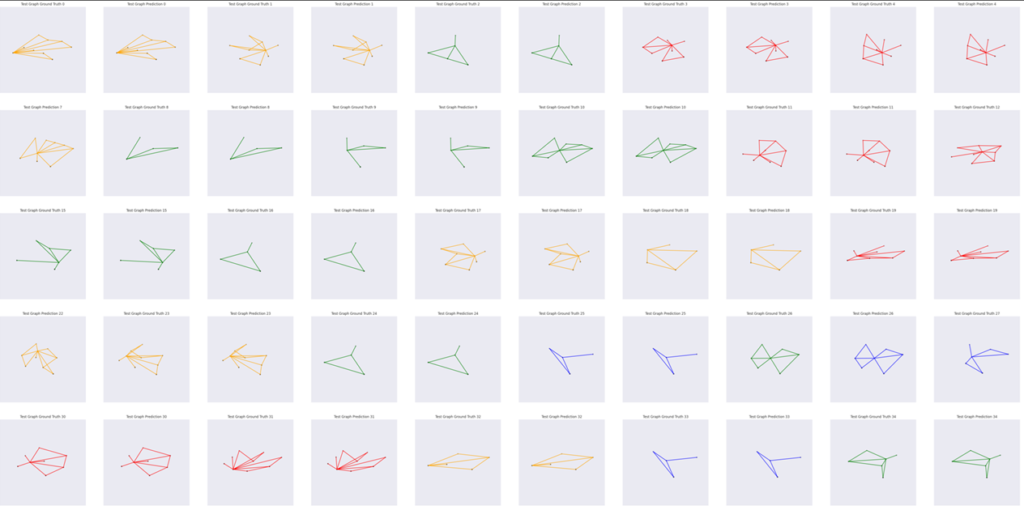
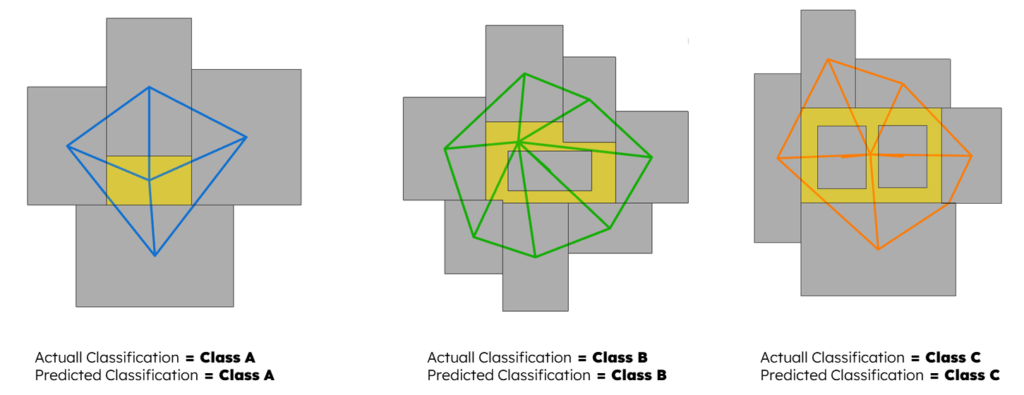
Here you can see samples of the final dataset graphs classified by quality.
Model Training
We started the training process slightly by modifying the hyperparameters “specially number of hidden layers” to get more accurate results.
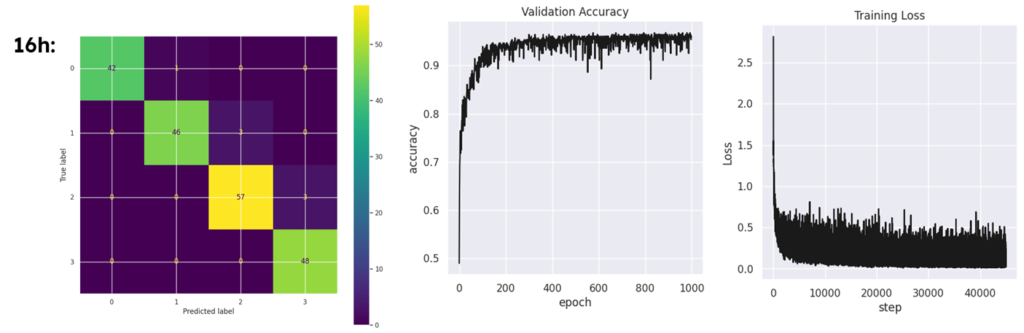
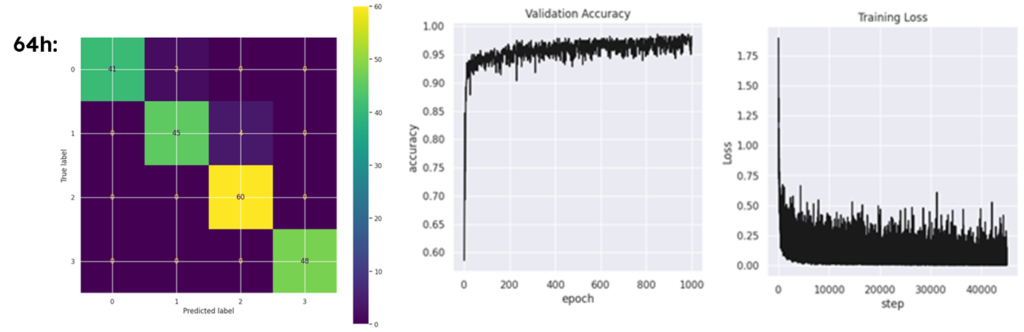
Until we reached an acceptable score with an accuracy level of 98%, Using the testing dataset, the model manages to make 197 true predictions out of 200 samples, a very good score.

Model Verification and testing
To verify the trained model we used hops to predict the quality results inside grasshopper, the model performed perfectly on plans within the training domain.
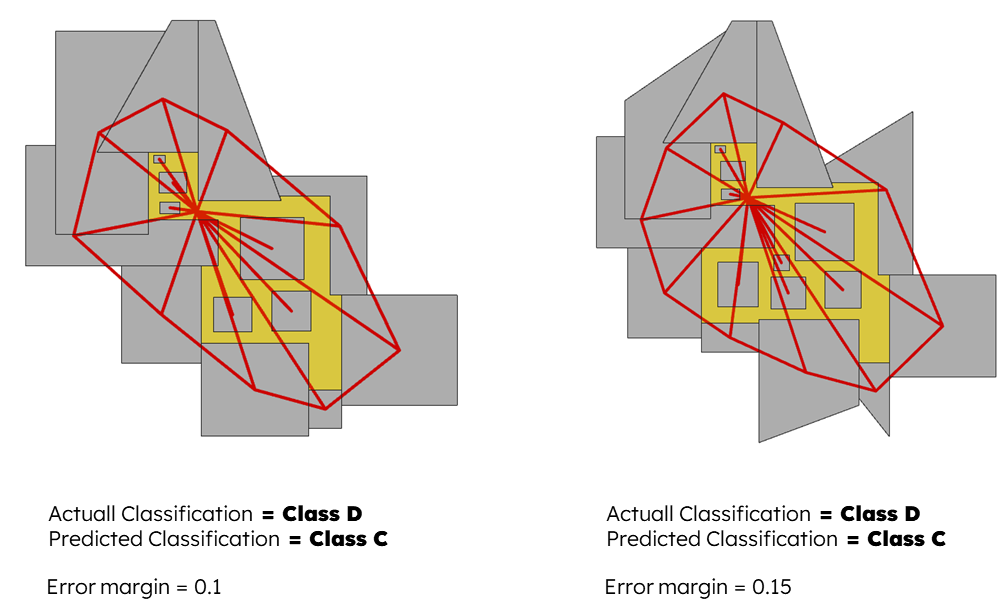
To higher the level up we started testing the model on unseen data using irregular geometries and increasing the rooms count.
Again, the model showed remarkable performance but later we started seeing some errors in the predictions one class up or one class down, this usually happens when the actual score is very near to the next class threshold.


Conclusion and Future work
Conclusion
The model performed in a very good way regarding predicting plans quality within training domain, also it’s performance was good for predicting unseen out of training domain data with a minor margin of error ( only one class up or down in some plans ), overall graph SAGE classification showed a very good potential for our particular problem with acceptable ability to generalize.
Future work
Our current research is based on 2D plan exploration. In the future, we hope to use similar methods to train prediction models suitable for 3D building layout quality.
Moreover the plugin we used to generate the dataset is limiting our possibilities to only train for quality maybe we can use another approach in plan generation to include more measures like efficiency.
