Governmental and NGO databases have played a key role in shaping our research, providing access to existing data and enabling us to connect it with other spatial platforms. Building on these foundations, our work expands the scope of vulnerability analysis by using satellite imagery to detect emerging informal settlements, while layering in additional environmental and political risk factors—such as no-build zones and proximity to industrial areas. Importantly, we focus not only on extreme events but also on the everyday conditions that affect residents’ safety and quality of life. These three angles—political, environmental, and livability—form the structure of our analysis. Lack of recognition in any of these categories often forces communities to remain in hazardous or unstable areas. By contrast, recognized settlements are more likely to be relocated out of danger zones or granted access to basic services. This led us to the central question guiding our project: How can satellite imagery analysis spatialize the political, environmental, and livability risks of informal settlements to inform and empower vulnerable communities in Chile?
Chilean Context
Recent Growth Drivers
Rapid Urbanization
Urban growth has outpaced planning in many cities, especially Santiago.
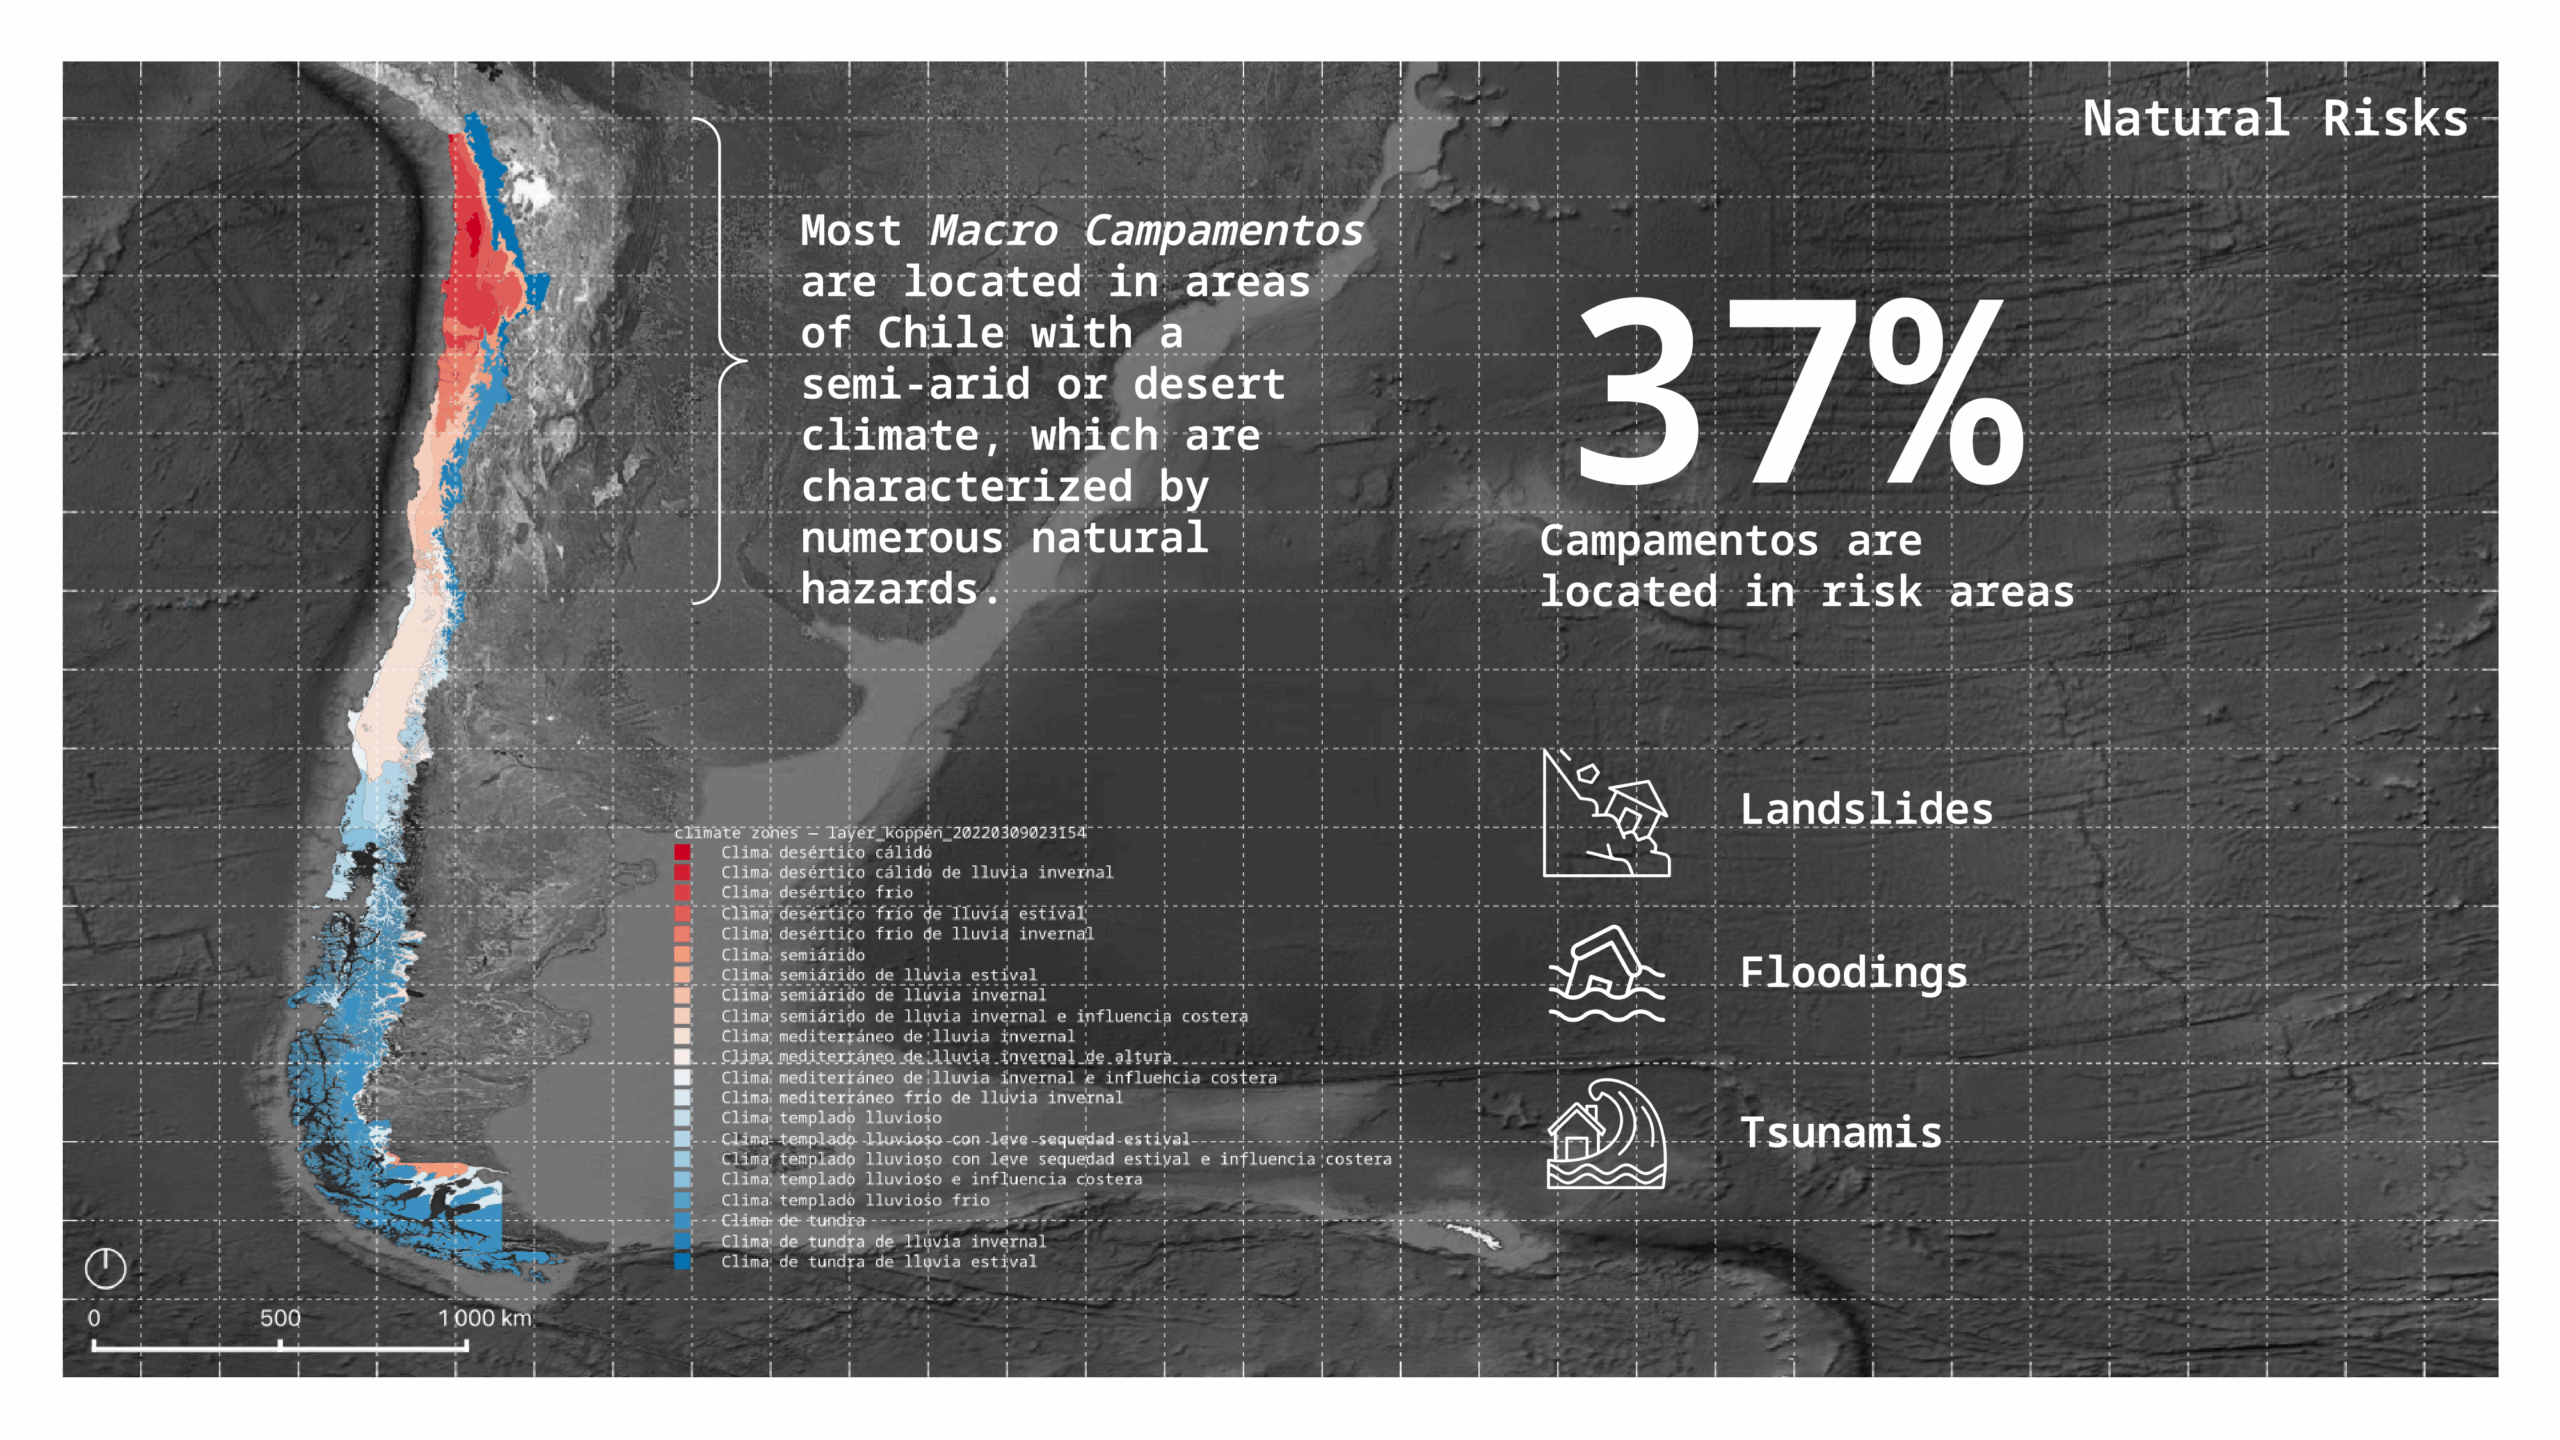
Natural Disasters
Frequent disasters have displaced vulnerable communities, many turn to informal settlements for shelter.
Pandemics
The economic impact of COVID-19 led to widespread job loss and housing insecurity.
Migration
Both internal and international migration increased urban population pressure, with many migrants lacking access to formal housing.
Settlement Types
Tomas
- Built on seized land
- No legal ownership
- 2023 Usurpation Law criminalizes residency with risk of eviction or prison
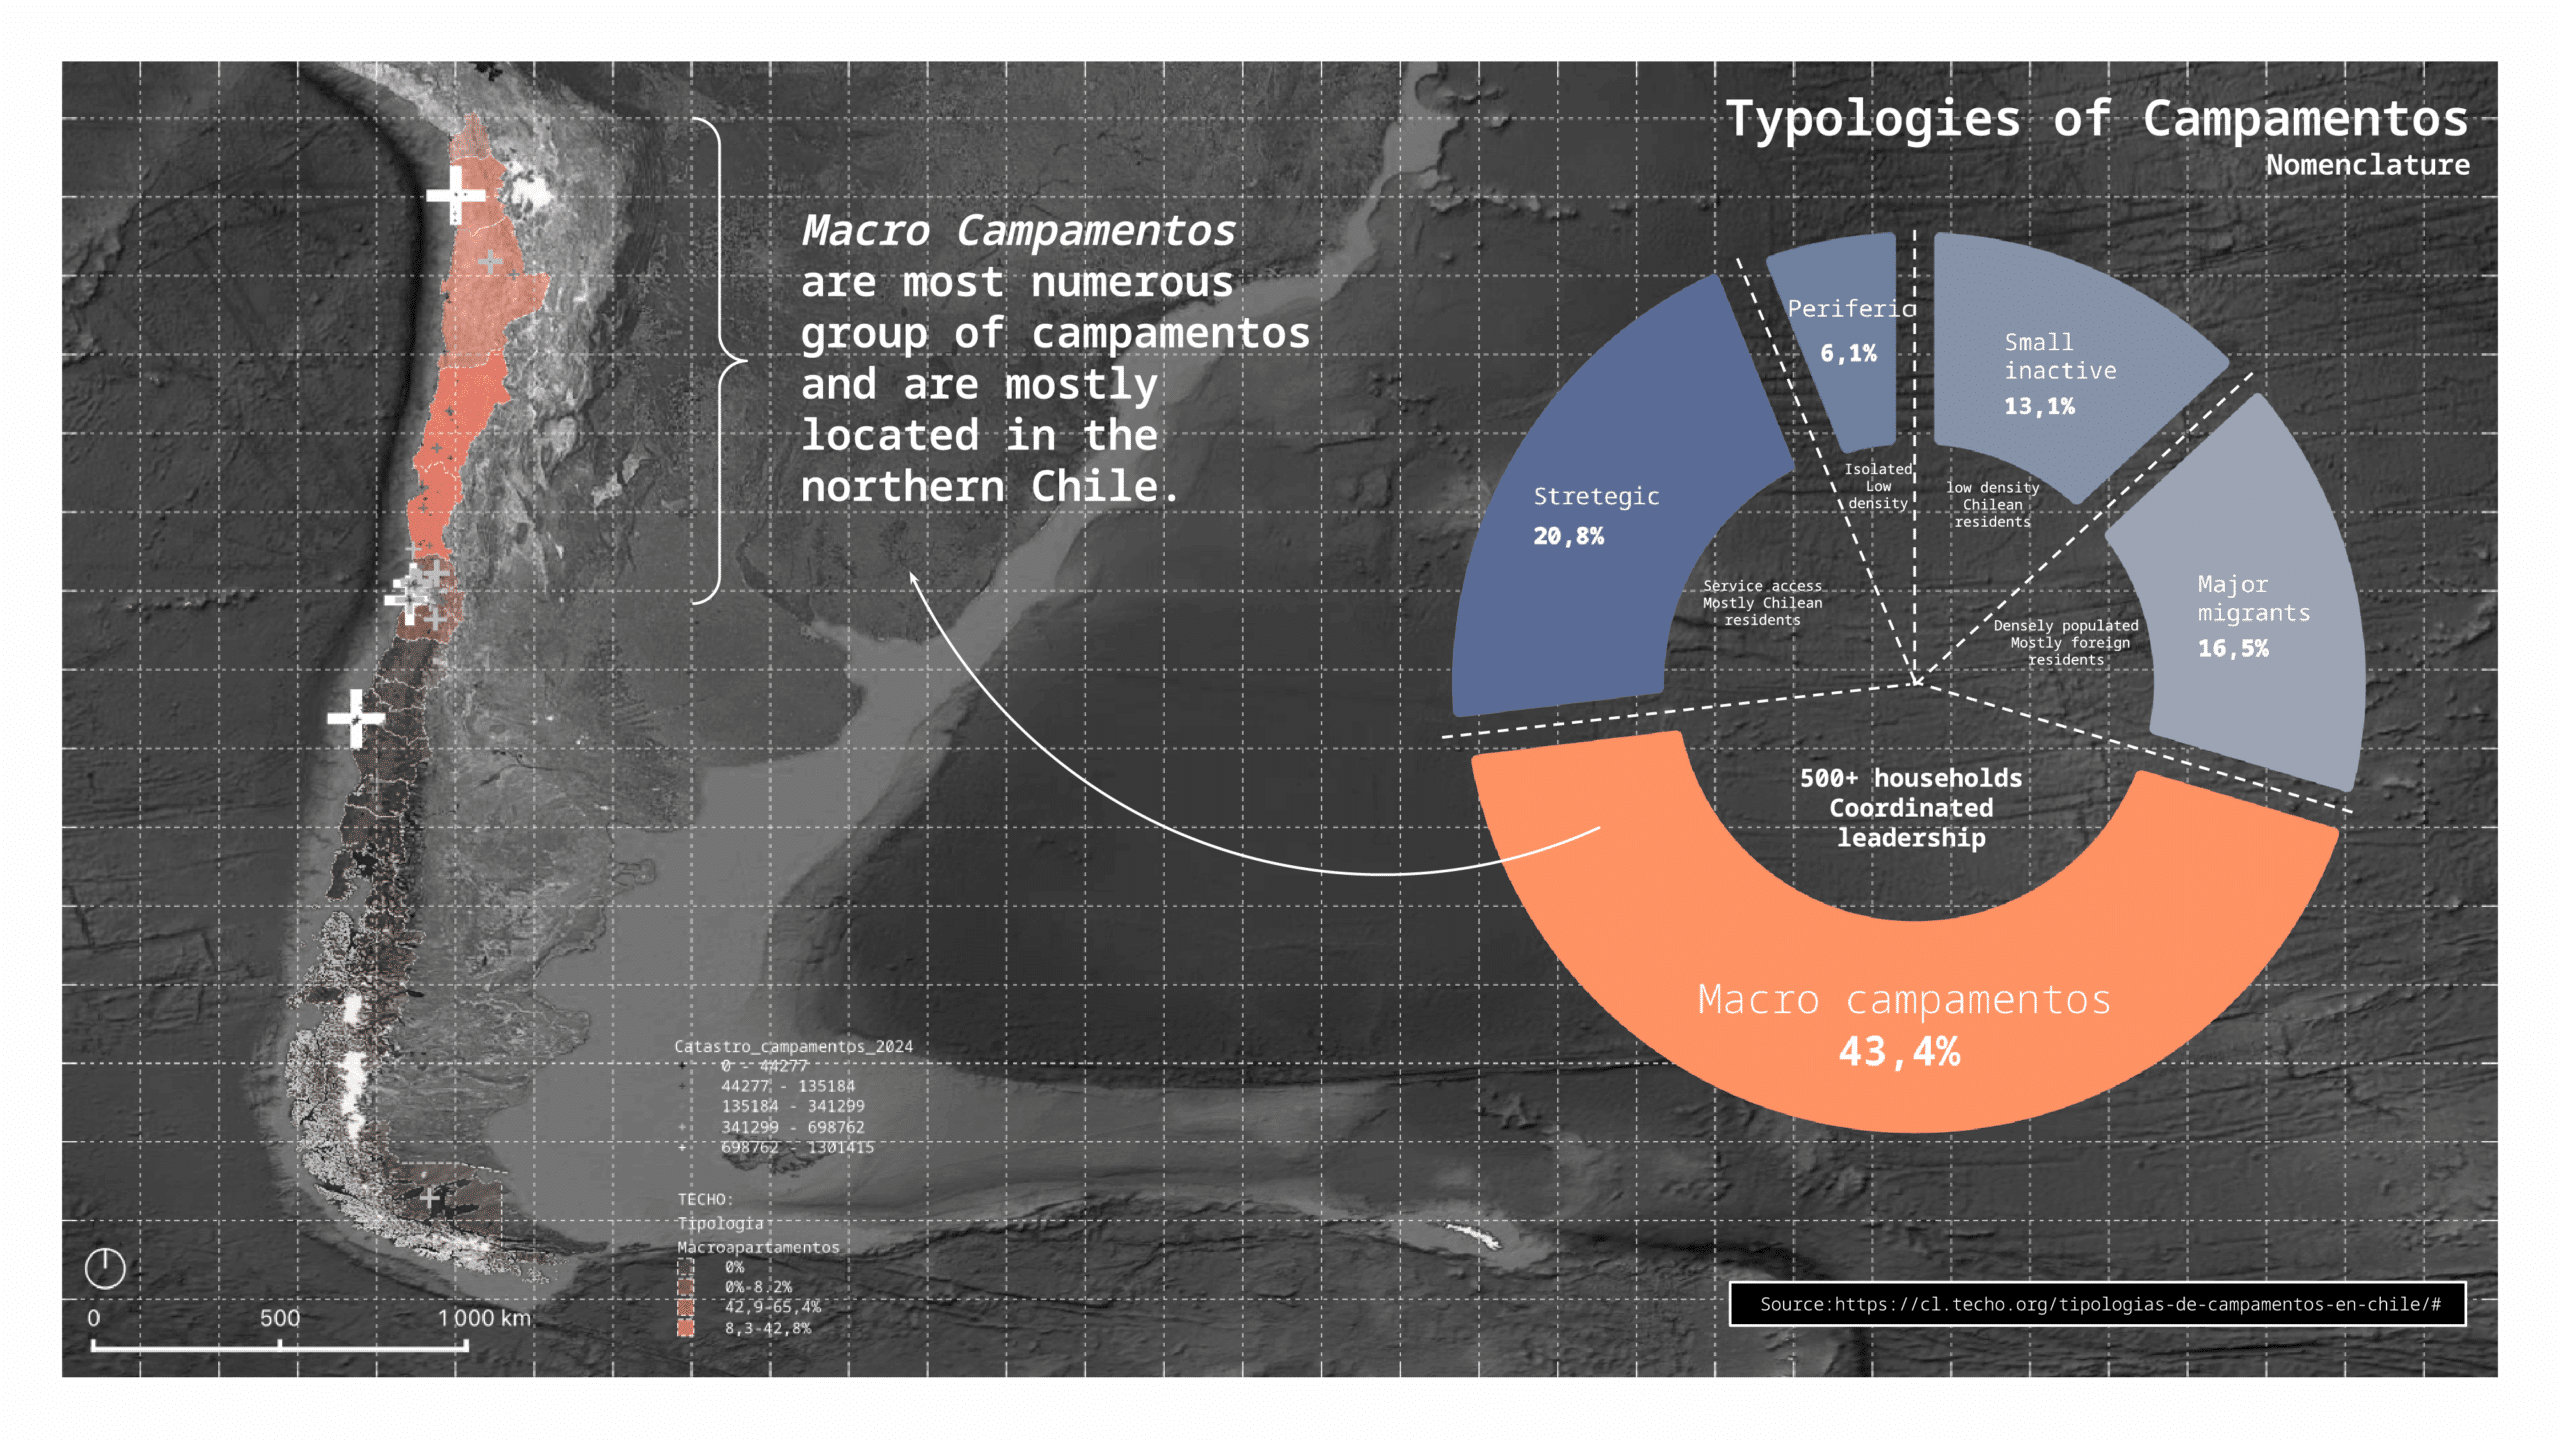
Campamentos
- Officially registered by Ministry of Housing
- Residents eligible for state housing if evicted
Analysis

Administrative
For the administrative dimension of our analysis, we focused on three main factors: the detection of unregistered settlements (tomas), the position of those settlements in relation to official urban limits, and whether they fall within designated no-build zones.
First, we used high-resolution satellite imagery from Google Earth. We annotated this data and trained a model using Roboflow to identify possible informal settlements—or tomas. We then validated these detections using QGIS, comparing them against the official campamento registry from Techo Chile, a housing advocacy NGO.
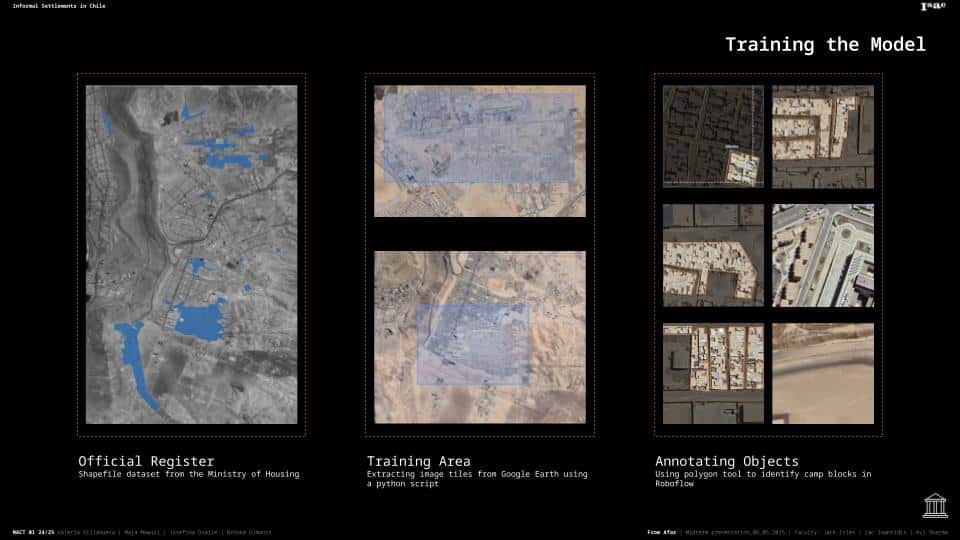
We began by testing to see if we could identify camps from the formal city using an object detection model. By inputting satellite imagery and known camps, we can test the model on different cities in the arid Chilean north.
We tested various different parameters, originally optimizing for the percentage of detected objects within registered camps and coverage of registered camps by our detected objects. We also tested with various models, ultimately using a model with 674 images.

We also tested in other northern cities, like Arica. Here, we detected many camps that were outside the official register, which raised again the politics of registering informal settlements, and the different levels of informality in which these camps exist.
Since this test has been taken in a different region, it helped us verify the correctness of the trained model.
SETTLEMENT TYPOLOGY
URBAN LIMITS
Next, we evaluated whether these settlements were located outside of legal urban boundaries. We used urban limit data from Chile’s national geoportal—Geoportal MINVU—and cross-referenced that with both the Techo registry and our detected tomas. This helped us understand where communities were growing without formal recognition.
ZONING PLAN: NO BUILD AREAS
Finally, we analyzed zoning restrictions by looking at Alto Hospicio’s municipal zoning plans and risk area designations from PRC and PRI planning documents. Again, we used QGIS to identify any overlaps between these no-build zones and the settlements we had detected.
ADMINISTRATIVE VULNERABILITY
Altogether, this process allowed us to flag settlements that are both unrecognized by the state and located in areas that are officially deemed unsuitable or unsafe for habitation—highlighting key vulnerabilities in the political and regulatory landscape.
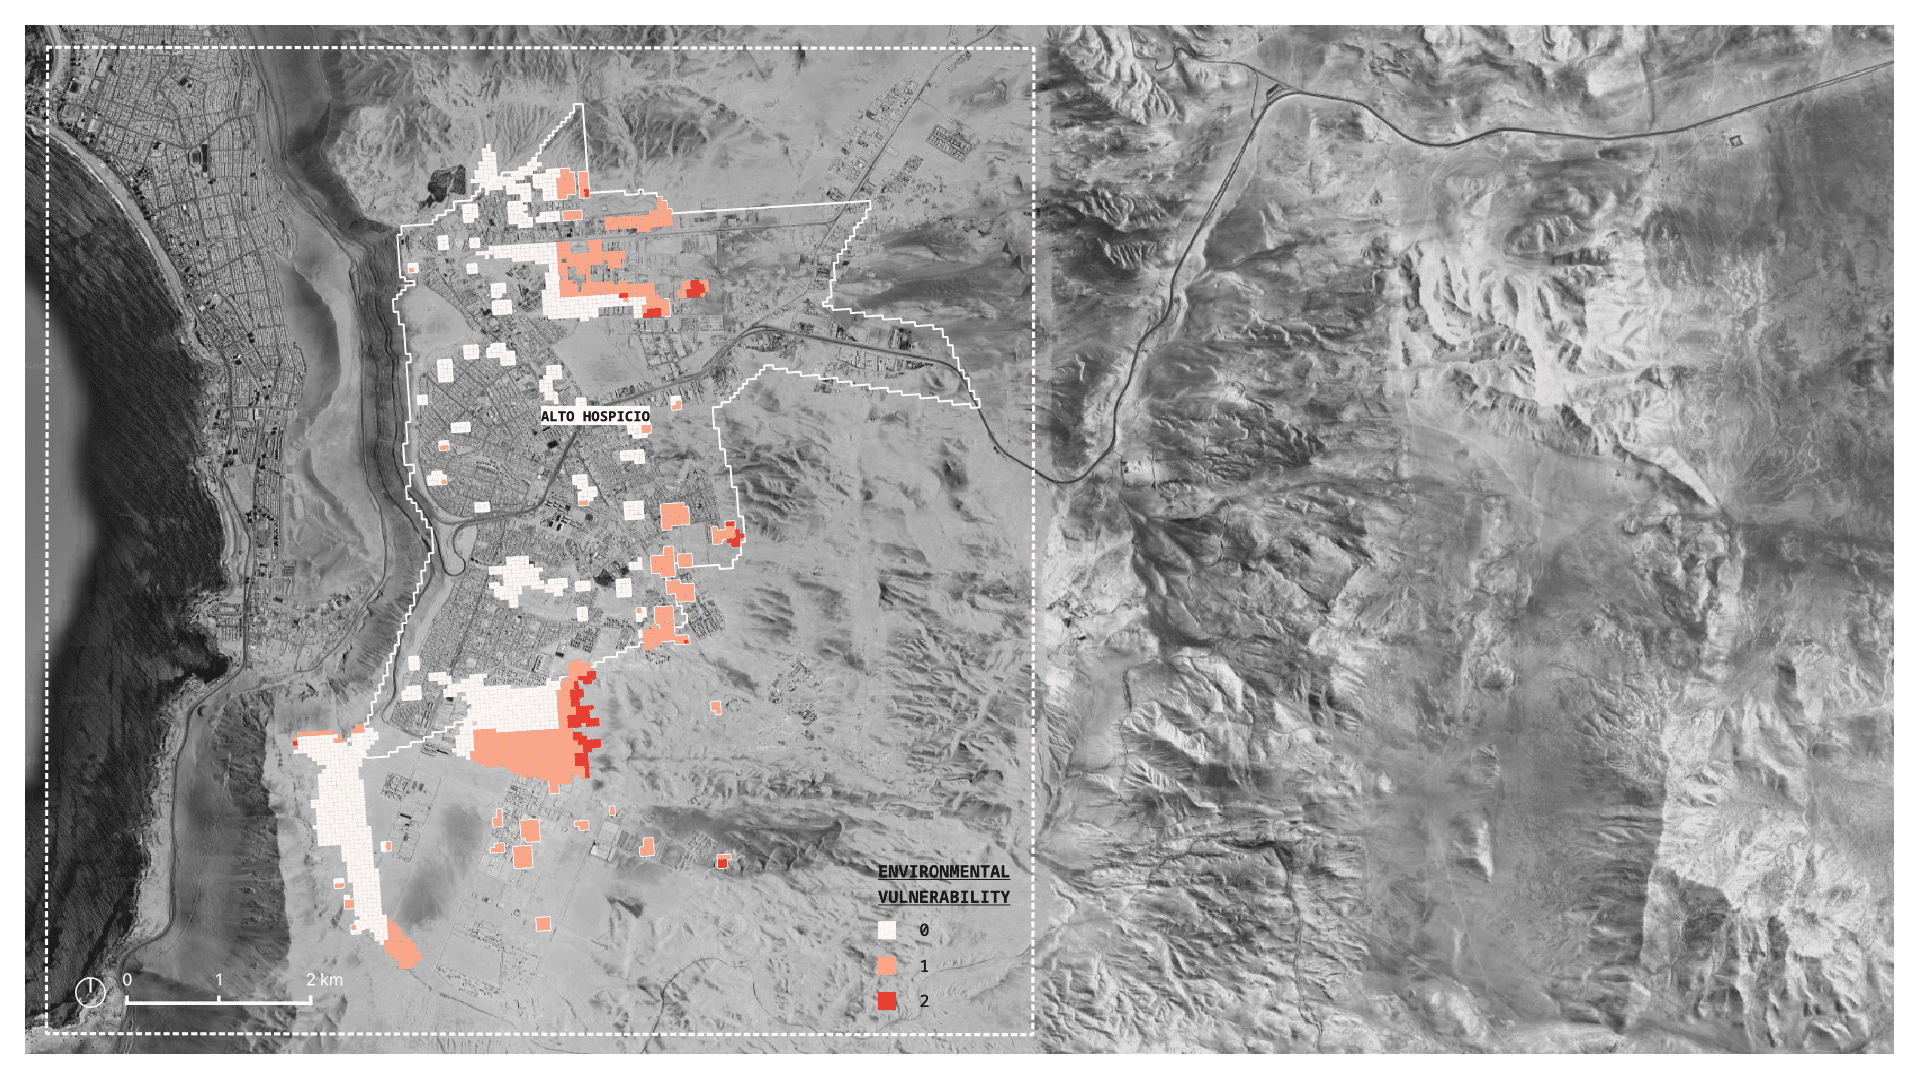
Environmental
Many of these same settlements are also exposed to harsh environmental conditions. Our next layer of analysis focuses on environmental risks: slope and temperature—two critical factors that directly shape the safety and habitability of these communities.
SLOPE ANALYSIS
Our slope analysis used DEM data sourced from SRTM Downloader and OpenTopography to classify in QGIS steep or unstable terrain, particularly that which is prone to landslides.
Infrastructure instability. Several informal settlements are built near or on steep inclines (>25%). These areas are more prone to soil erosion, water damage, and structural risk. It is not only location on the steep inclines is dangerous, but also vicinity to such slopes highly exacerbates the risk—especially when structurally the buildings are not following building codes and regulations and exponentially threaten the stability of soil.
TEMPERATURE ANALYSIS
Our heat index takes temperature data from the Google Earth Engine Heat Index. We evaluated and categorized this in QGIS to identify areas of extreme thermal stress.
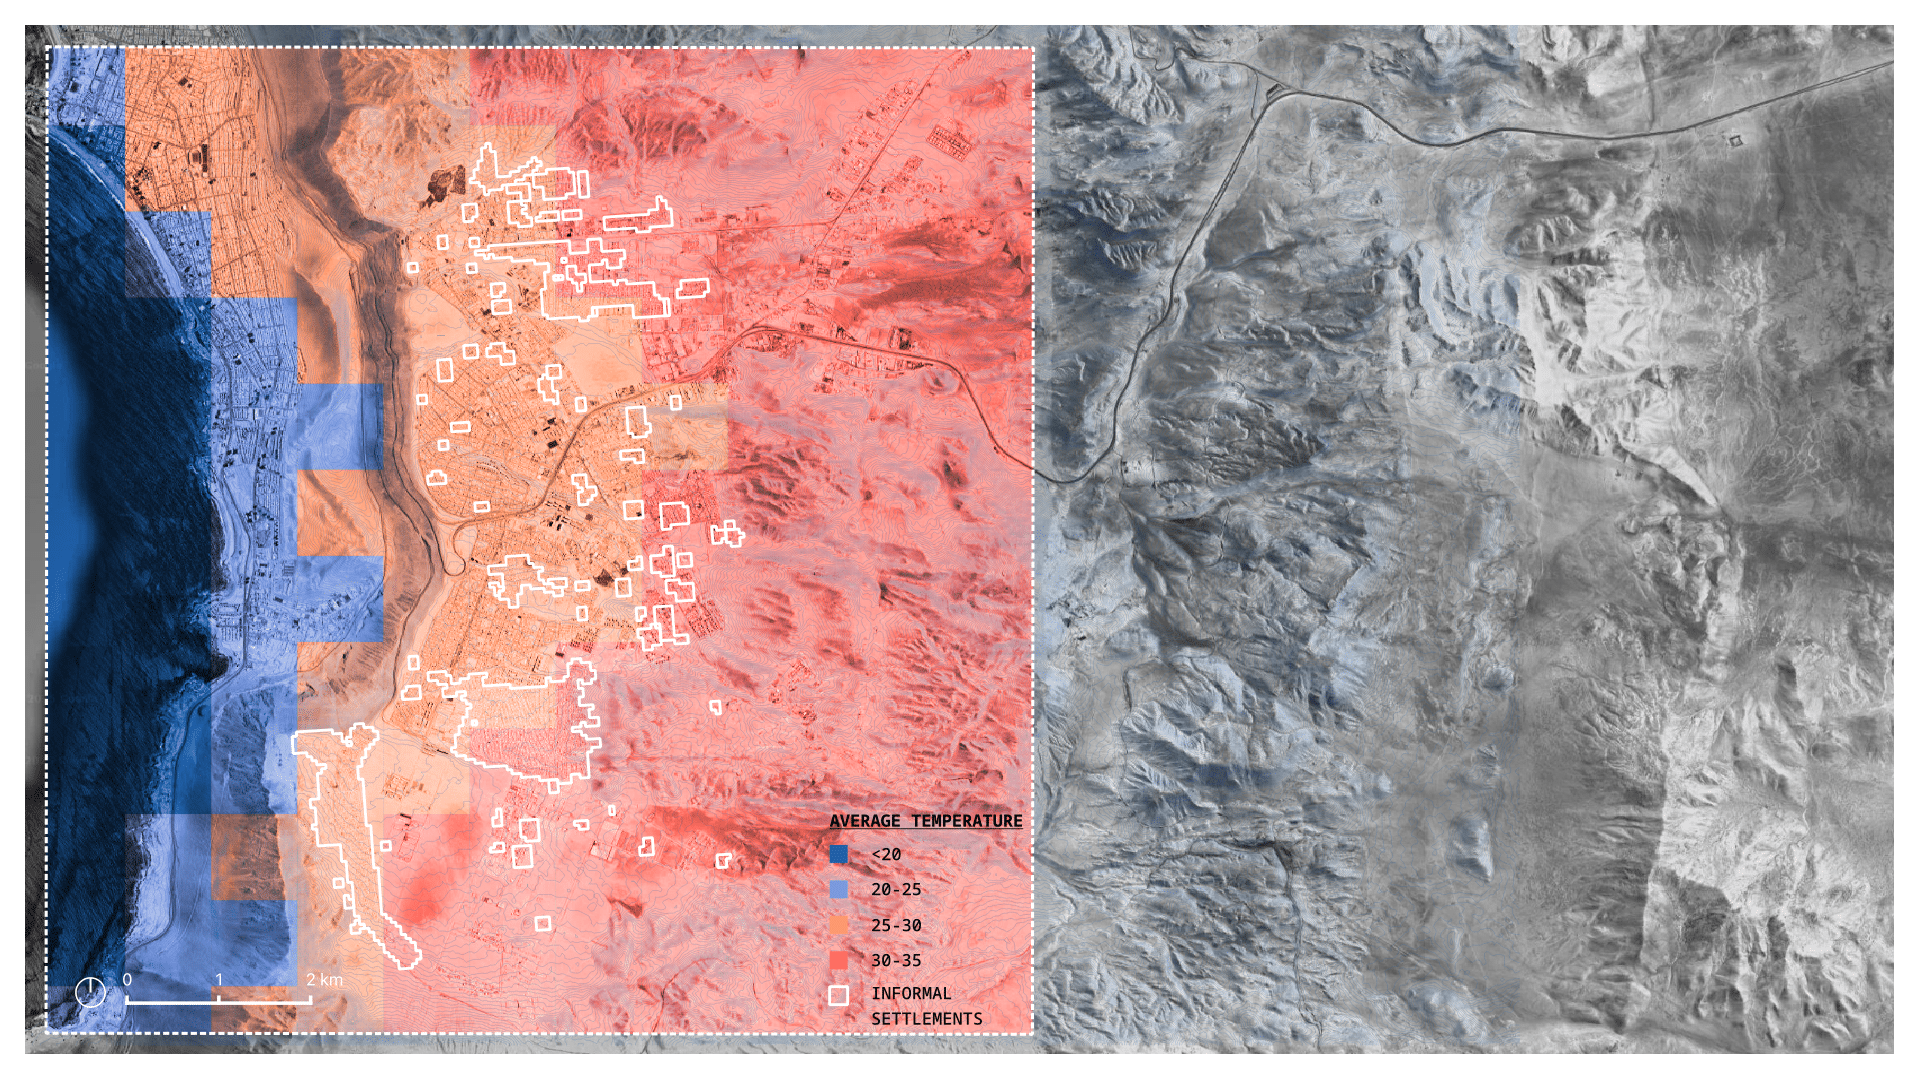
ENVIRONMENTAL VULNERABILITY
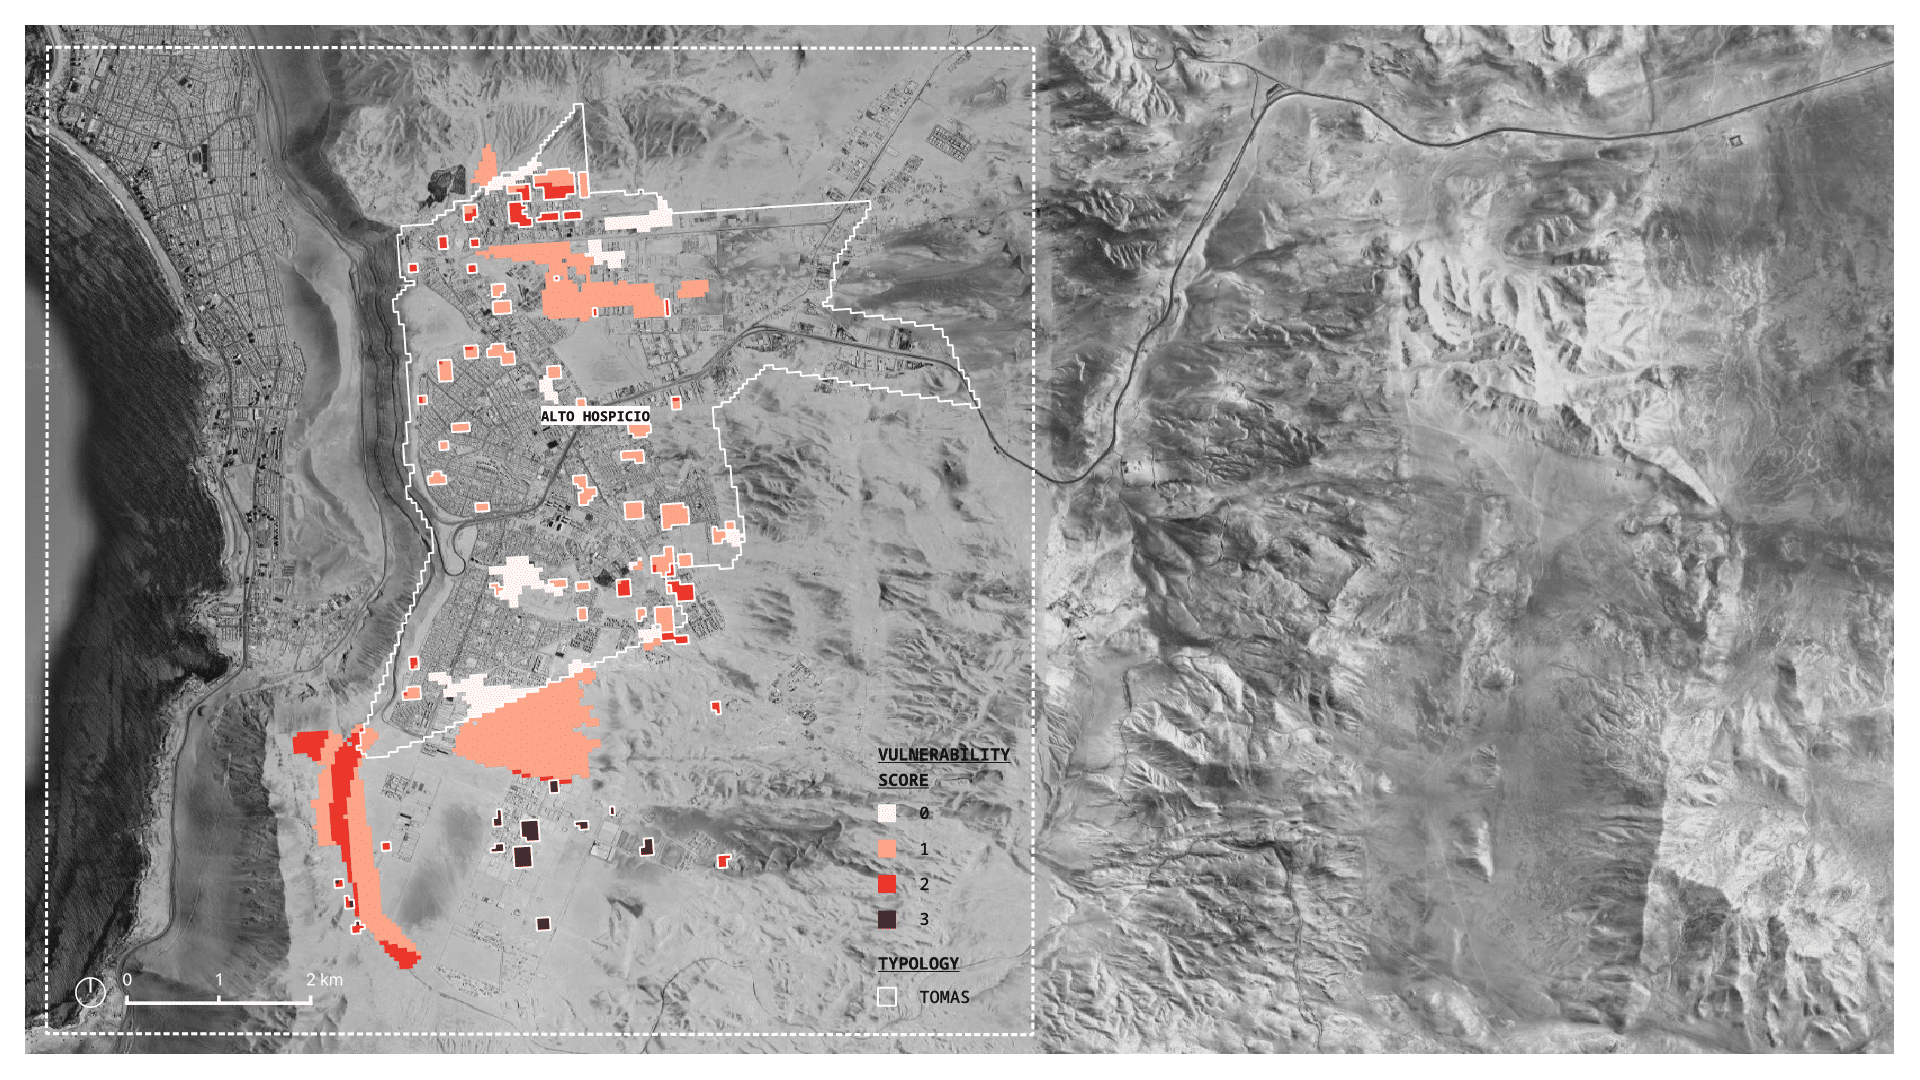
Livability
After mapping the environmental risks that threaten daily life, we turned our focus to livability—the day-to-day realities that define how communities access essential services and navigate space. Administrative and environmental risks may define where people can or cannot live—but livability risks shape how people actually experience that space.
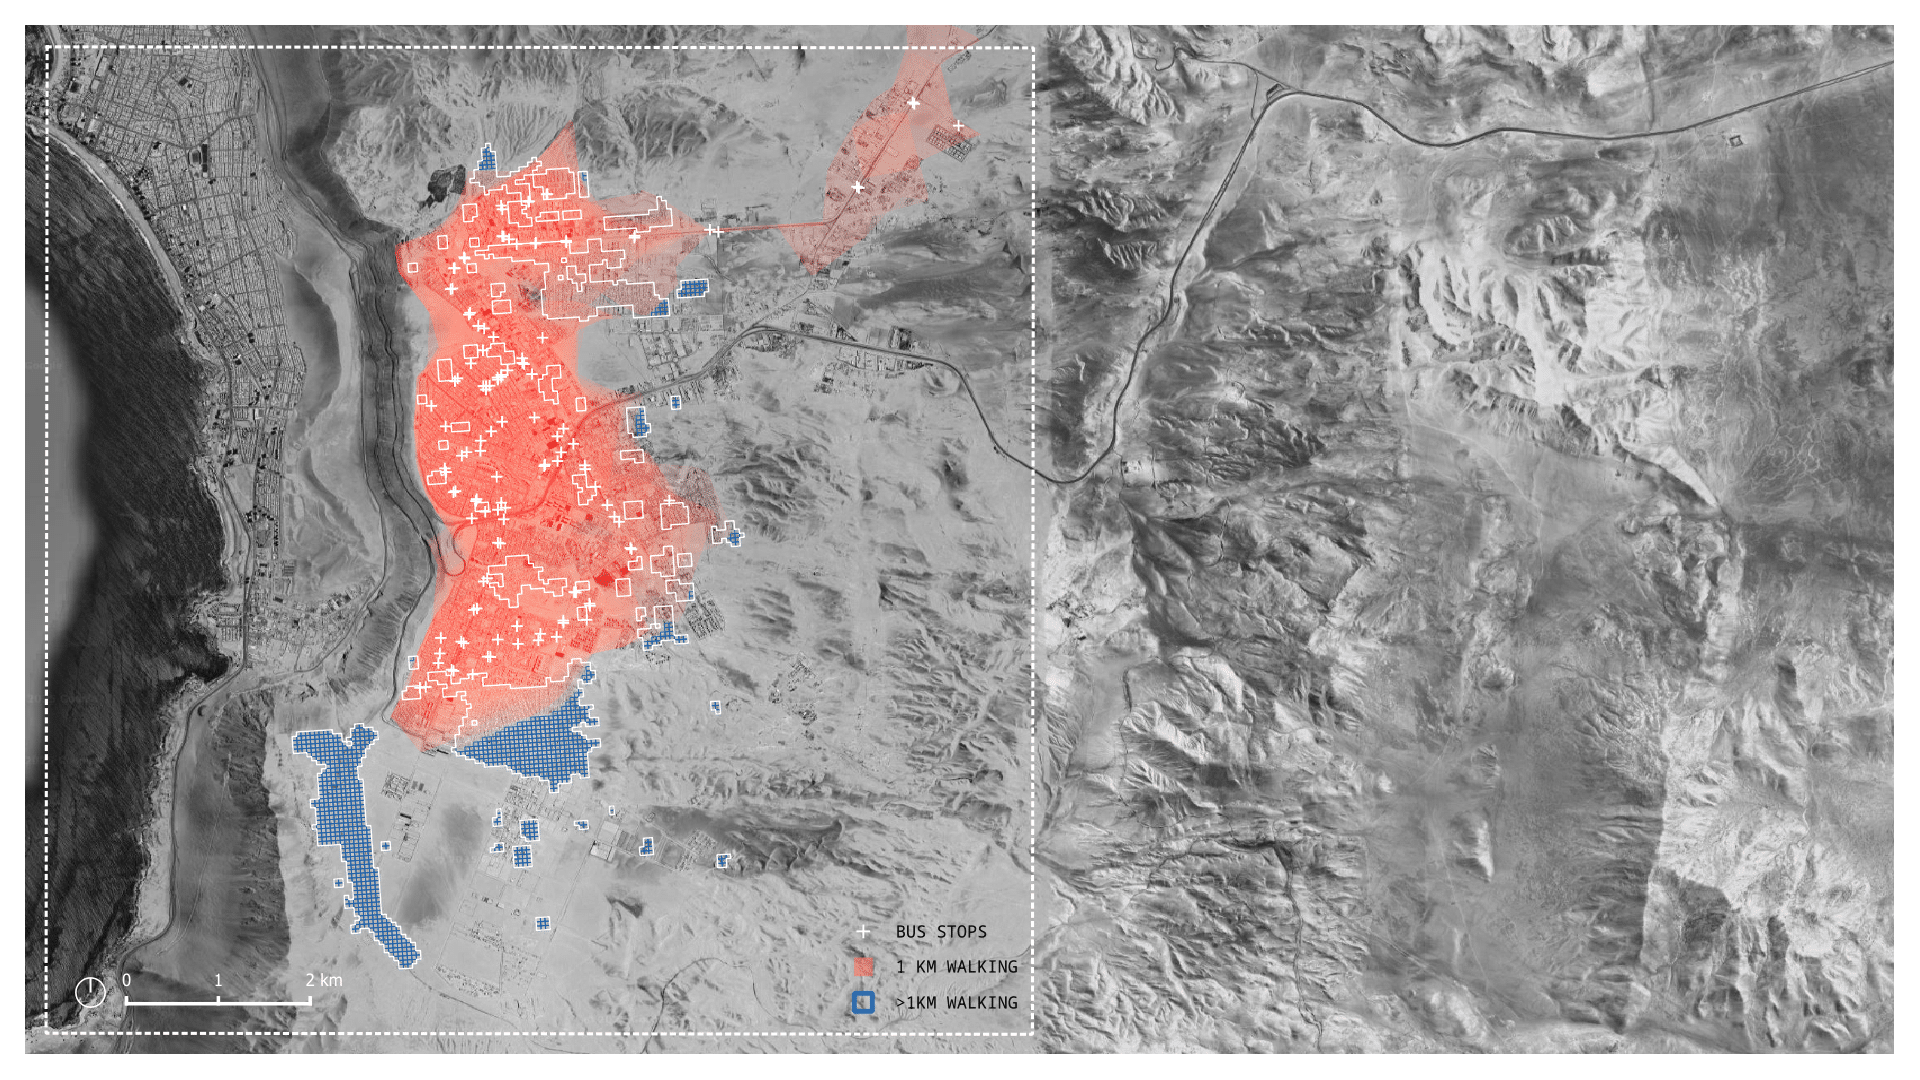
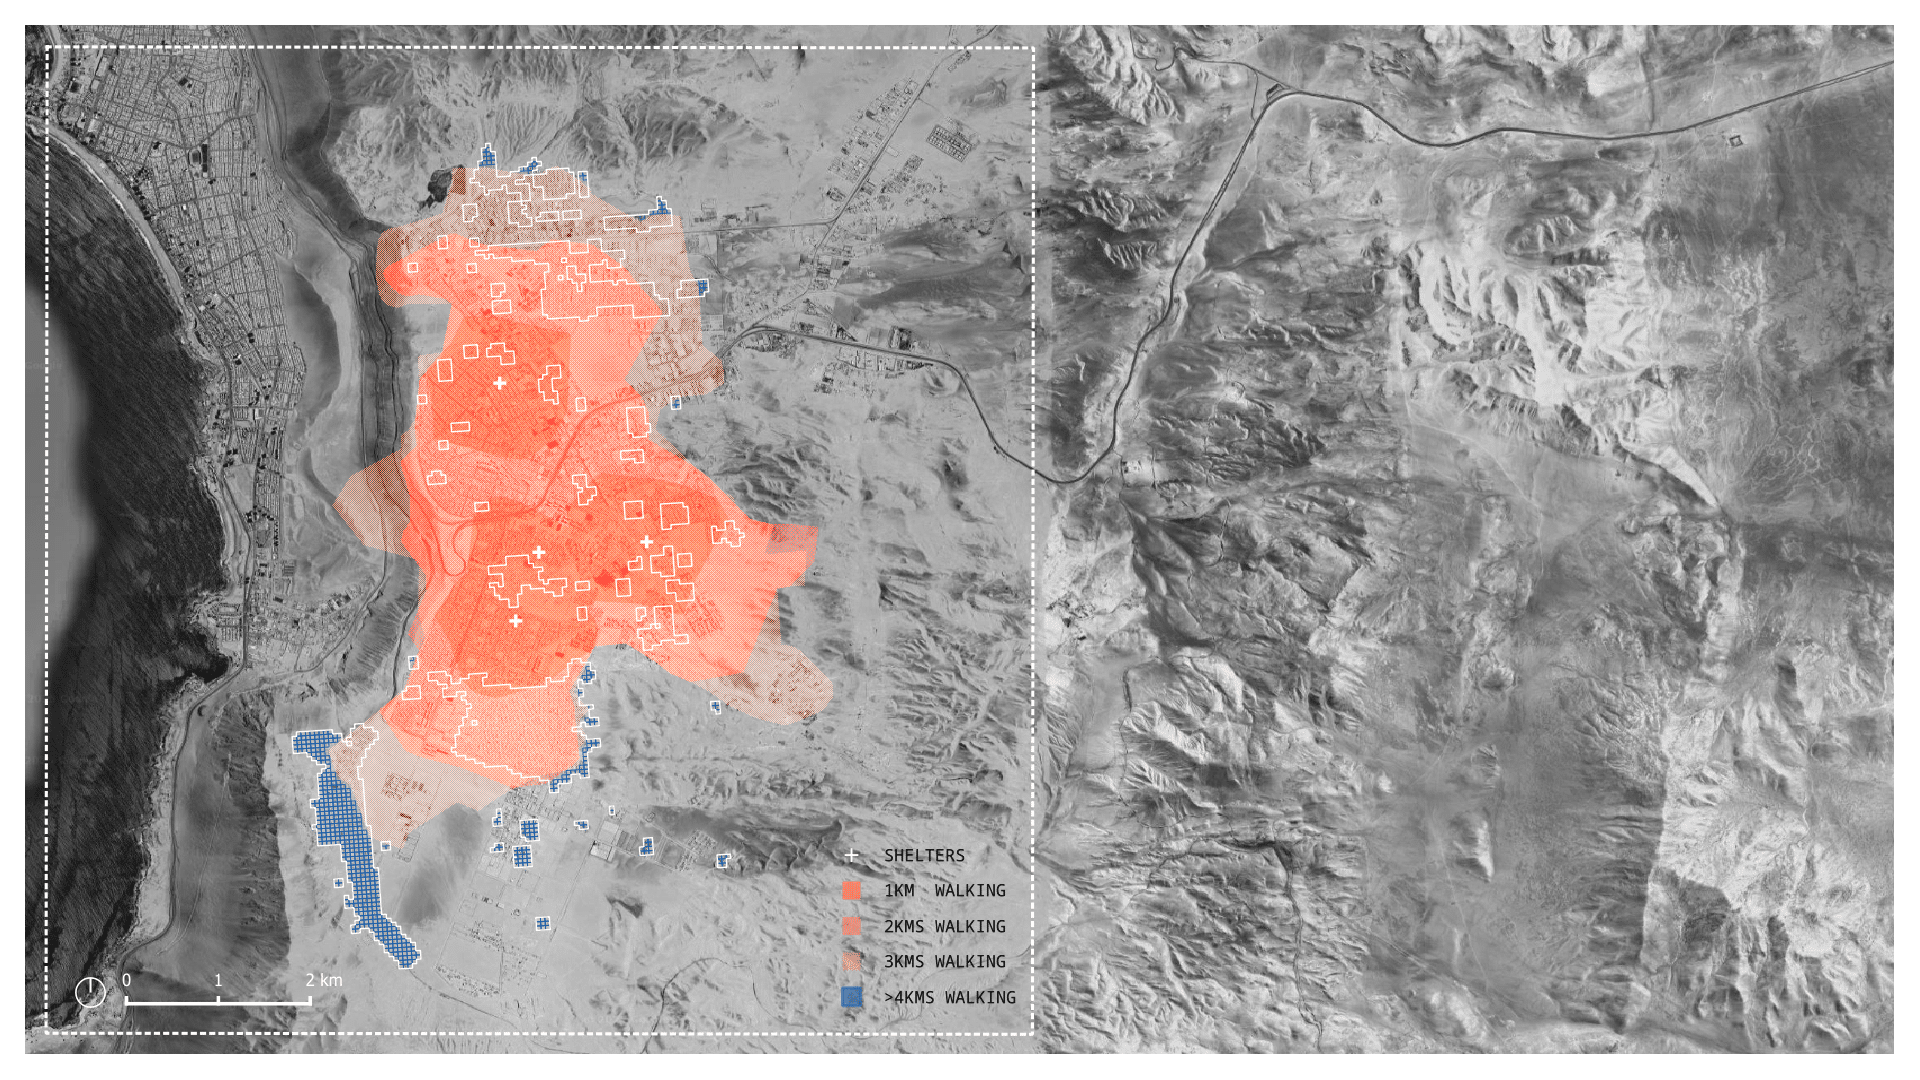
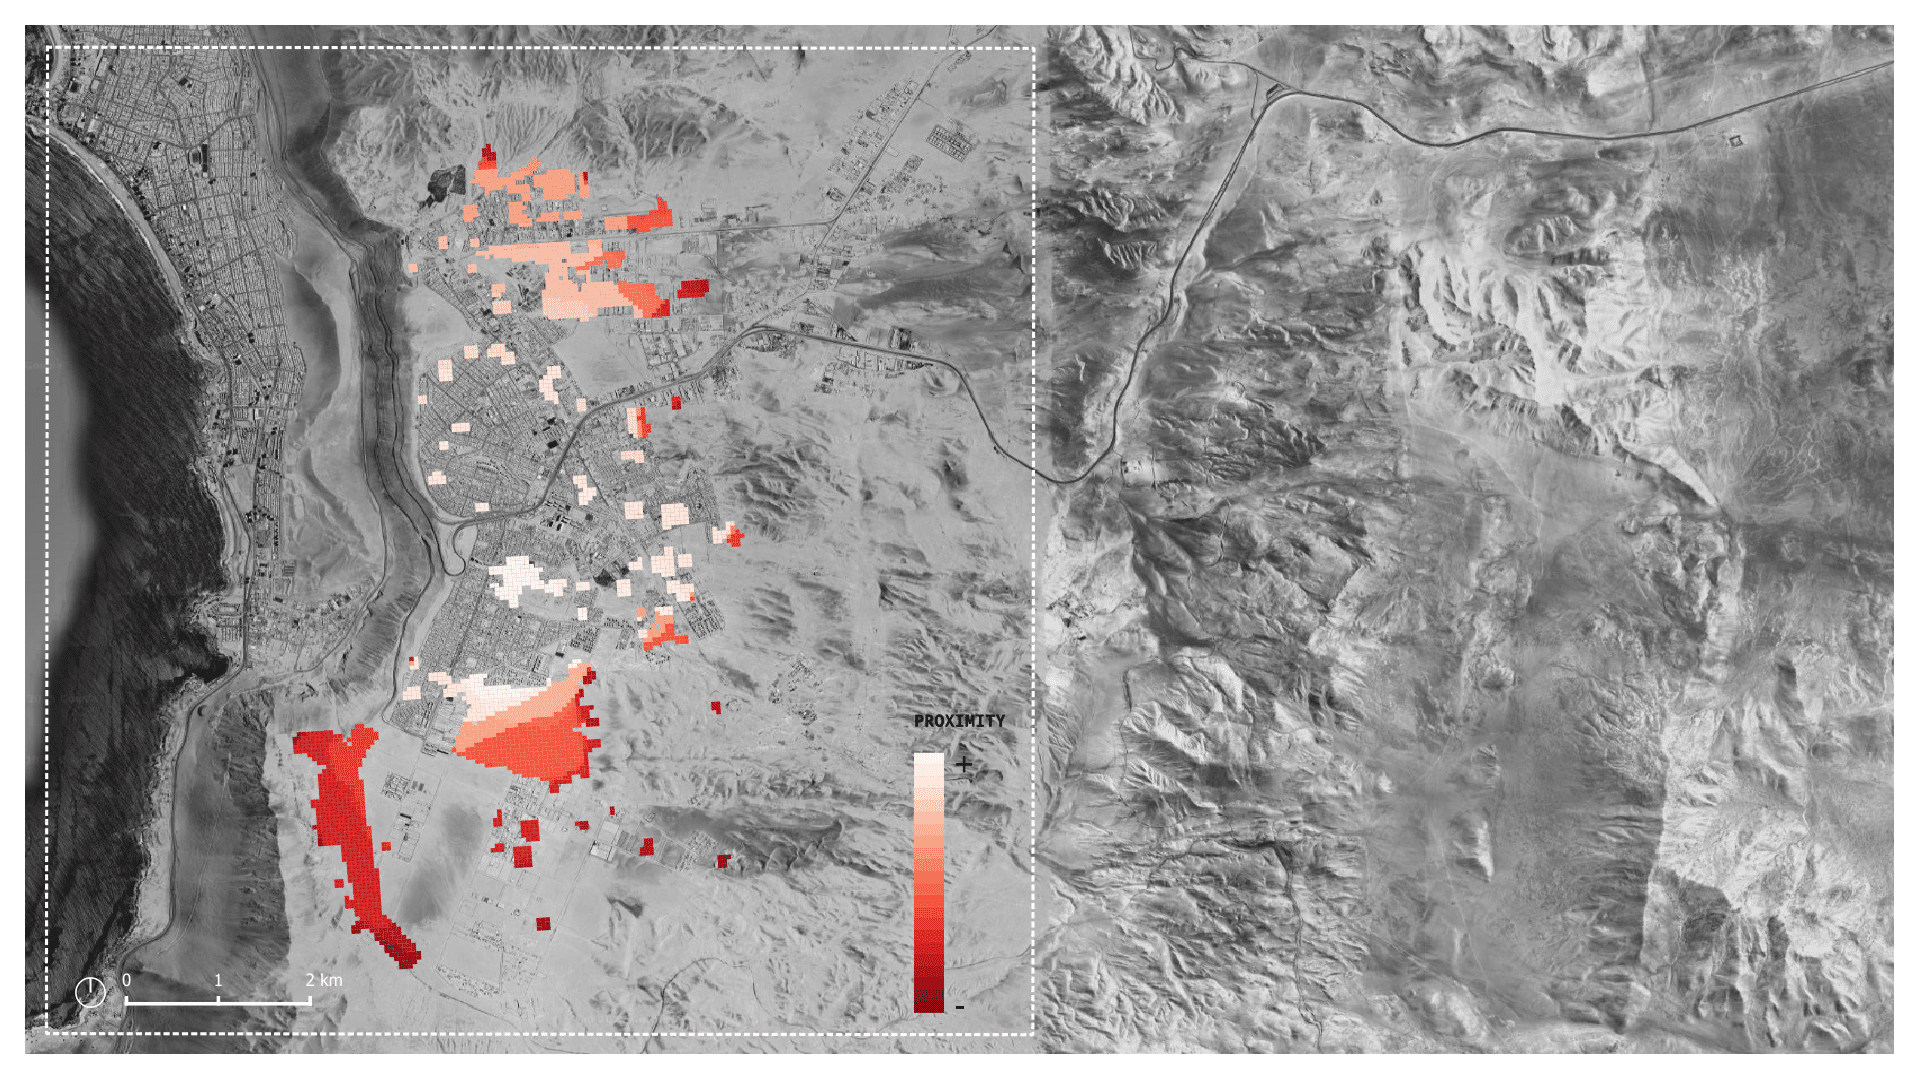
PROXIMITY TO DAILY AND EMERGENCY AMENITIES
To analyze distance to infrastructure, we sourced amenity data from OpenStreetMap and Google Places and used the ORS Isochrone plugin in QGIS to create proximity catchment areas. These tools helped us identify how far residents are from key services like schools, bus stops, hospitals, and shelters.
For our density analysis, we retrieved housing boundaries from Overture Maps and calculated built density using building footprints in QGIS. We then created a density heatmap to understand overcrowding and space constraints.
DENSITY
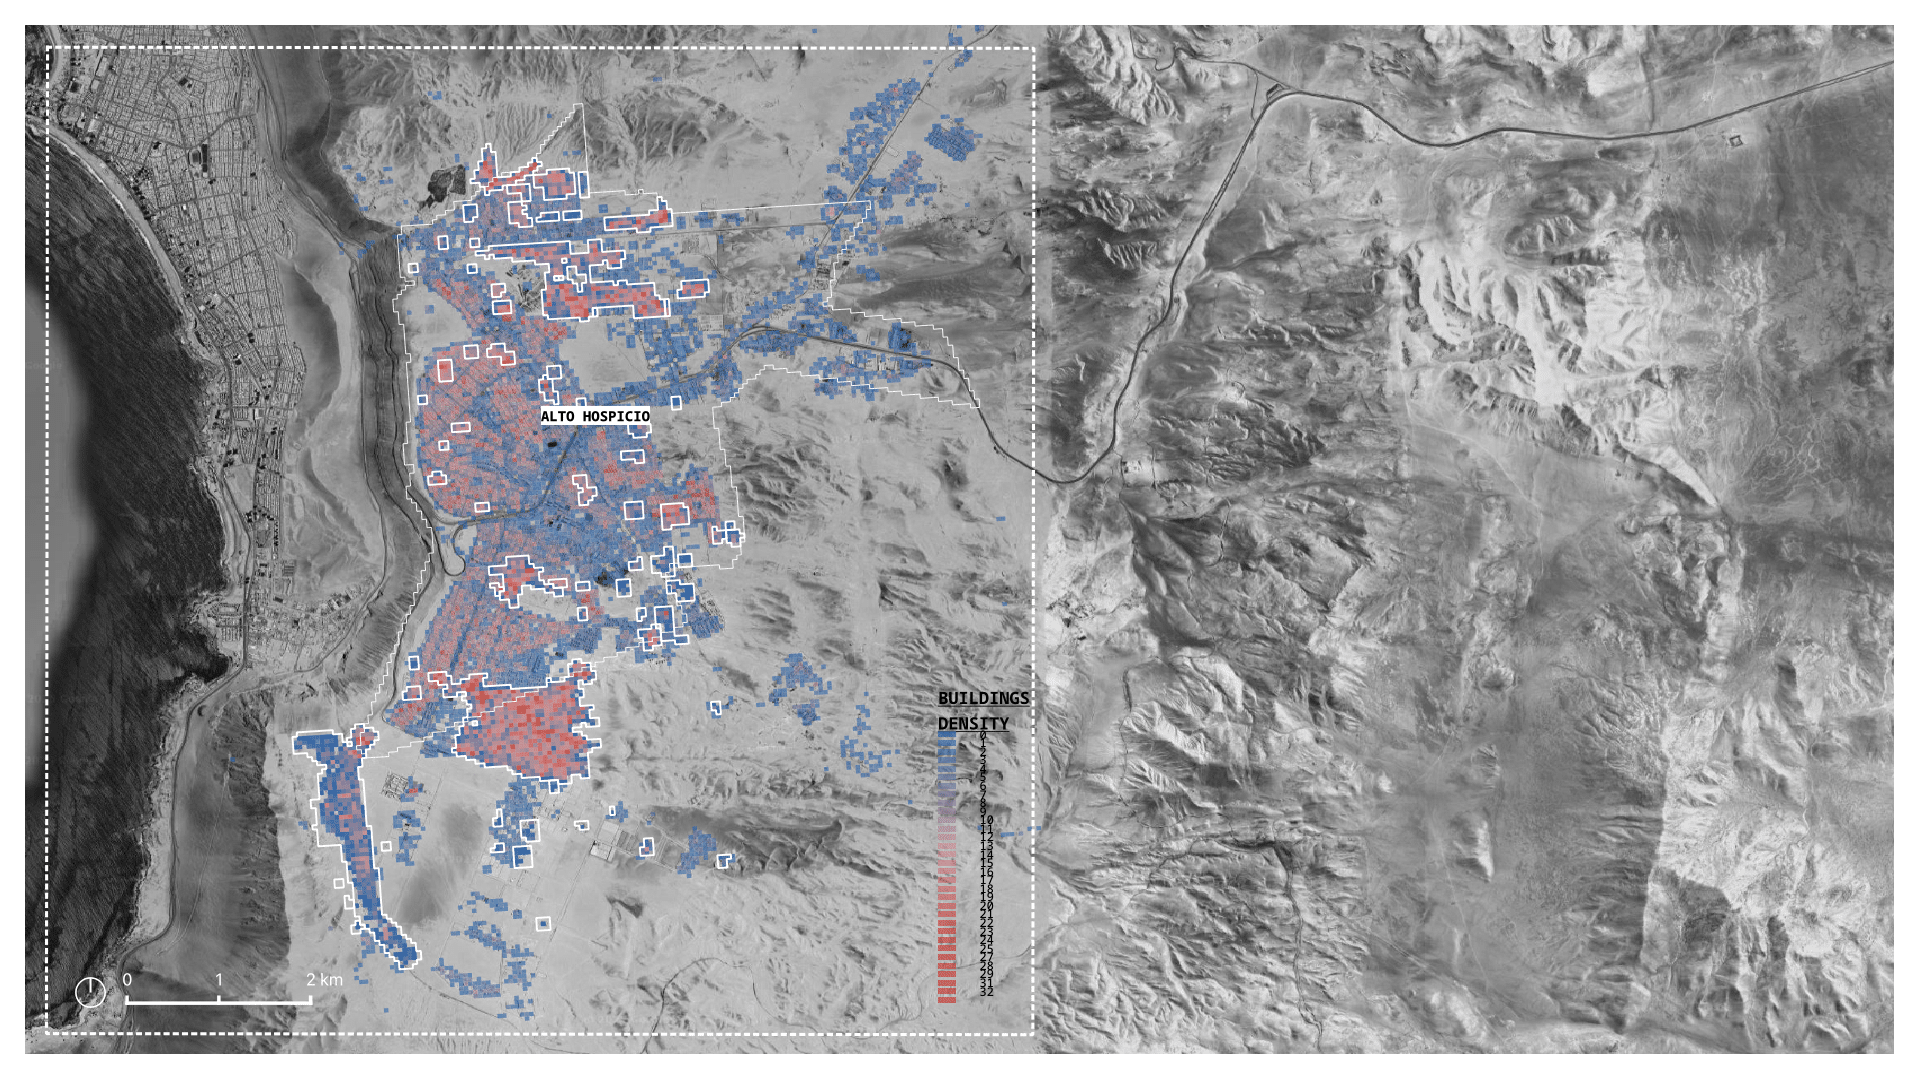
Density refers to the number of housing units per area. High density can indicate overcrowding and increased pressure on available services, while very low density may reflect isolation or limited access to urban infrastructure.
LIVABILITY VULNERABILITY
A community-powered tool:
A PLATFORM
We translate these findings into an open, interactive platform. Residents can explore camp‑specific risk profiles, upload missing data, and correct errors, turning “subjects” of research into co‑producers of knowledge. The tool supports immediate decisions—such as choosing safer plots or locating the nearest clinic—and strengthens long‑term advocacy by providing evidence for investment proposals and policy reform.
By integrating remote sensing with community input, the platform turns static risk assessments into a living resource. Transparent visualisations foster accountability, while resident‑driven updates ensure the map evolves with changing realities. Ultimately, the project seeks not only to document precarity but to empower camp dwellers, paving the way for more inclusive urban planning and resilient development across Chile’s informal settlements.
AN INTERACTIVE MAP