
Looking for a correlation between the presence of closed condominiums in Bogota and Crime Rate
“In Bogotá, one third of households live in gated communities. This phenomenon is a misleading application of the model idealized by the post-war urbanized American suburbs where an ideal, safe, happy, perfect life was idealized. A life where mobility prioritizes motorized vehicles, simple, replicable and, of course, profitable construction models.”
Santiago Baraya, ArchDaily (2019) on “Bogota, Island City. A collective research on closed condominiums
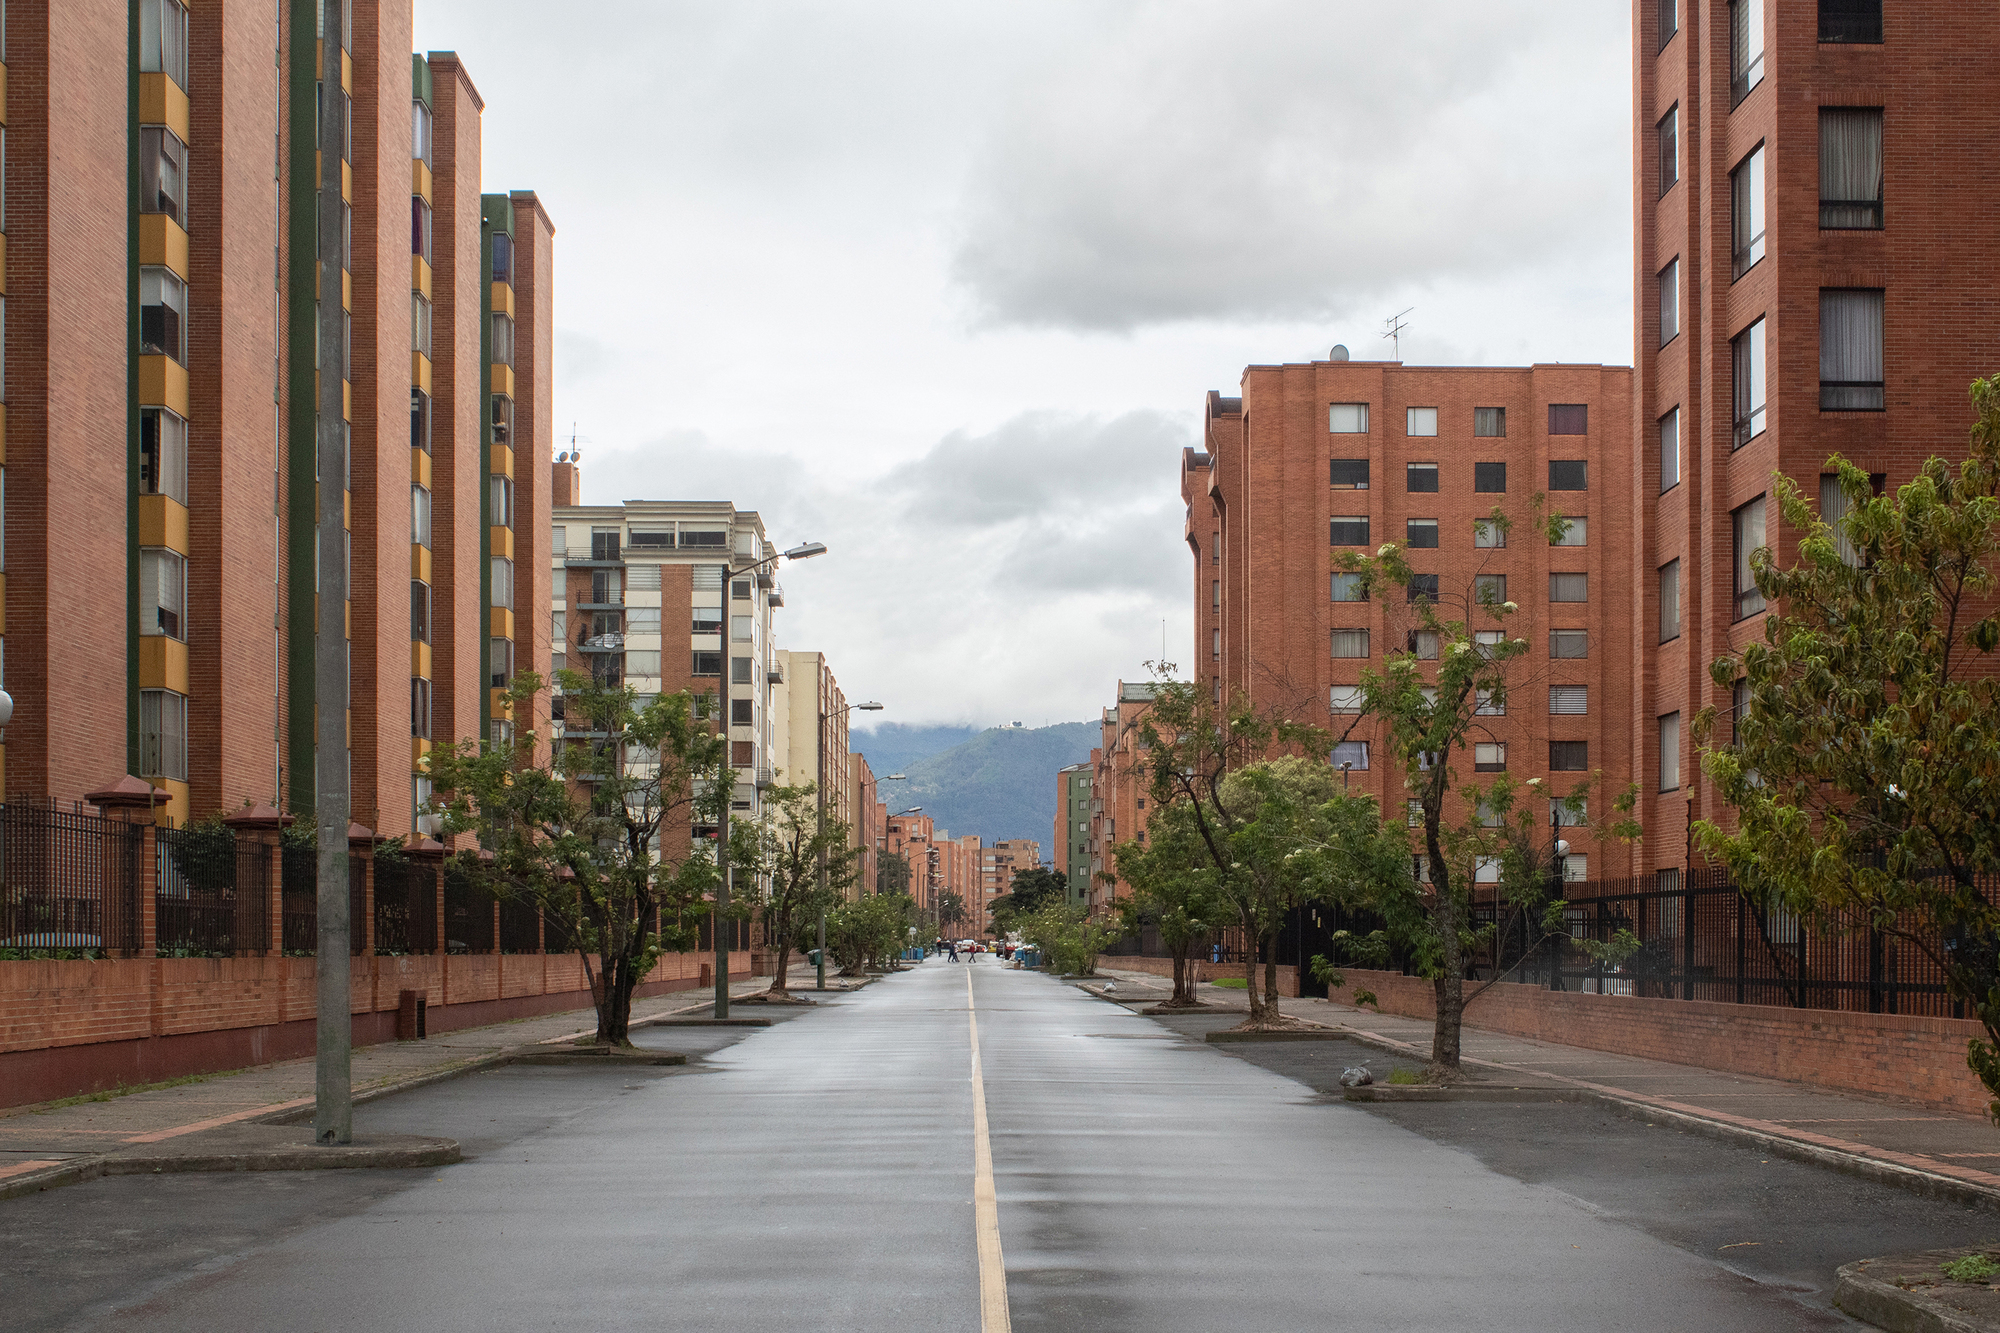
The desire for protecting what is mine has led to believe that gated communities give a sense of safety to the inside of household, but what is its effect on the safety and activity in the public space?
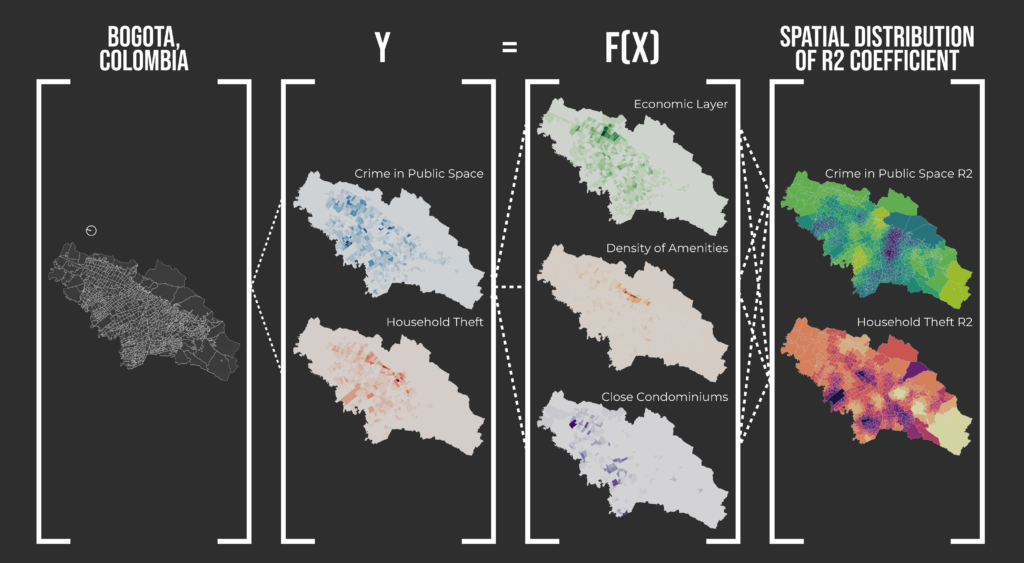
Through an spatio-statistical analysis developed entirely in Python-based environments, the objective of this research is to assess the hypothesis of the presence of close condominiums being correlated with the crime rate and house theft in Bogota, Colombia. This also asseses socioeconomical variables as the cadastral value of the plot and the socioeconomical stratum , a category assigned to households in Colombia as a proxy of income and access conditions; and public space activity, measured through the densitiy of amenities in space.
Is the crime rate in the public space directly proportional to the presence of close condominiums?
The initial null hypothesis posed states that higher density of close condominiums is directly proportional to the crime rate.
Are close condominiums helping avoid house theft?
As a counter-model, the incidence of household theft is also assesed, expecting higher condominiums to provide more security to the private property, translating into less house theft rates.
Methodology
Reading and consolidating the data
Dependent variables (Y)
The Open Data Hub of Bogota, Colombia provides a dataset of High Impact Crime (Delito de Alto Impacto – DAI) for the number and type of ocurrences related to crime in the city, such as theft (characterized for personal, cellphones, cars, bikes and households), murders and sexual violence. Using this as a main input for the dependent variables, two of these are extracted:
- CRIME, understood as the sum of incidences of personal, cellphone, bike robberies and murder
- HOUSEHOLD THEFT, understood as the activities that resulted in some robbery of private residential propoperty
These variables are aggregated by Zonal Planning Zones (Unidades de Planeamiento Zonal – UPZ), administrative polygons defined by the city.
Independent variables (X)
Socioeconomic Layer: The city provides a dataset containing the total cadastral value per block, which is aggregagated for all the blocks within each UPZ. Besides, the National Census of 2018 provides information of the population by socioeconomical stratum for each block. The most common stratum of the blocks within a UPZ is assigned.
Activity in the Public Space: This layer is consolidated extracting all the amenities available in OpenStreetMap.
Density of Close Condominiums: As there is no official dataset reporting the closed condominiums within the city, the Google Maps Places API is used to extract them, querying for all the points with the keywords “conjunto cerrado” for each UPZ polygon.
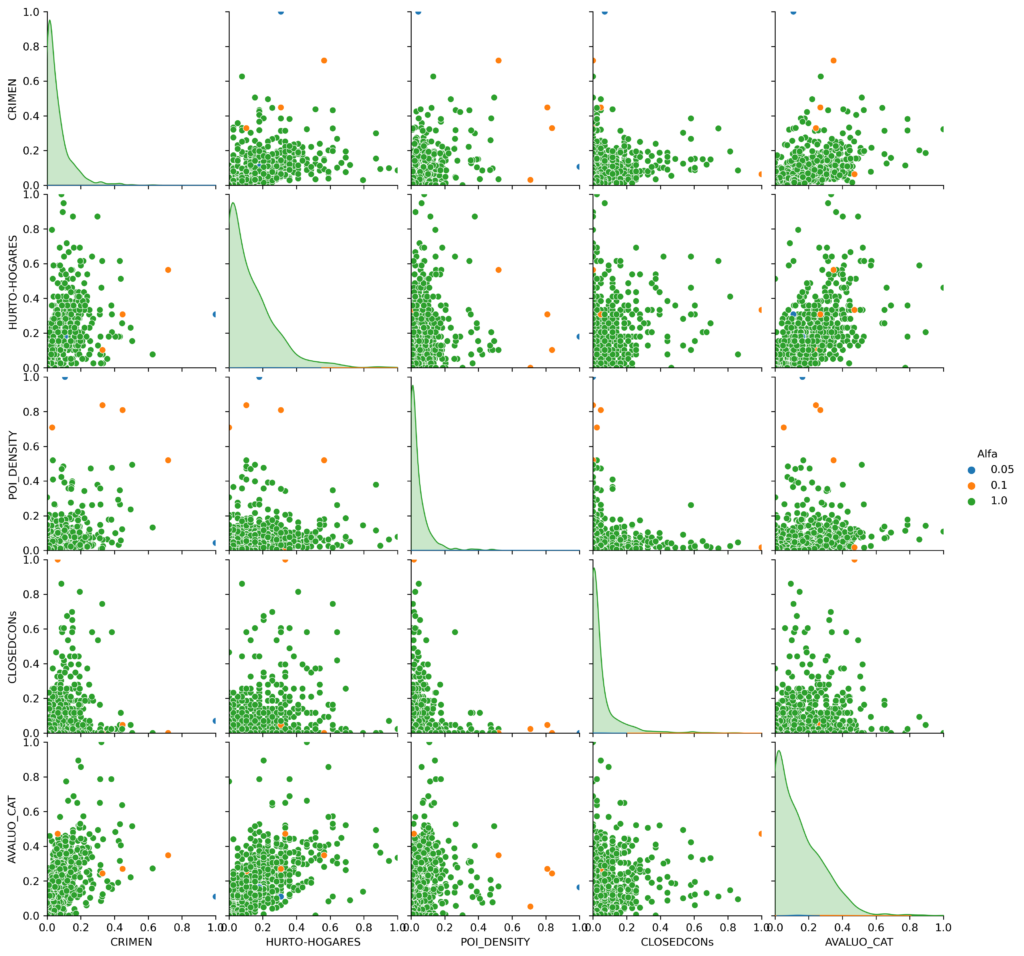
Cleaning the data
Using the Mahalanobis Methodology for outlier detection, three tests are performed using a tolerance of 5%, 10% and 100% for finally using a definitive a tolerance of 100%. The results, shown below, show no critical outliers. Besides, for performing spatially weighted models, it is expected for no neighbors to be missing, even if they are tagged as outliers under certain tolerance. Therefore, the totallity of the sample is used for fitting the different models.
Assesing Regression Models
Three (3) different types of models are assesed for each of the Y variables defined. The performance of the models was measured based on the R2 coefficient, where 0 indicates no correlation and 1 the best correlation. The models are defined as follows:
- Ordinary Least Squares Model, a non-spatial linear regression model to evaluate each occurance of CRIME and HOUSEHOLD THEFT as a function of CADASTRAL VALUE, AMENITIES DENSITY AND PRESENCE OF CLOSE CONDOMINIUMS. The output is one unified model, therefore one value of R2.
- Ordinary Least Squares Model with Spatial Lag, a spatial model that calculates correlation based on each UPZ’s neighboring values. The output is one unified model, therefore one value of R2.
- Geographically Weighted Regression Model, a spatial model which takes into account the local relationships between the variables. The output provides a specific model for each UPZ, therefore providing a local R2. This allows to report the mean value of the coefficient as well as its distribution and standar deviation.
The obtained performance is summarized below:

The spatial distribution of the spatial models is shown below:
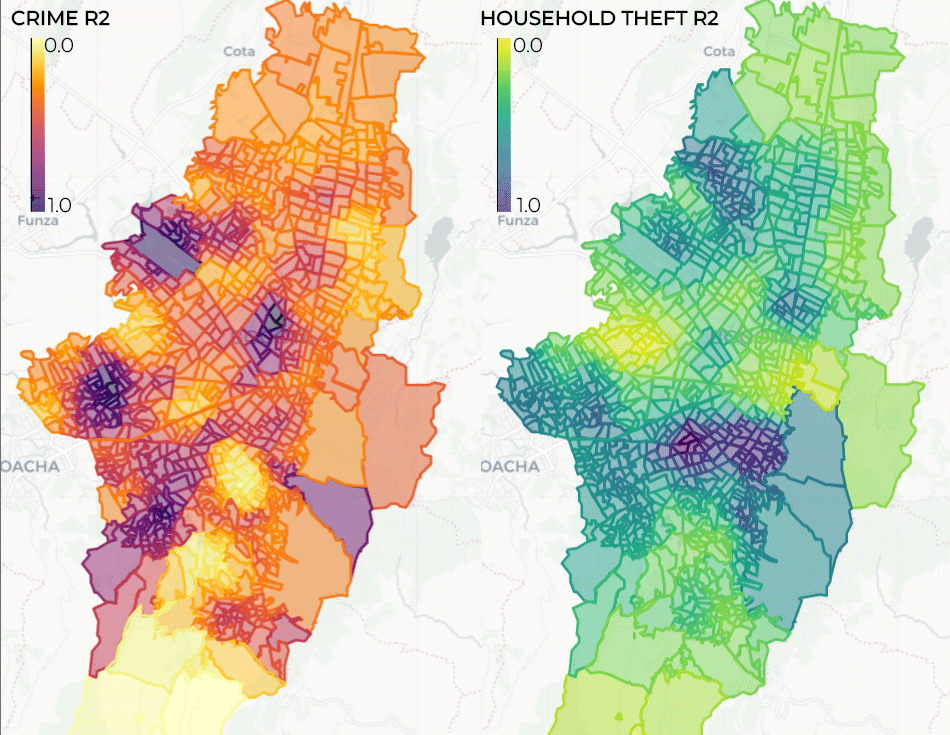
Key takeaways
The results obtained show the utility of developing spatial models, as the average performance of the models significantly increased for the GWR compared to the OLS. In a general manner, the models adjust robustly in the majority of the extent of the city, with some focused cases of low correlation.
Why is there low correlation in these places?
Sauces neighborhood: High crime and house robbery rates with no presence of close condominiums. Other factors that might take place such as the open channel
Juan Pablo 2: High crime rates with no presence of closed condominiums. It is a zone of very low income, self-built houses, high slope and low accesibility to the rest of the city.
Simon Bolivar Park and Airport: High crime rates with no presence of closed condominiums. Large areas of metropolitan scale attractor points.
