

For the last two decades, Mexico has grappled with an escalating wave of violence that has put the entire nation on edge, but it is particularly alarming and dangerous simply for being a woman.
This alarming trend, characterized by uncontrolled levels of violence and fueled by a deeply ingrained misogynistic culture, underscores the urgent need for groundbreaking solutions, as evidenced by the over 968 lives lost to femicides in 2022 alone, a 127% increase since 2015.
Premise – A theory about the escalation of violence
Unchecked violence escalates and proliferates if unaddressed. It often starts with minor incidents like verbal insults or slight confrontations, which can develop into more severe violent behavior.
These early acts, typically unreported and perceived as insignificant, are crucial to document for understanding violence patterns. Without early intervention, this escalation leads to severe outcomes like assaults and homicides. The key is prevention.
Thesis – The use of GML can potentially help in prevention strategies
Currently, government actions have been primarily reactive, addressing crimes only after they occur. By leveraging Graph Machine Learning, we aim to transform this approach by predicting where and when crimes are likely to happen, and identifying potential victims.
This proactive methodology begins with the systematic collection and organization of crime data in Mexico City, focusing particularly on patterns and distributions of gender-based violence. This data-driven insight, enabled by GML, can significantly enhance intervention effectiveness, offering a powerful tool for preventive strategies.
Through GML, we can pinpoint emerging trends and high-risk areas as well time of day where crime happens, thus facilitating early and targeted responses to prevent violence before it escalates.
Methodology
This project aims to analyze femicides and violence against women in Mexico City. By integrating various datasets, including crime reports, homicide records, as well as help centers locations, the project seeks to find patterns and relationships that can inform effective interventions and policy decisions.
Predictions: Develop predictive models to analyze the correlation between the locations and timing of femicides, aiming to identify patterns and trends that will inform a preventive strategy against such crimes.
Features:
1. Crime reports
2. Help Centers
3. Poverty index
Classes:
1. Femicides (time of day occurring)
Outcomes:
* Provide insights for law enforcement and policymakers to implement
targeted interventions.
* Offer data-driven recommendations to improve public safety measures and support services for women.
* Enhance community awareness and engagement through data-informed solutions.
Gender based crimes in Mexico City
– Crime reports location by zone and filtered by gender 403,928 reports (2019-2024) 318 of them femicides
– Everything outside the black boundary is still considered part of the metropolitan area, nevertheless it consist on informal settlements where information access is inconsistent.
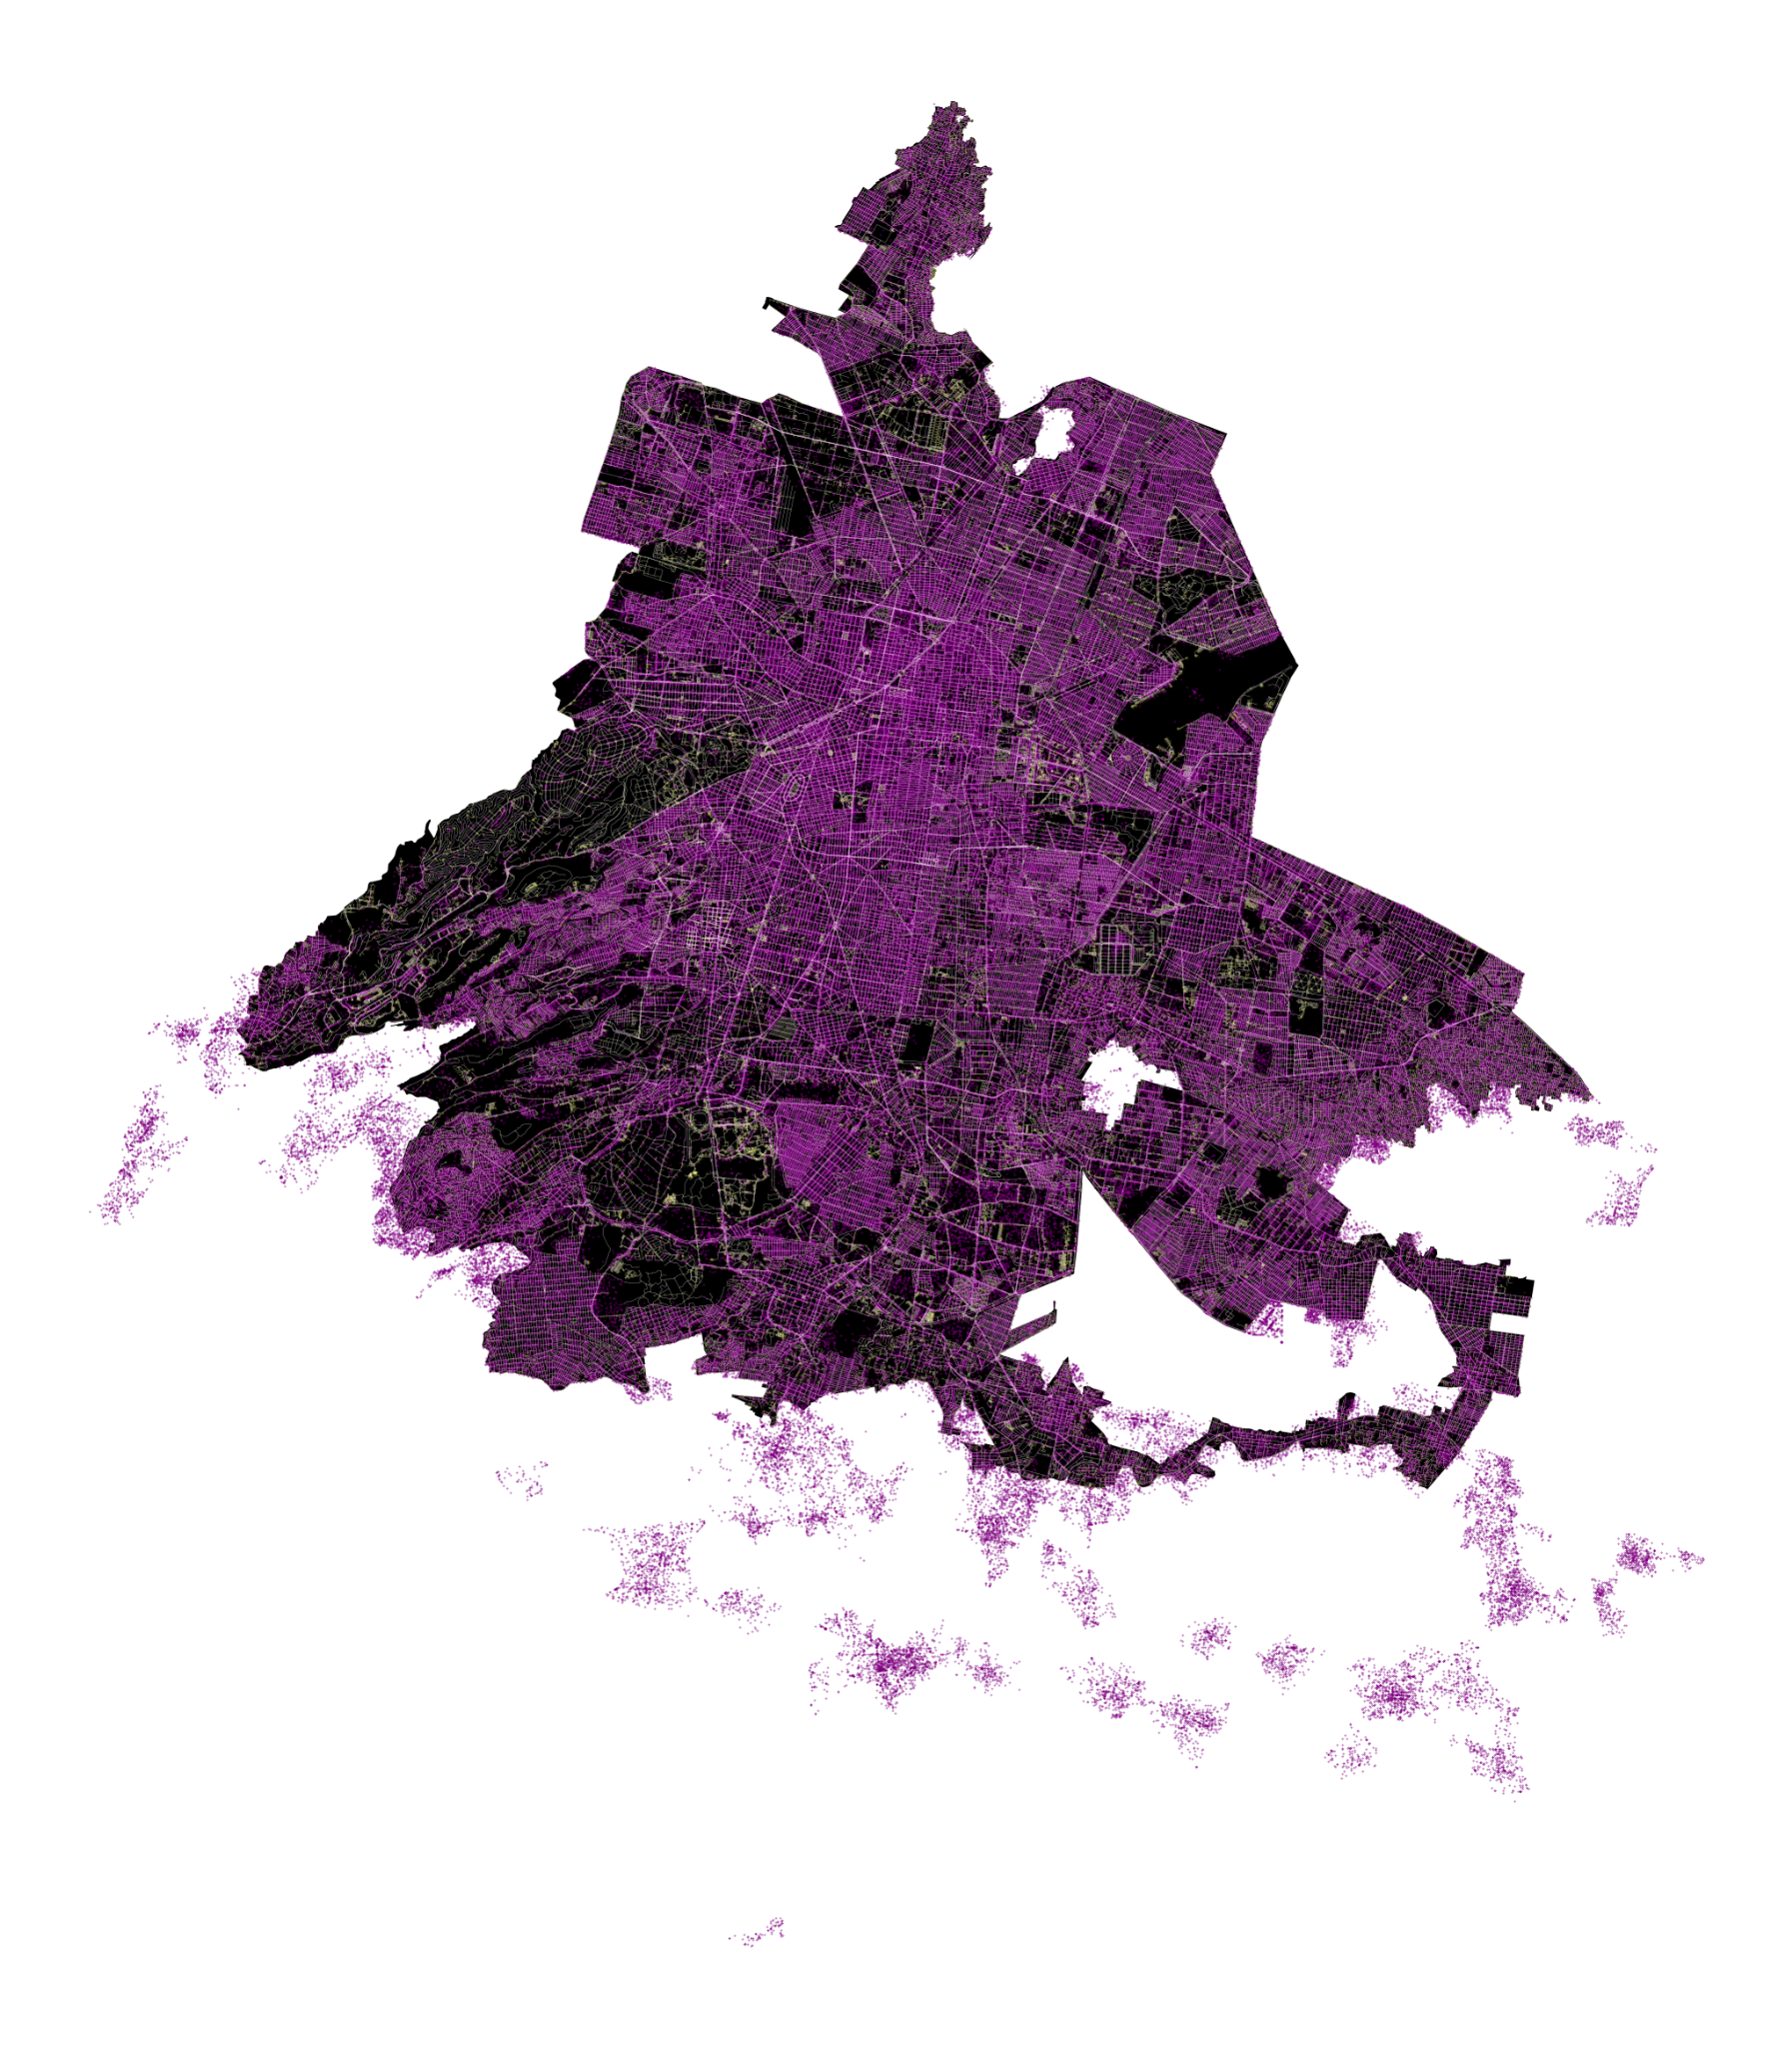
Contrary to popular belief, the crime reporting rate in Mexico City, especially for gender-based offenses, is notably high.
This suggests a significant awareness and readiness to report such incidents, challenging the assumption that these crimes are frequently underreported. The data underscores the necessity for strong support systems and effective law enforcement to handle and reduce gender-based violence.
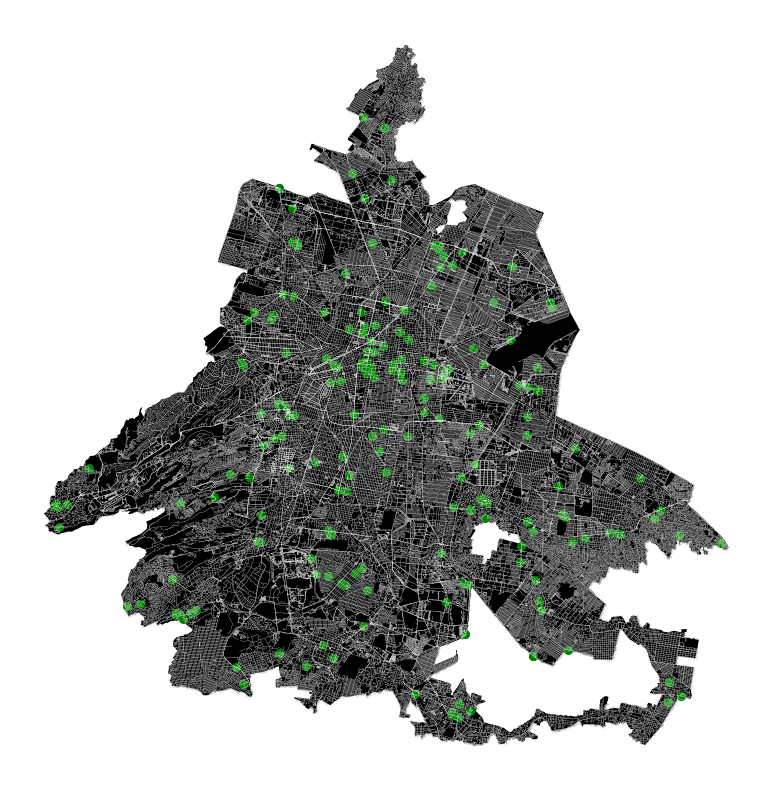
Mexico City’s current response – Women help centers
In response to the rising violence against women, Mexico City has established women’s help centers (location marked in green) to provide essential support and resources to victims.
While these centers deliver crucial services, data suggests that they have not significantly reduced crime rates in these areas, as incidents of violence continue to occur.
The primary challenge with this approach is its reactive nature; the centers focus on assisting victims after incidents have occurred rather than implementing proactive measures to prevent such violence from taking place initially.
Correlation between WHC and crime location
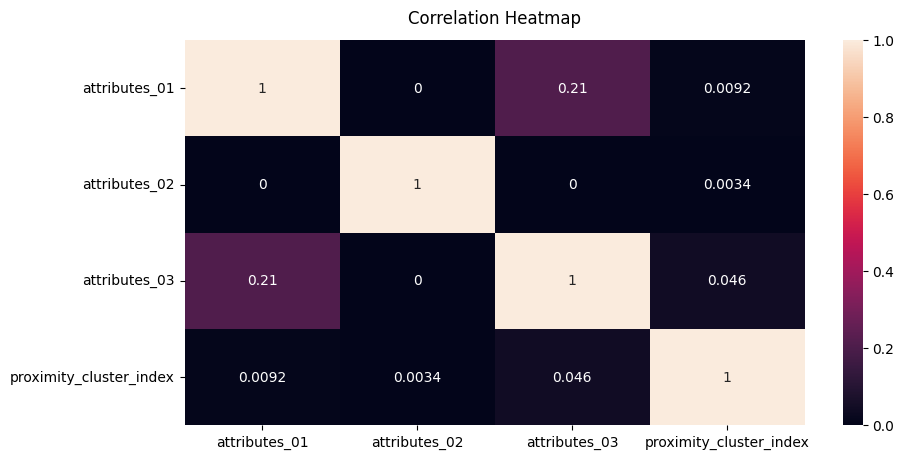
From this correlation heat map, we derived the following conlcusions.
- Crimes vs. Help Centers: The lack of correlation suggests that the number of help centers is not directly related to the frequency of crimes committed against women in the regions studied.
- Crimes vs. Poverty: A weak positive correlation implies that as the poverty index increases, there is a slight increase in crimes committed against women. However, the relationship is not strong.
- Help Centers vs. Poverty: No correlation indicates that the number of help centers does not vary with the poverty index.
Next step, locating femicides
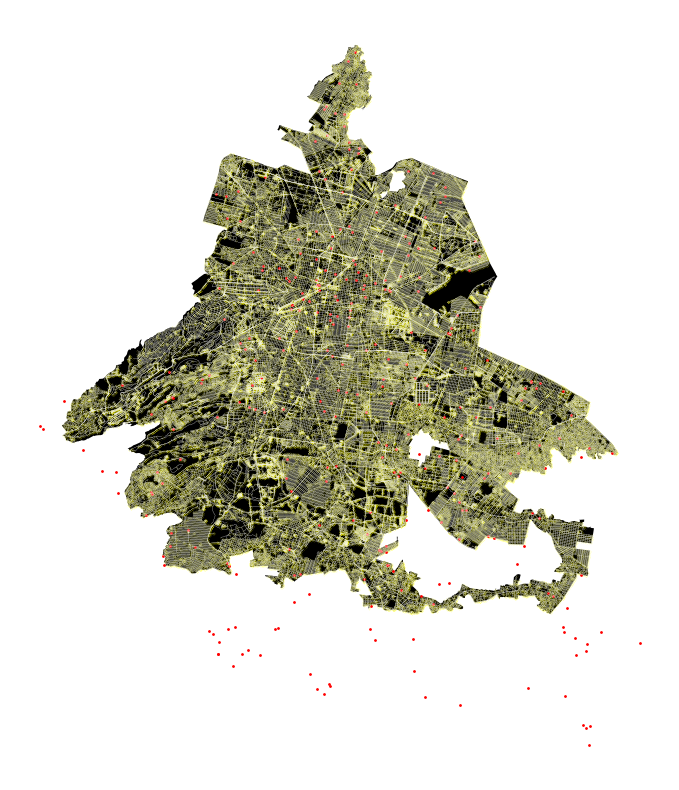
v1: Initial Tests
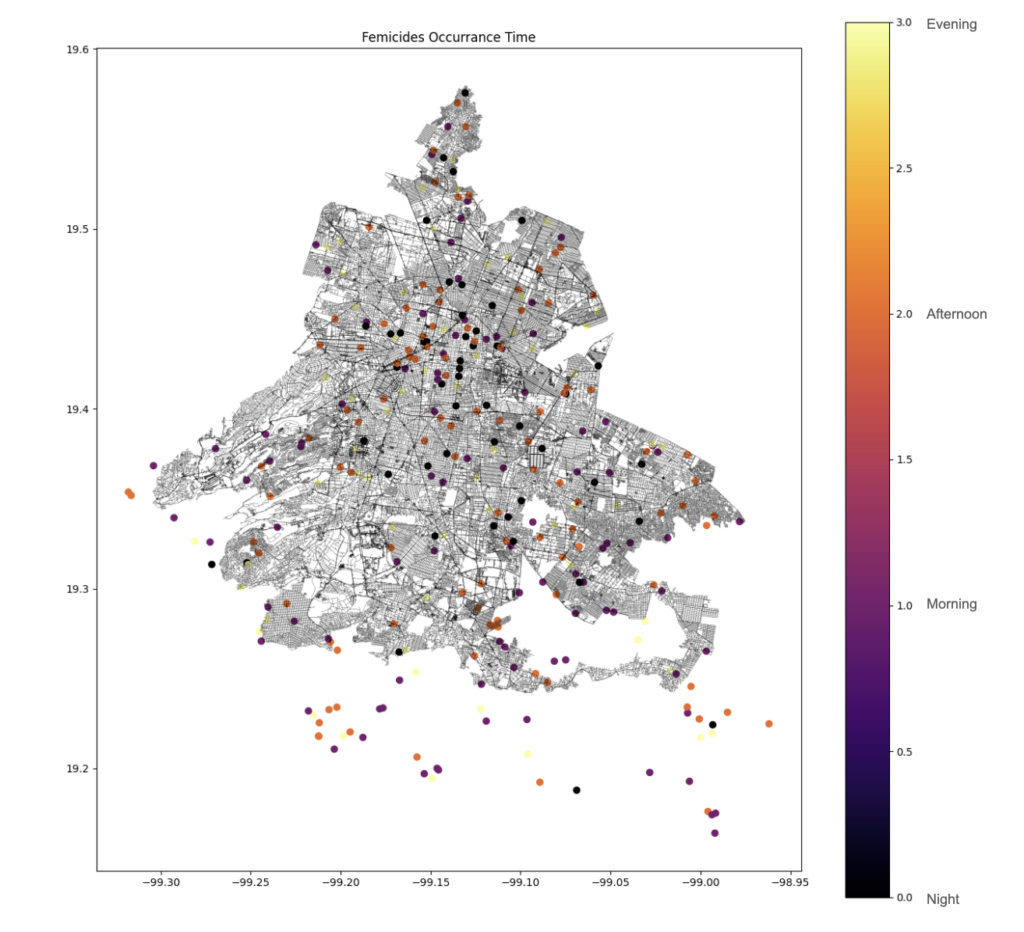
This map depicts the occurrences of femicides in Mexico City, highlighting the time of day when they occurred. The map uses a color gradient to represent different times of the day: black dots indicate occurrences at night (0h – 5h, 51 occurrences), purple dots for the morning (6h – 11h, 92 occurrences), orange dots for the afternoon (12h – 17h, 110 occurrences), and yellow dots for the evening (18h – 23h, 65 occurrences).
Femicides occur throughout Mexico City, with no area entirely free of incidents. There are clusters of femicides in certain parts of the city, indicating areas with higher frequencies. The distribution of colors suggests that femicides occur at various times of the day, with no specific time being overwhelmingly dominant.
All features and classes are represented as nodes on the graph, with the value assigned to the node nearest to the centroid of the occurrences. This map provides a spatial and temporal view of femicide occurrences in Mexico City, showing both the locations and the times at which these incidents happen, with each time of day distinctly represented.
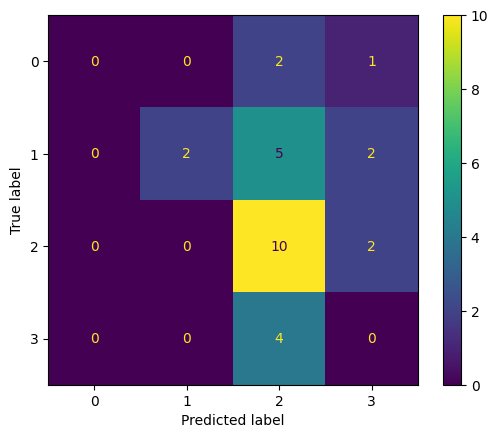
Key Observations:
- Best Performance: The model performs best for Class 2 with 10 correct predictions.
- Common Misclassification:
- Class 0 is misclassified as Class 2 and Class 3.
- Class 1 is misclassified as Class 2 and Class 3.
- Class 3 is misclassified as Class 2.
Improvement Areas: The model needs significant improvement for Class 0 and Class 3, as it fails to correctly predict any instances for these classes. Reducing misclassifications, especially for Class 3 being predicted as Class 2, is essential to enhance overall model performance.
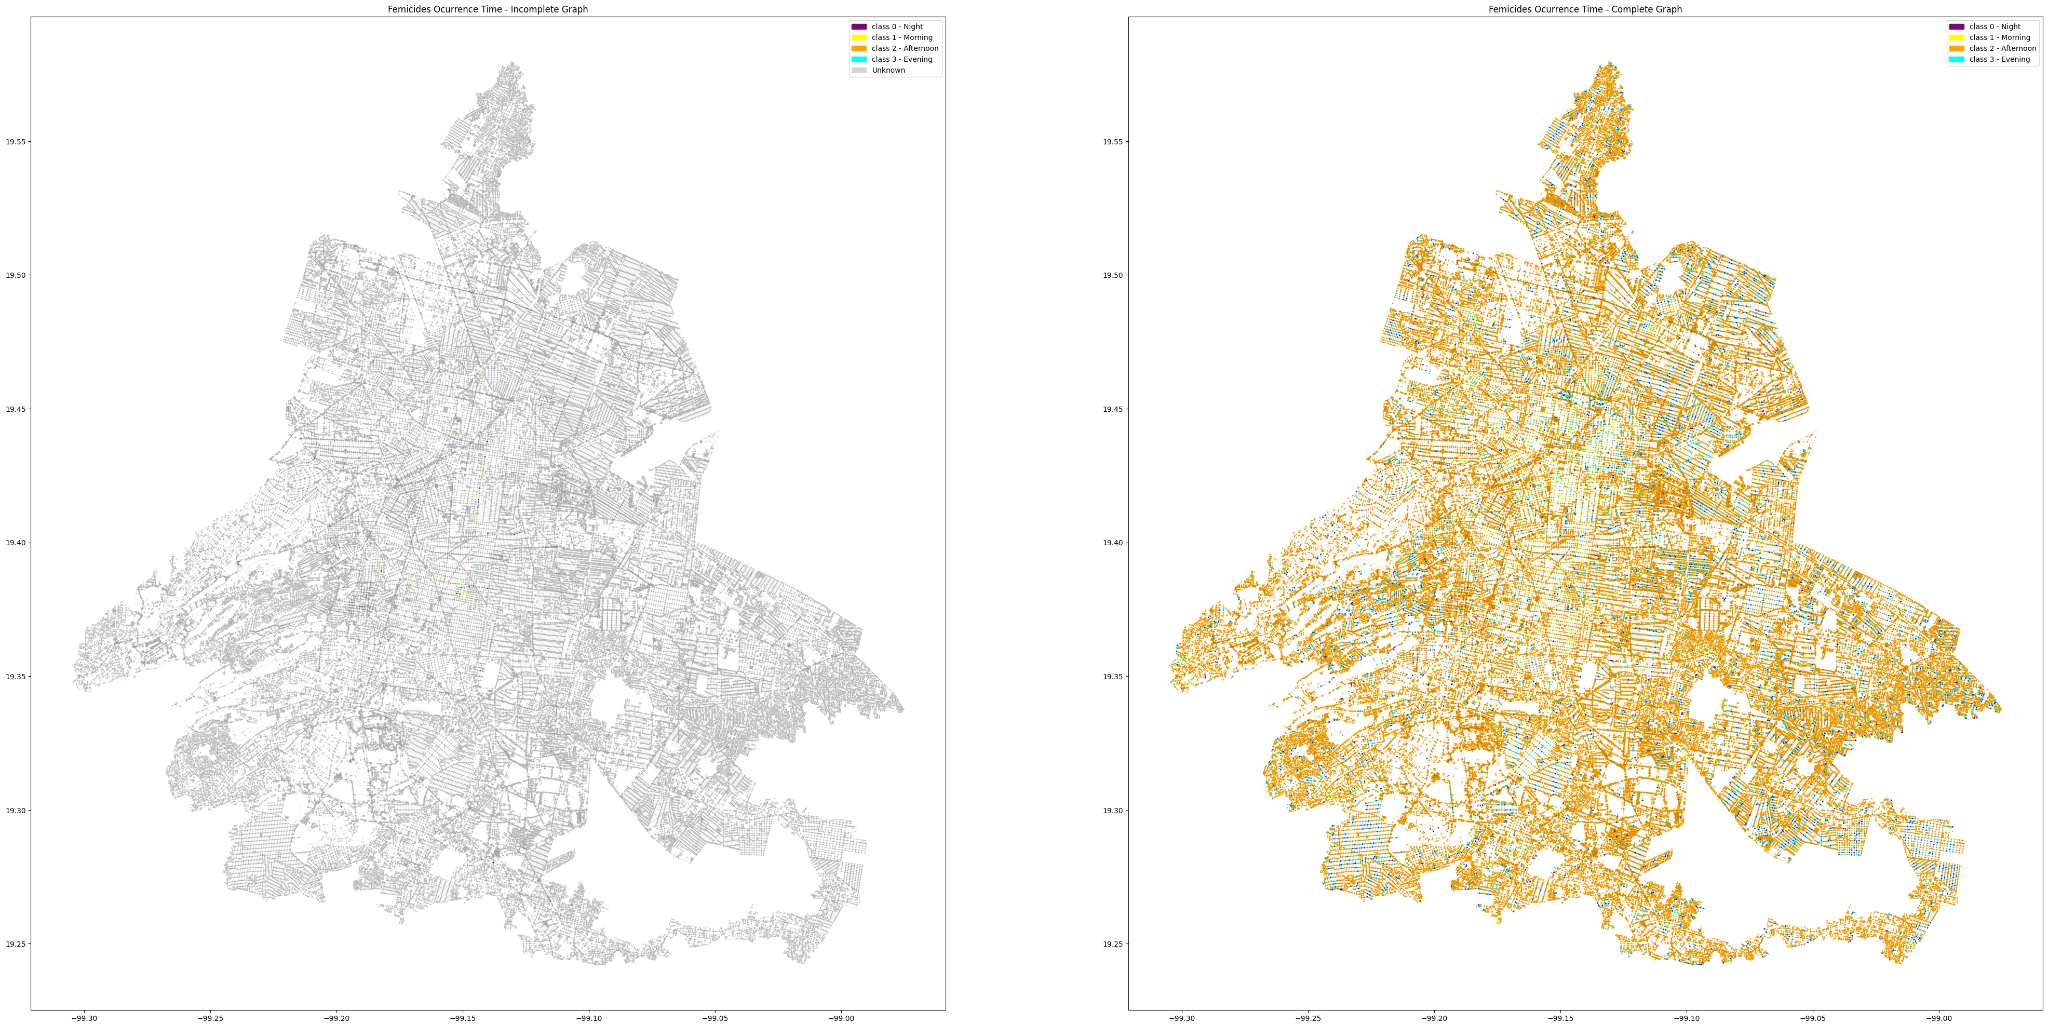
Here, we present of two maps comparing the initial and completed graphs of femicide occurrence times in Mexico City.
The left map represents an initial, incomplete graph of femicide occurrences. It shows sparse data points, with fewer femicide locations and occurrence times represented. The map uses a color gradient to indicate different times of the day: purple for 0h – 6h, yellow for 6h – 12h, cyan for 12h – 18h, and orange for 18h – 24h.
The right map displays a more comprehensive graph of femicide occurrences. This map features significantly more data points, providing a fuller picture of femicide distribution and times. It uses the same color gradient to represent the times of the day as the initial test map, but with much denser and widespread data points.
Comparing the two maps reveals key insights:
- Data Density: The complete graph shows a much denser and widespread distribution of femicide occurrences, indicating more thorough data collection.
- Temporal Distribution: Both maps use the same color coding to represent different times of day, but the complete graph provides a more accurate temporal distribution of femicides.
- Graph Completeness: The complete graph offers a better understanding of both spatial and temporal patterns in femicide occurrences across Mexico City.
v2: K-Means Clustering (One-Hot Encoding)
One-Hot Encoding as a strategy to increase number of class instance nodes
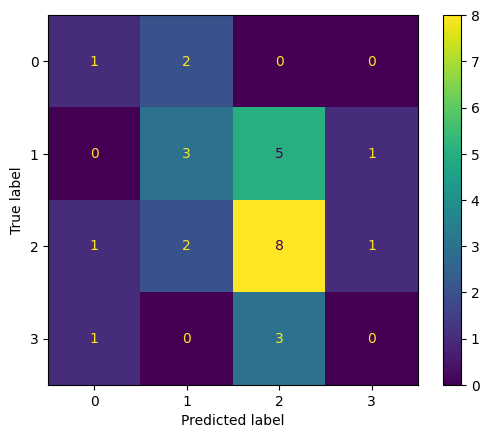
Key Observations:
- Best Performance: The model performs best for Class 2 with 8 correct predictions.
- Common Misclassification: Class 0 is often misclassified as Class 1, and Class 1 is frequently misclassified as Class 2.
- Improvement Areas: The model needs to reduce misclassifications, especially for Classes 0 and 3, where the number of correct predictions is low. There is also a need to improve the prediction accuracy for Class 3, as it has no correct predictions.
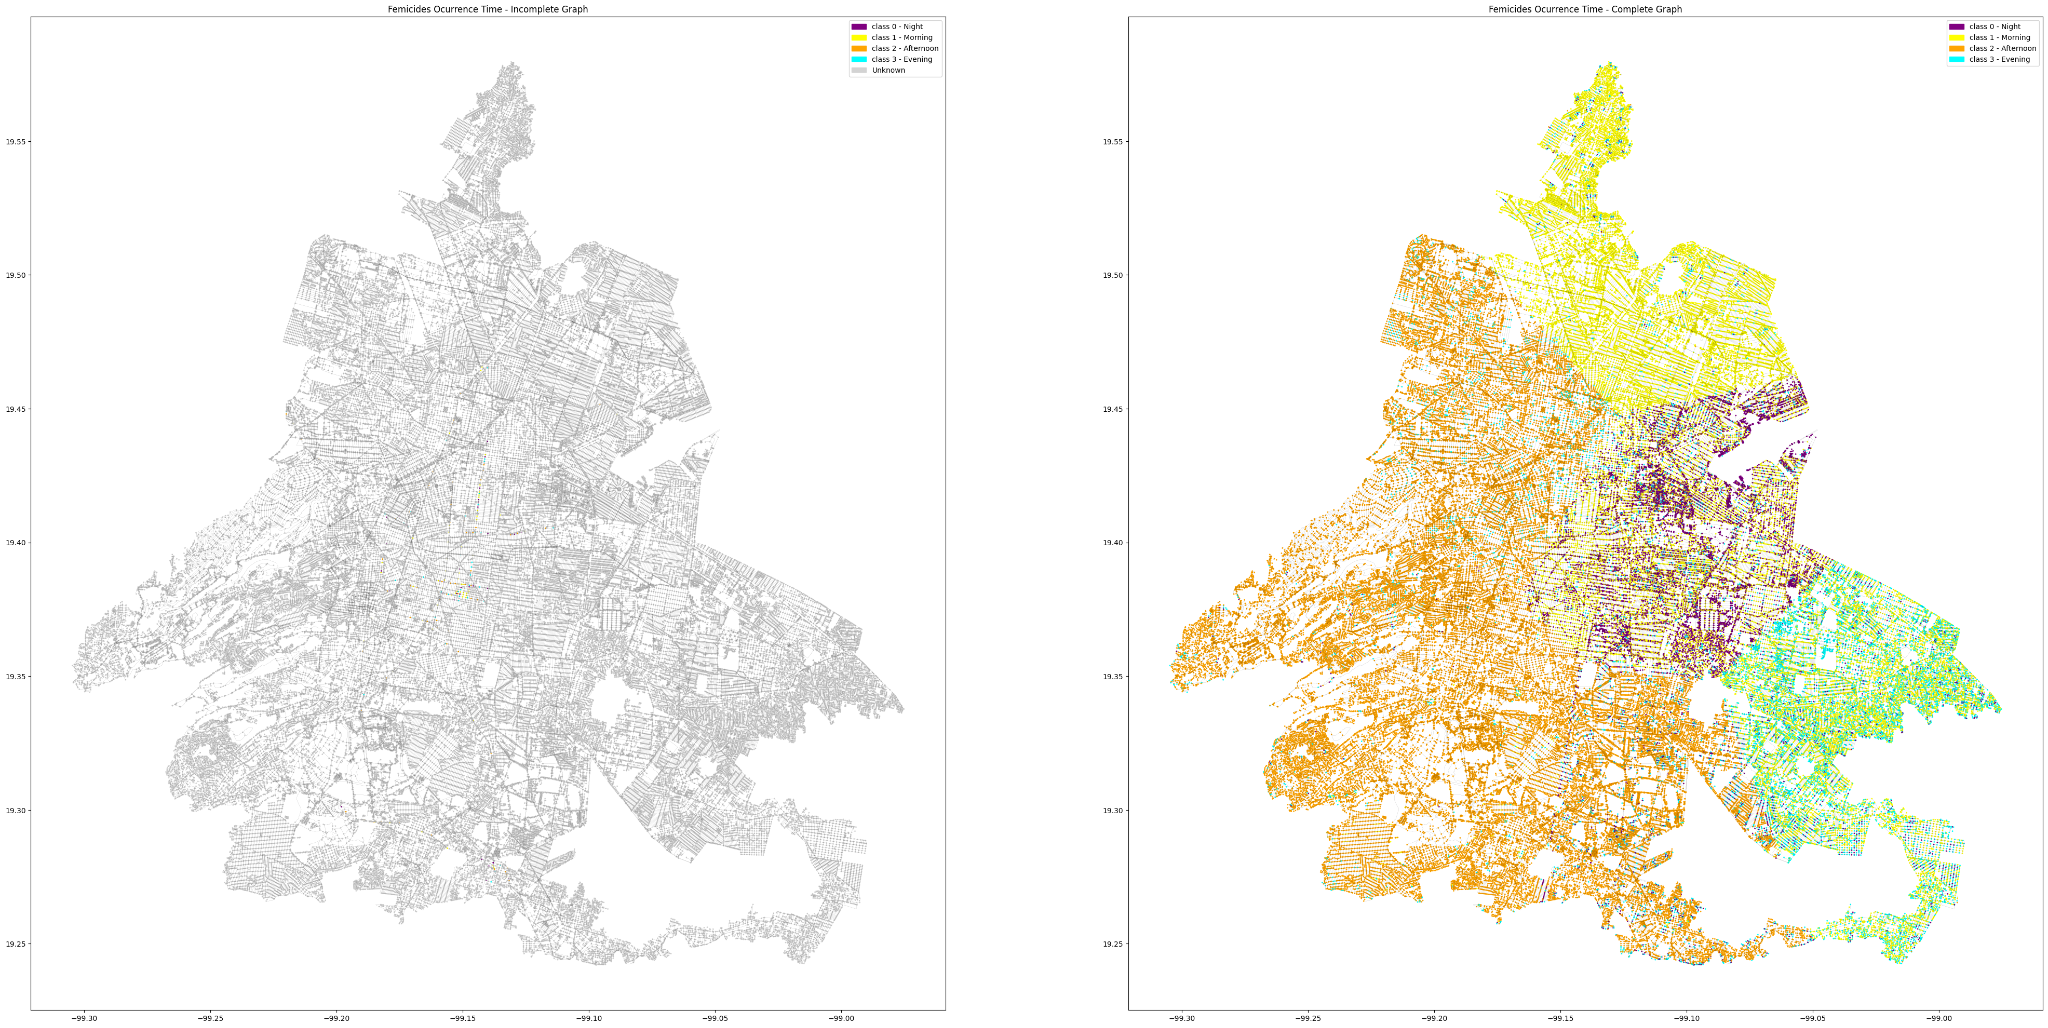
Here are two maps comparing the initial and completed graphs of femicide occurrence times in Mexico City using K-Means Clustering with One-Hot Encoding.
The left map, represents an initial, incomplete graph of femicide occurrences using K-Means Clustering. It shows sparse data points, with fewer femicide locations and occurrence times represented. The map has limited initial clustering, as indicated by the few data points present.
The right map displays a more comprehensive graph of femicide occurrences using K-Means Clustering with One-Hot Encoding. This map features significantly more data points, providing a fuller picture of femicide distribution and times. The color coding represents different times of the day: purple for 0h – 6h, yellow for 6h – 12h, cyan for 12h – 18h, and orange for 18h – 24h. These clusters represent different temporal segments, showing how femicide occurrences are grouped based on the time of day.
Comparing the two maps reveals key insights:
- Data Density: The complete graph shows a much denser and widespread distribution of femicide occurrences, indicating more thorough data collection and clustering.
- Clustering Efficiency: The complete graph highlights the effectiveness of K-Means Clustering with One-Hot Encoding, providing clear temporal segments.
- Temporal Distribution: Both maps use the same color coding to represent different times of day, but the complete graph provides a more accurate temporal distribution of femicides.
Overall, these maps illustrate the progression from an initial, sparse dataset to a more comprehensive and detailed representation of femicide occurrences, enhanced by K-Means Clustering with One-Hot Encoding, to better understand where and when these incidents happen in Mexico City.
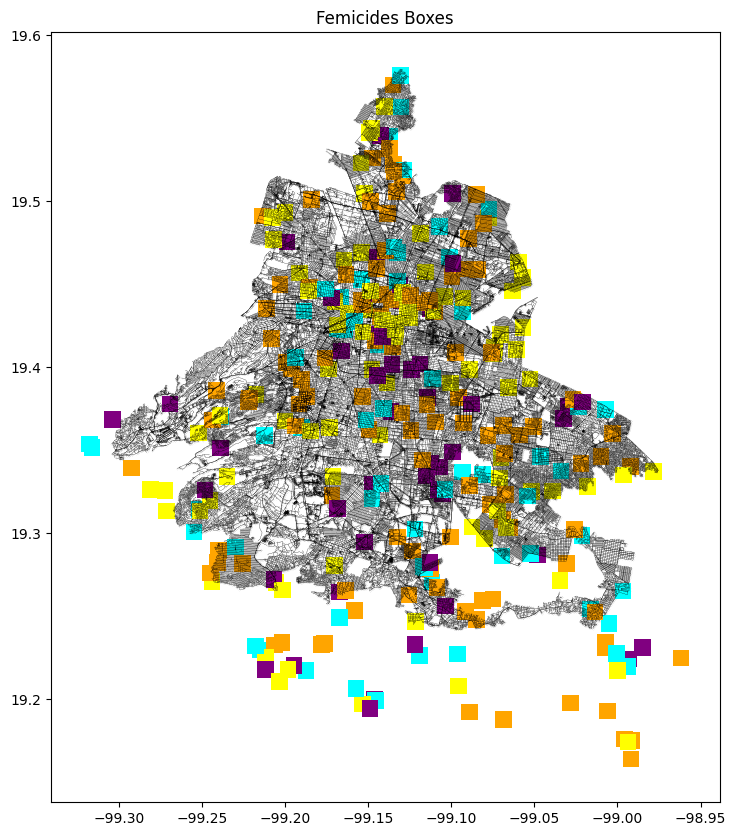
v3: Bounding Box Classes
The following map illustrates femicide occurrences in Mexico City using bounding boxes to represent different times of the day. The bounding boxes are used to increase the number of instances, providing a more comprehensive view of the data.
The color code represents the times of the day:
- Purple: Night (0h – 6h)
- Yellow: Morning (6h – 12h)
- Orange: Afternoon (12h – 18h)
- Cyan: Evening (18h – 24h)
The map shows femicides distributed throughout Mexico City, with bounding boxes highlighting areas with multiple instances. The color-coded bounding boxes indicate that femicides occur at various times of the day, with no single time period dominating. By using bounding boxes, the map increases the number of instances represented, providing a clearer picture of femicide patterns.
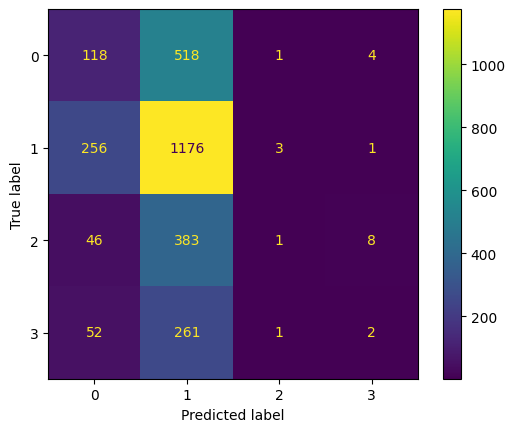
Key Observations:
- Best Performance: The model performs best for Class 1 with the highest correct predictions.
- Common Misclassification: The model frequently misclassifies other classes as Class 1.
Improvement Areas: Focus on reducing misclassifications of Classes 0, 2, and 3 to Class 1 to improve overall accuracy. The model needs significant improvement in predicting Classes 2 and 3 correctly, as it fails to predict any instances of these classes accurately.
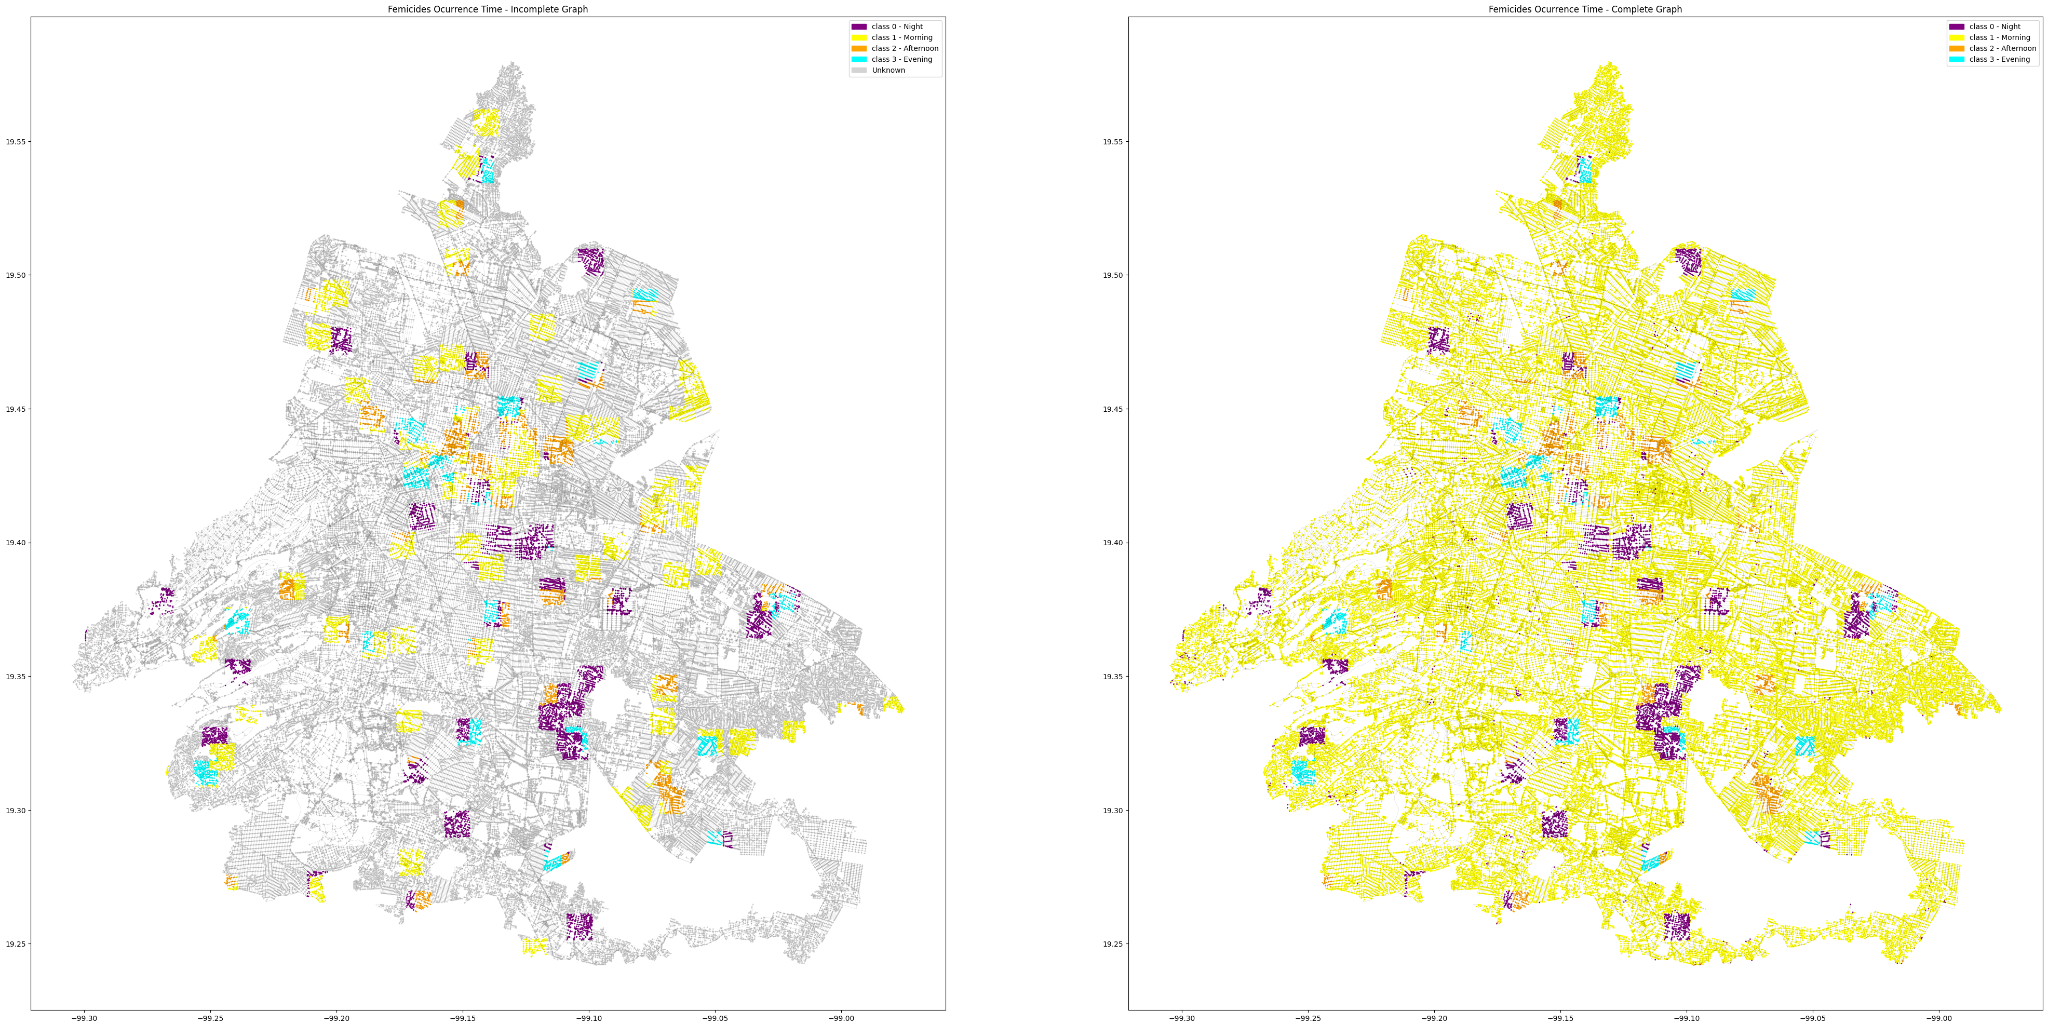
This other two maps comparing the initial and completed graphs of femicide occurrence times in Mexico City using K-Means Clustering with One-Hot Encoding, along with class bounding boxes.
The left map shows an initial, incomplete graph of femicide occurrences. It uses K-Means Clustering with One-Hot Encoding and class bounding boxes to highlight areas with multiple instances. The map features sparse data points with fewer femicide locations and occurrence times represented. The color coding indicates different times of the day: purple for night (0h – 6h), yellow for morning (6h – 12h), cyan for afternoon (12h – 18h), and orange for evening (18h – 24h).
The right map presents a more comprehensive graph of femicide occurrences. This map includes significantly more data points, providing a fuller picture of femicide distribution and times. It also uses K-Means Clustering with One-Hot Encoding and class bounding boxes to enhance the visualization. The same color coding is used: purple for night, yellow for morning, cyan for afternoon, and orange for evening. The bounding boxes highlight areas with multiple instances, increasing the number of represented instances.
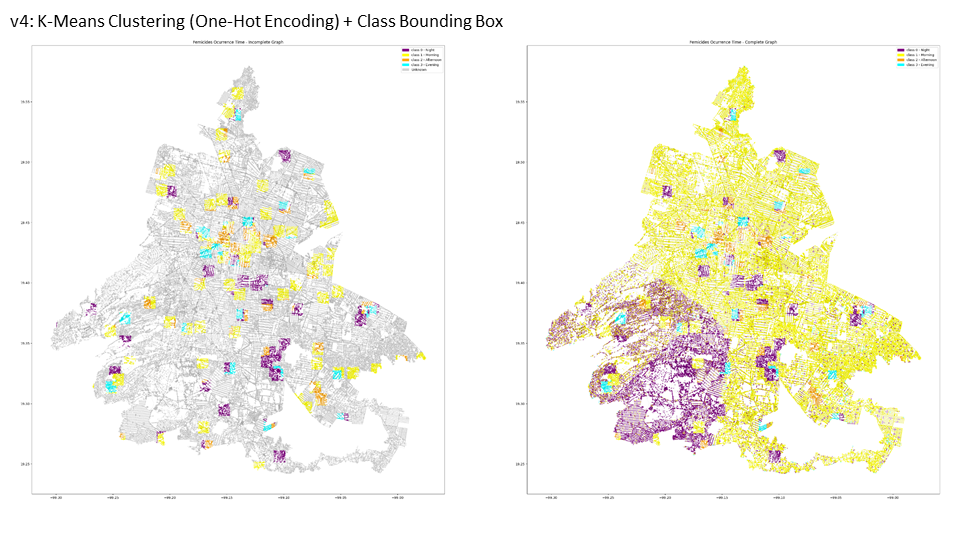
v4: Class Bounding Box + K-Means Clustering (One-Hot Encoding)
This methodology combines class bounding boxes with K-Means Clustering using One-Hot Encoding to analyze femicide occurrences in Mexico City. The approach enhances the visualization of both spatial and temporal patterns of femicide incidents, providing a comprehensive understanding of their distribution.
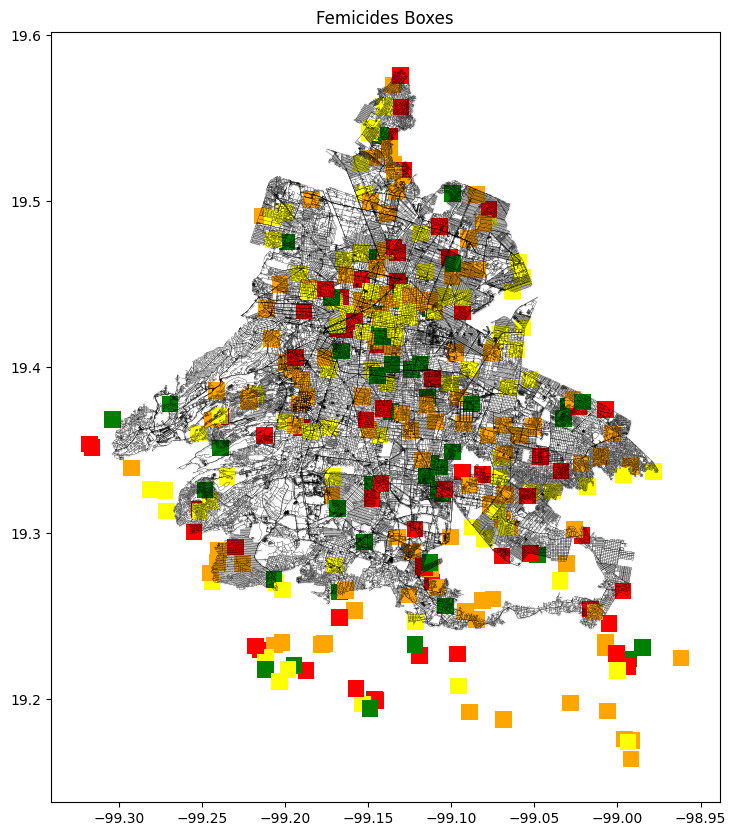
The left map, titled “Femicides Boxes,” represents femicide occurrences using bounding boxes. These boxes increase the number of instances depicted, highlighting areas with multiple femicide cases. The color coding on this map indicates different times of the day: red for night (0h – 6h), yellow for morning (6h – 12h), green for afternoon (12h – 18h), and orange for evening (18h – 24h). This representation helps in identifying temporal patterns in the data.
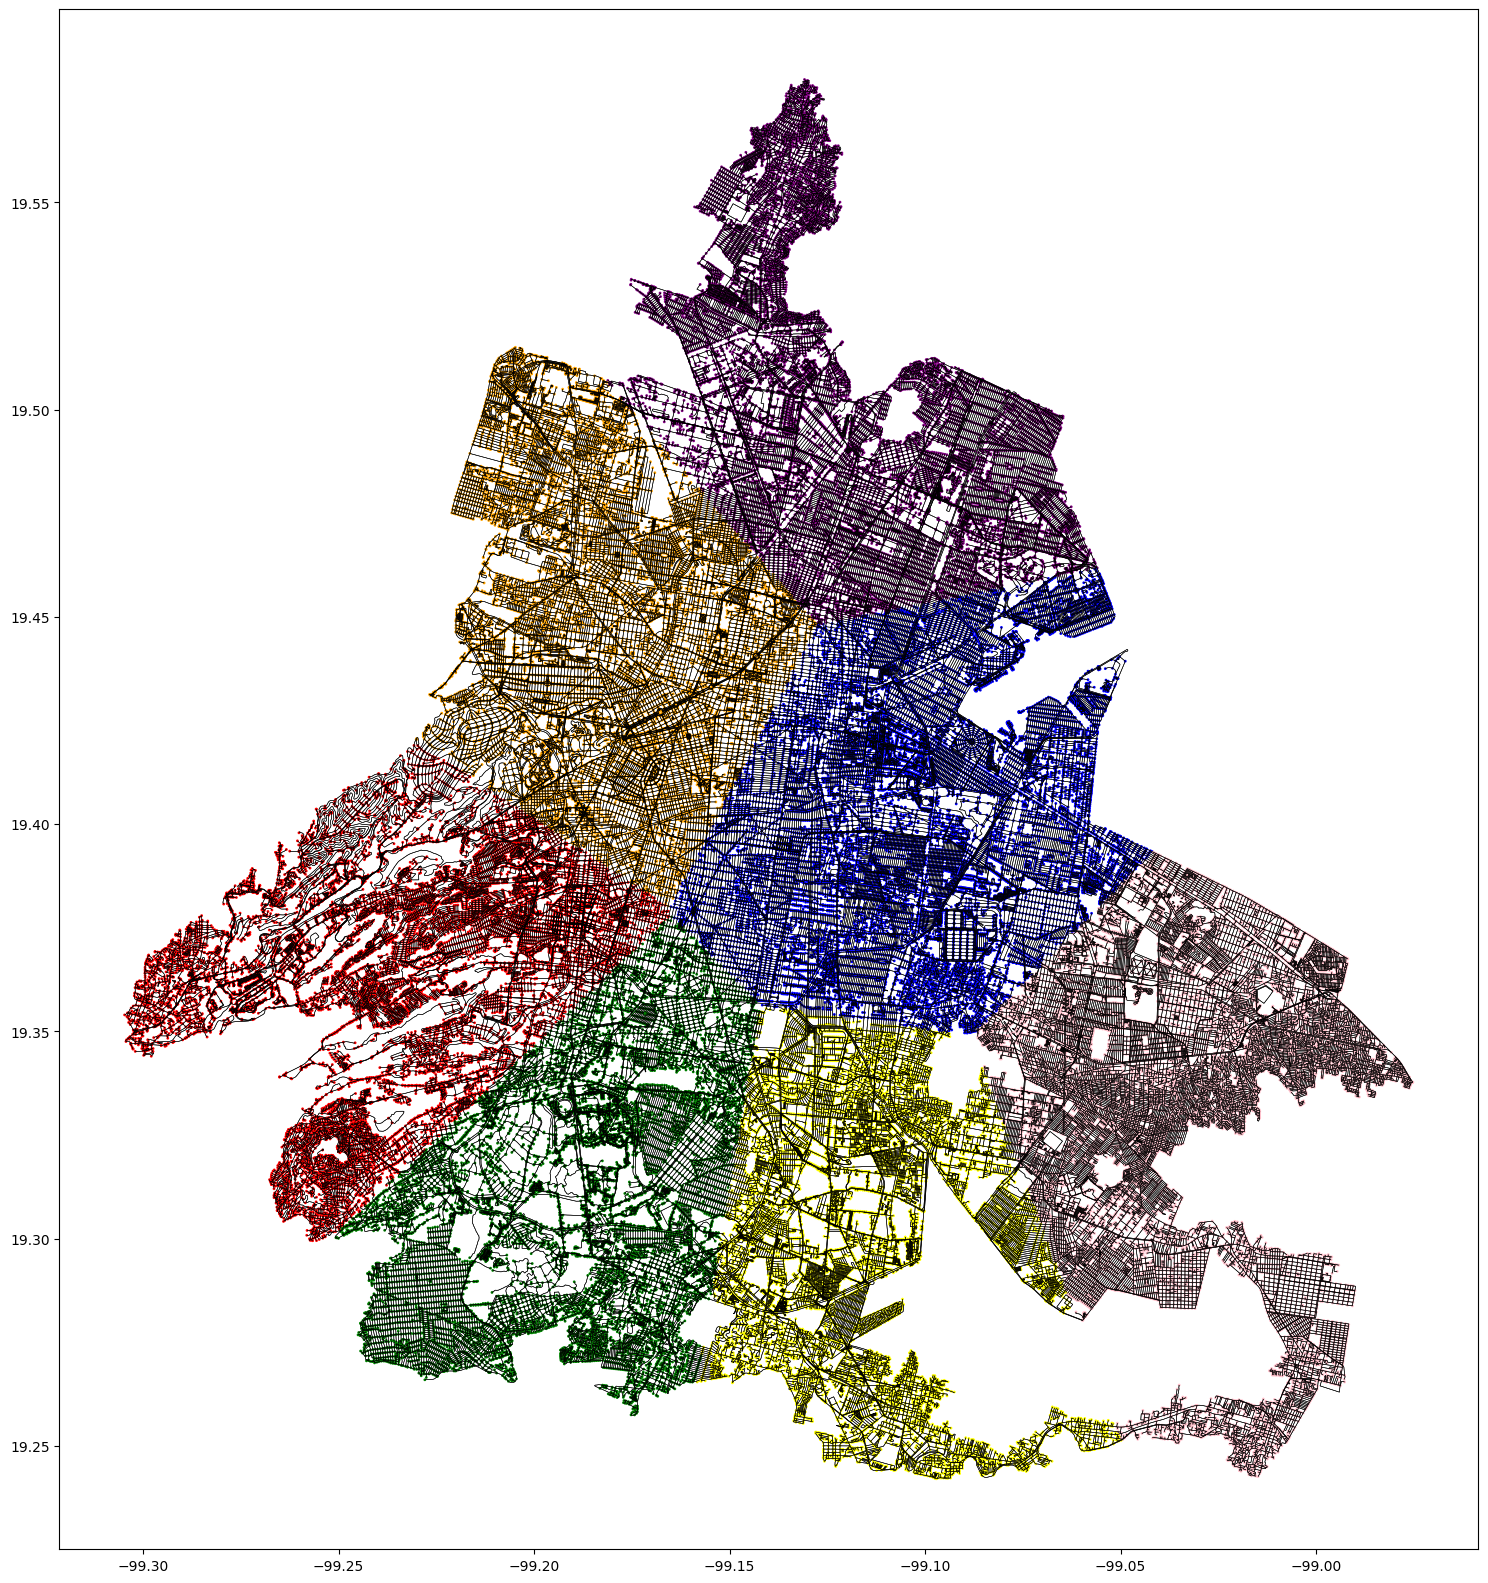
The right map illustrates the results of K-Means Clustering with One-Hot Encoding, dividing the city into distinct clusters based on femicide occurrences. Each cluster is represented by a different color, indicating regions with similar femicide patterns. This clustering technique provides valuable insights into the spatial trends of femicide incidents.
Key insights from this combined methodology include:
- Spatial Distribution: Both maps show the widespread distribution of femicide occurrences across Mexico City.
- Clustering: The right map effectively uses K-Means Clustering to identify distinct regions with similar patterns of femicide occurrences, providing insights into spatial trends.
- Bounding Boxes: The left map uses bounding boxes to highlight areas with multiple femicide occurrences, making the data clearer and more comprehensive.
- Temporal Distribution: The bounding boxes on the left map indicate the times of day when femicides occur, providing a temporal dimension to the analysis
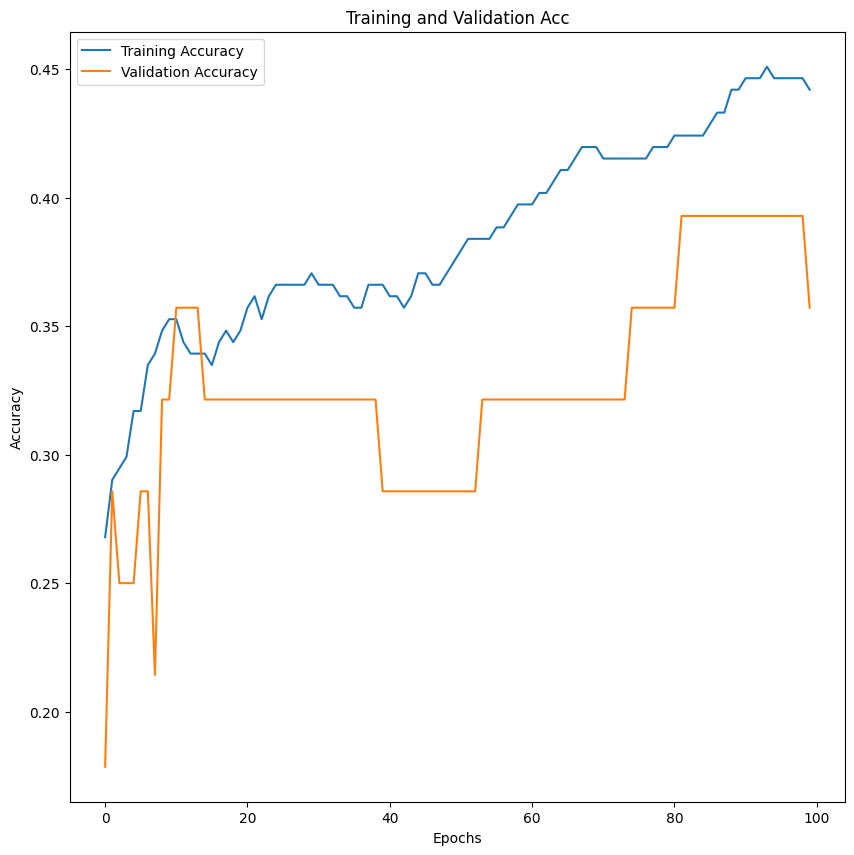
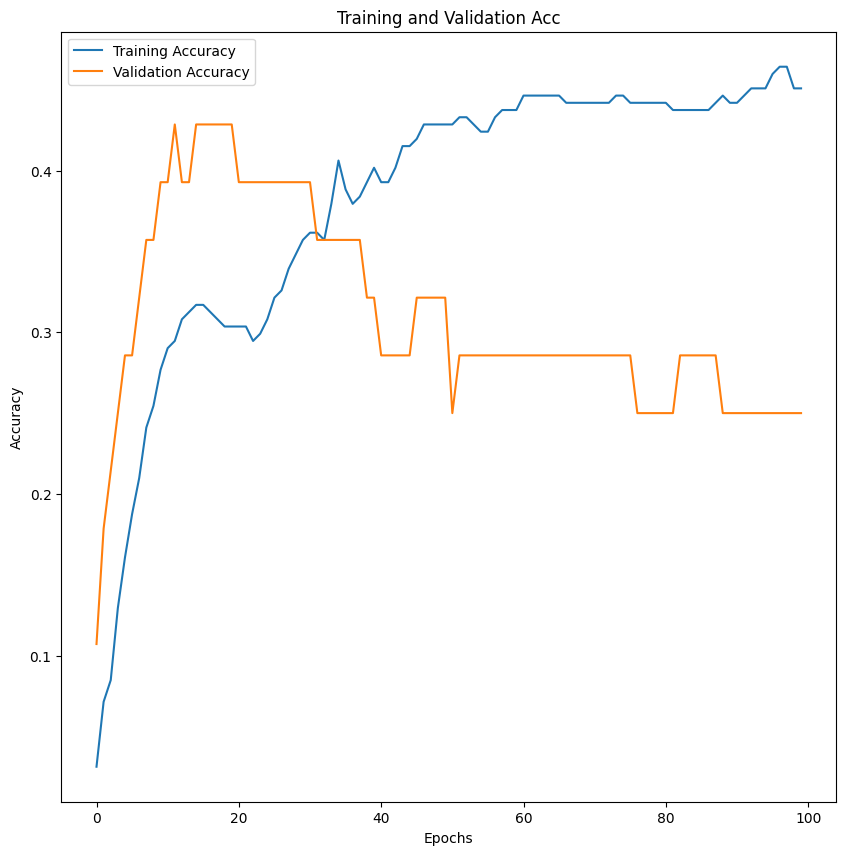
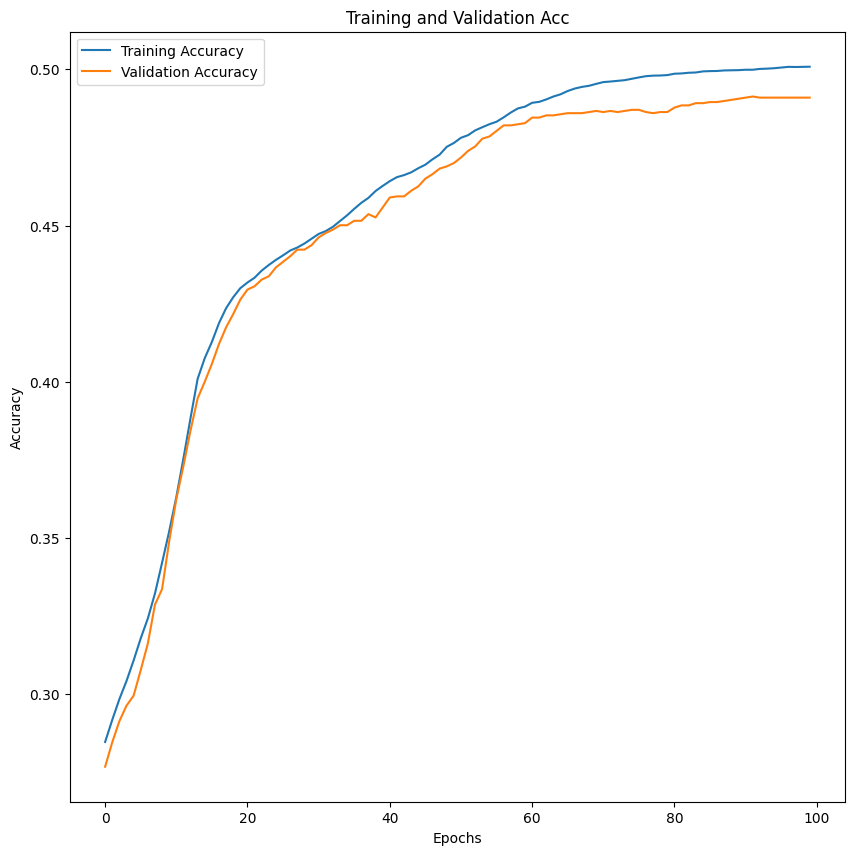
raining and Validation Accuracy Plot:
- The training and validation accuracy curves show that both accuracies increase and stabilize over epochs, indicating the model is learning and not overfitting significantly. However, the gap between training and validation accuracy suggests there might still be room for improvement in generalization.
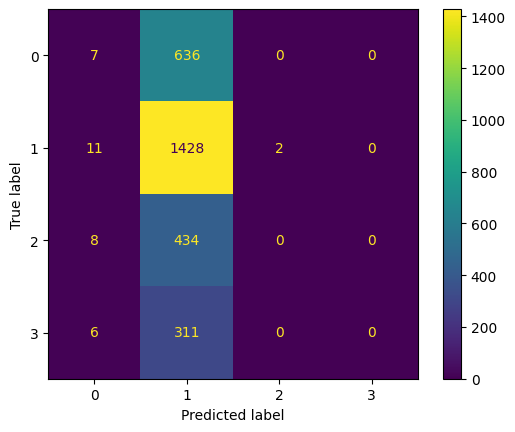
Key Observations:
- Best Performance: The model performs best for Class 1 with the highest correct predictions.
- Common Misclassification: The model frequently misclassifies other classes as Class 1.
- Improvement Areas: Focus on reducing misclassifications of Classes 0, 2, and 3 to improve overall accuracy.
The left map shows an initial, incomplete graph of femicide occurrences. It uses K-Means Clustering with One-Hot Encoding and class bounding boxes to highlight areas with multiple instances. The color coding indicates different times of the day: purple for night (0h – 6h), yellow for morning (6h – 12h), cyan for afternoon (12h – 18h), and orange for evening (18h – 24h). Despite being incomplete, this map shows the spatial distribution and temporal occurrence of femicides in various parts of the city.
Further Development
- Increase data – Implement bounding box method with poverty indexes and help centers).
In case of the Bounding box method in crime reports, is unfeasible doe the amount of data points it needs to process (403,928), for this point to nearest node method should be best.
Having this combination of methods should give us a better framework for upcoming analysis.
- Gathering data from other sources, for the continuation of this project in our thesis work we manage to collaborate with a local urbanism firm (Oficina de Resiliencia Urbana- ORU) in other to be more rigorous with the data that will be collected and analyzed. This not just to overcome the lack of efficient information that available but to have a deeper understanding of the situation regardless of just numerical by social data and be able to have a much better judgment when we analyze the results.
