Graph. Taipei is a Graph Neural Networks (GNN) based platform that allows users to exam the walkability of the city.
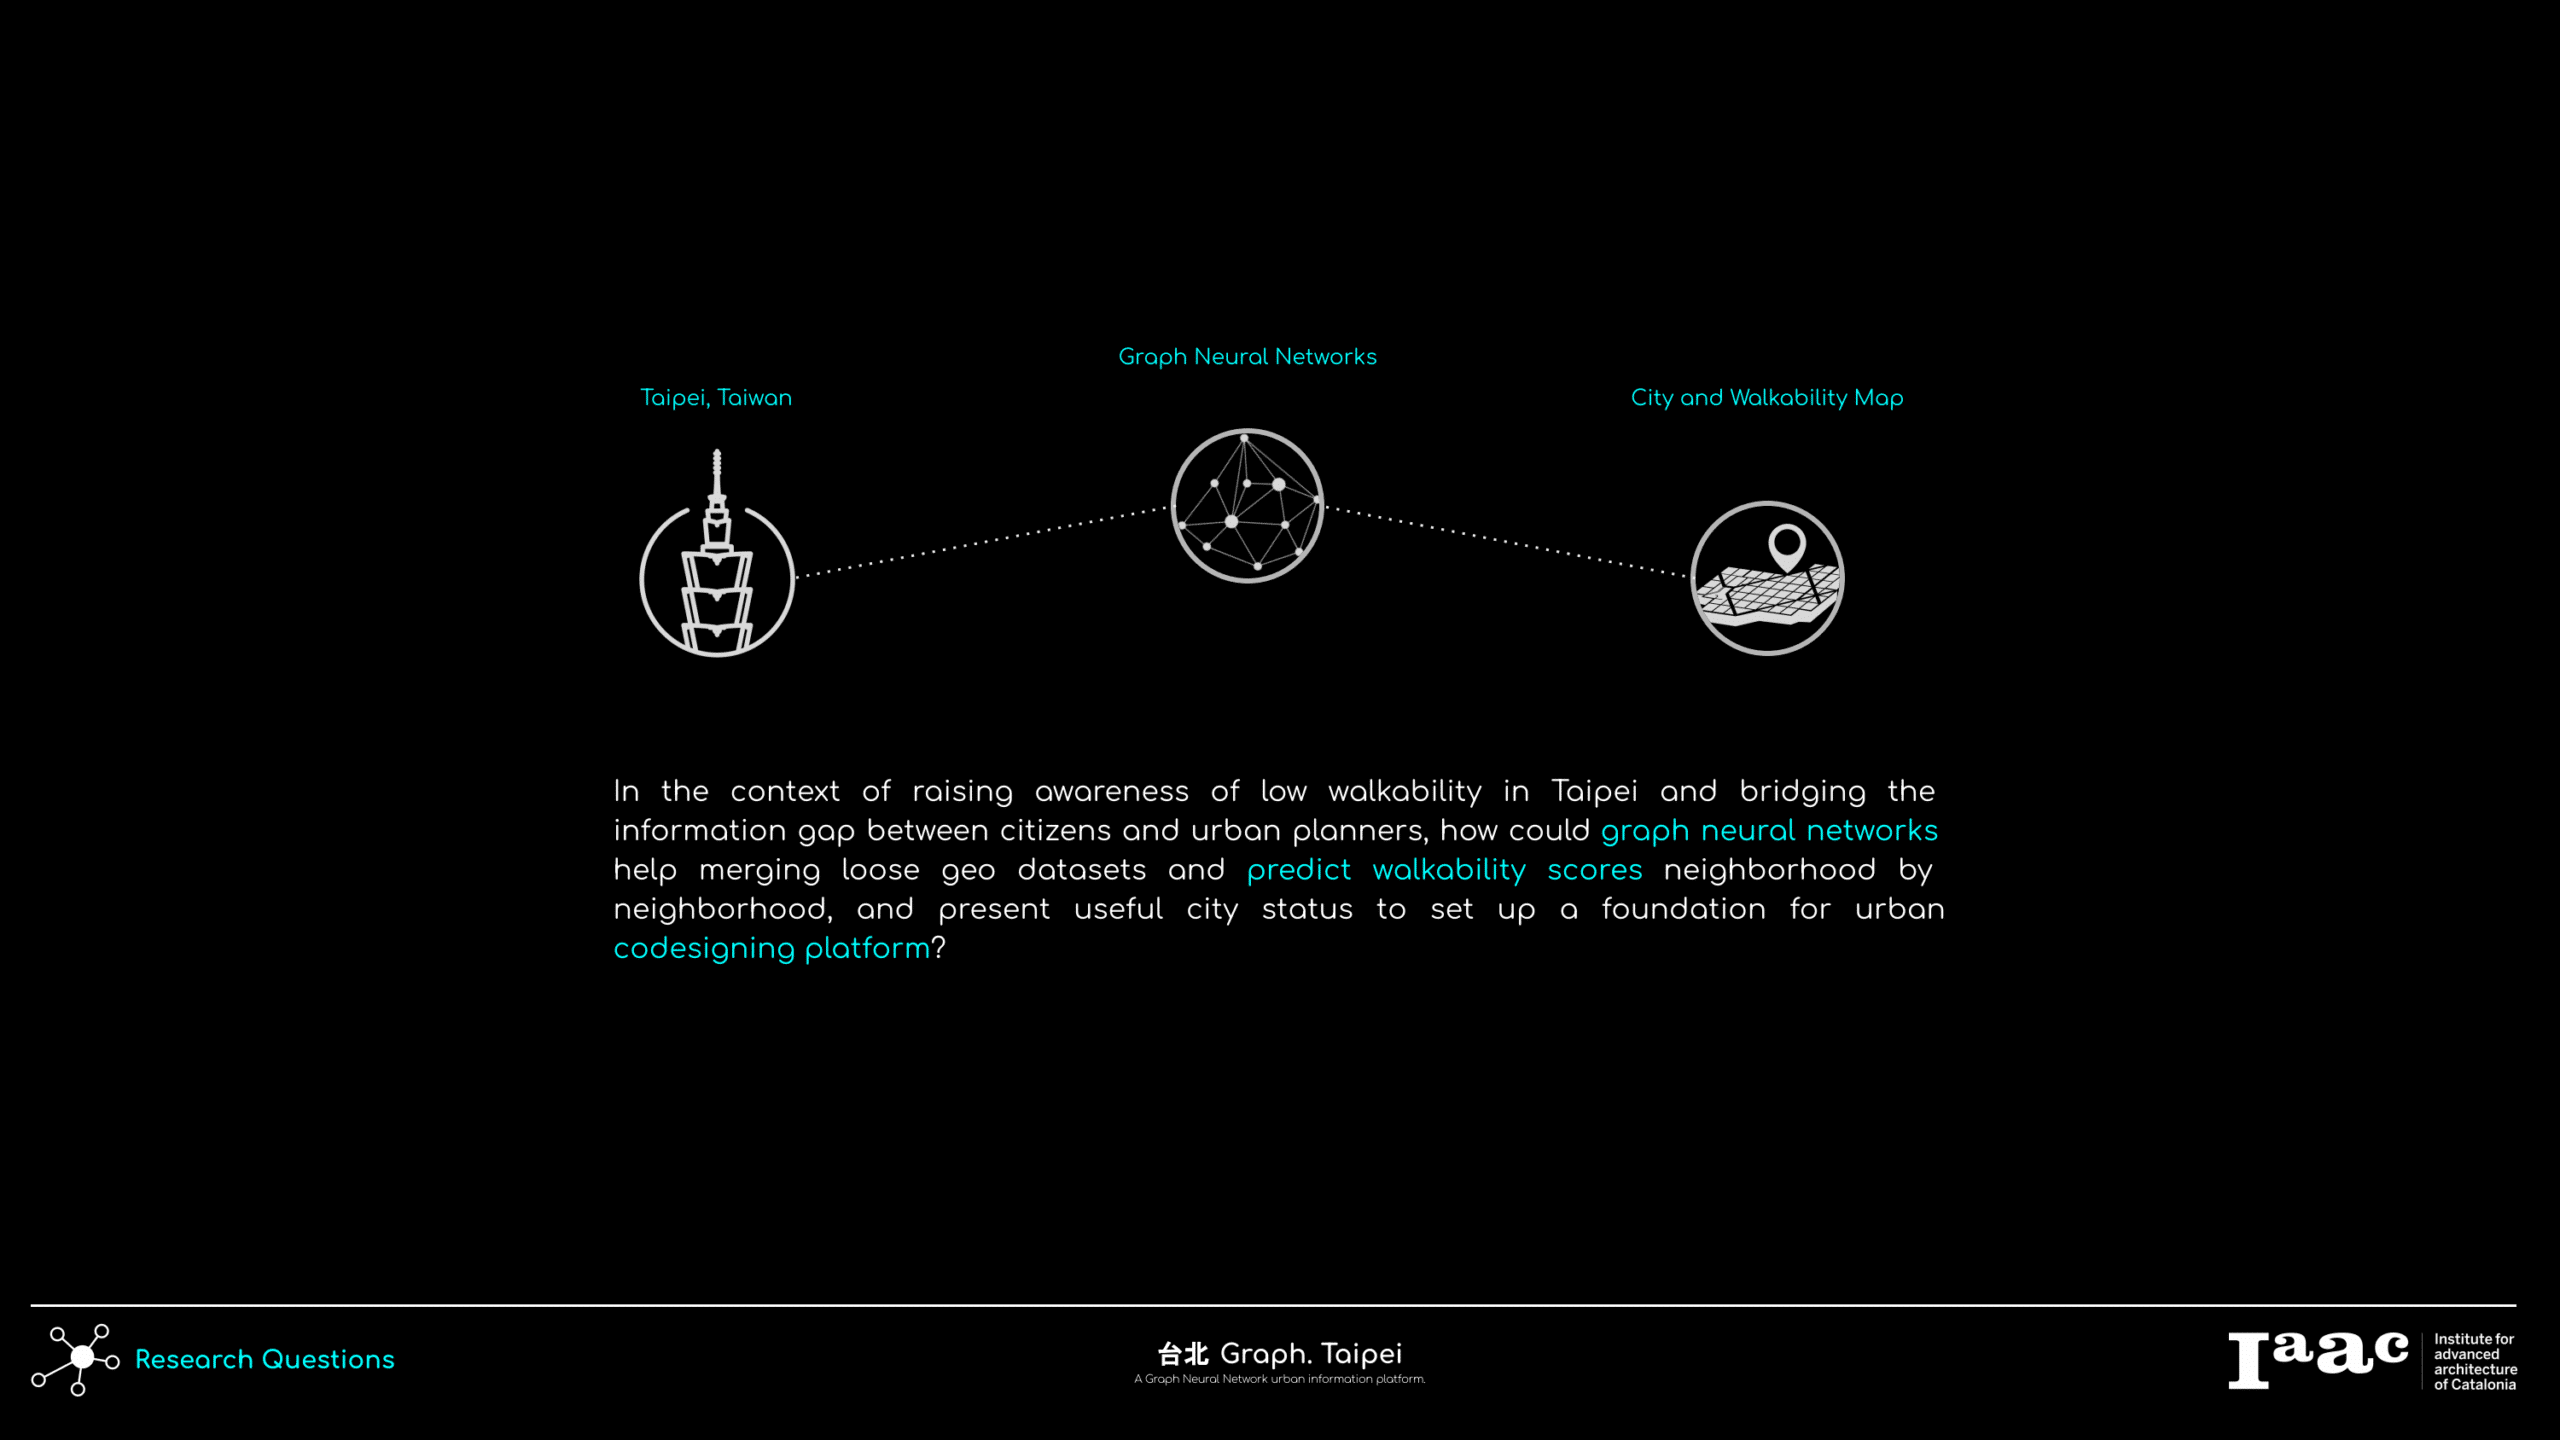
Research Question
As the capital of Taiwan, Taipei holds around 2 million residents and is considered as a developed modern city. However, poor street design and car-centric city layout, it is also known as a “Lining Hell” 行人地獄 for pedestrian. In order to tackle such issue, and testing whether the urban planning decision making has a direct affect on the walking daily basis, this research aims to utilize GNN to link in multiple crucial geo data and construct an attention based machine learning model to help analyze the urban topology / walkability relationship.
Data Process
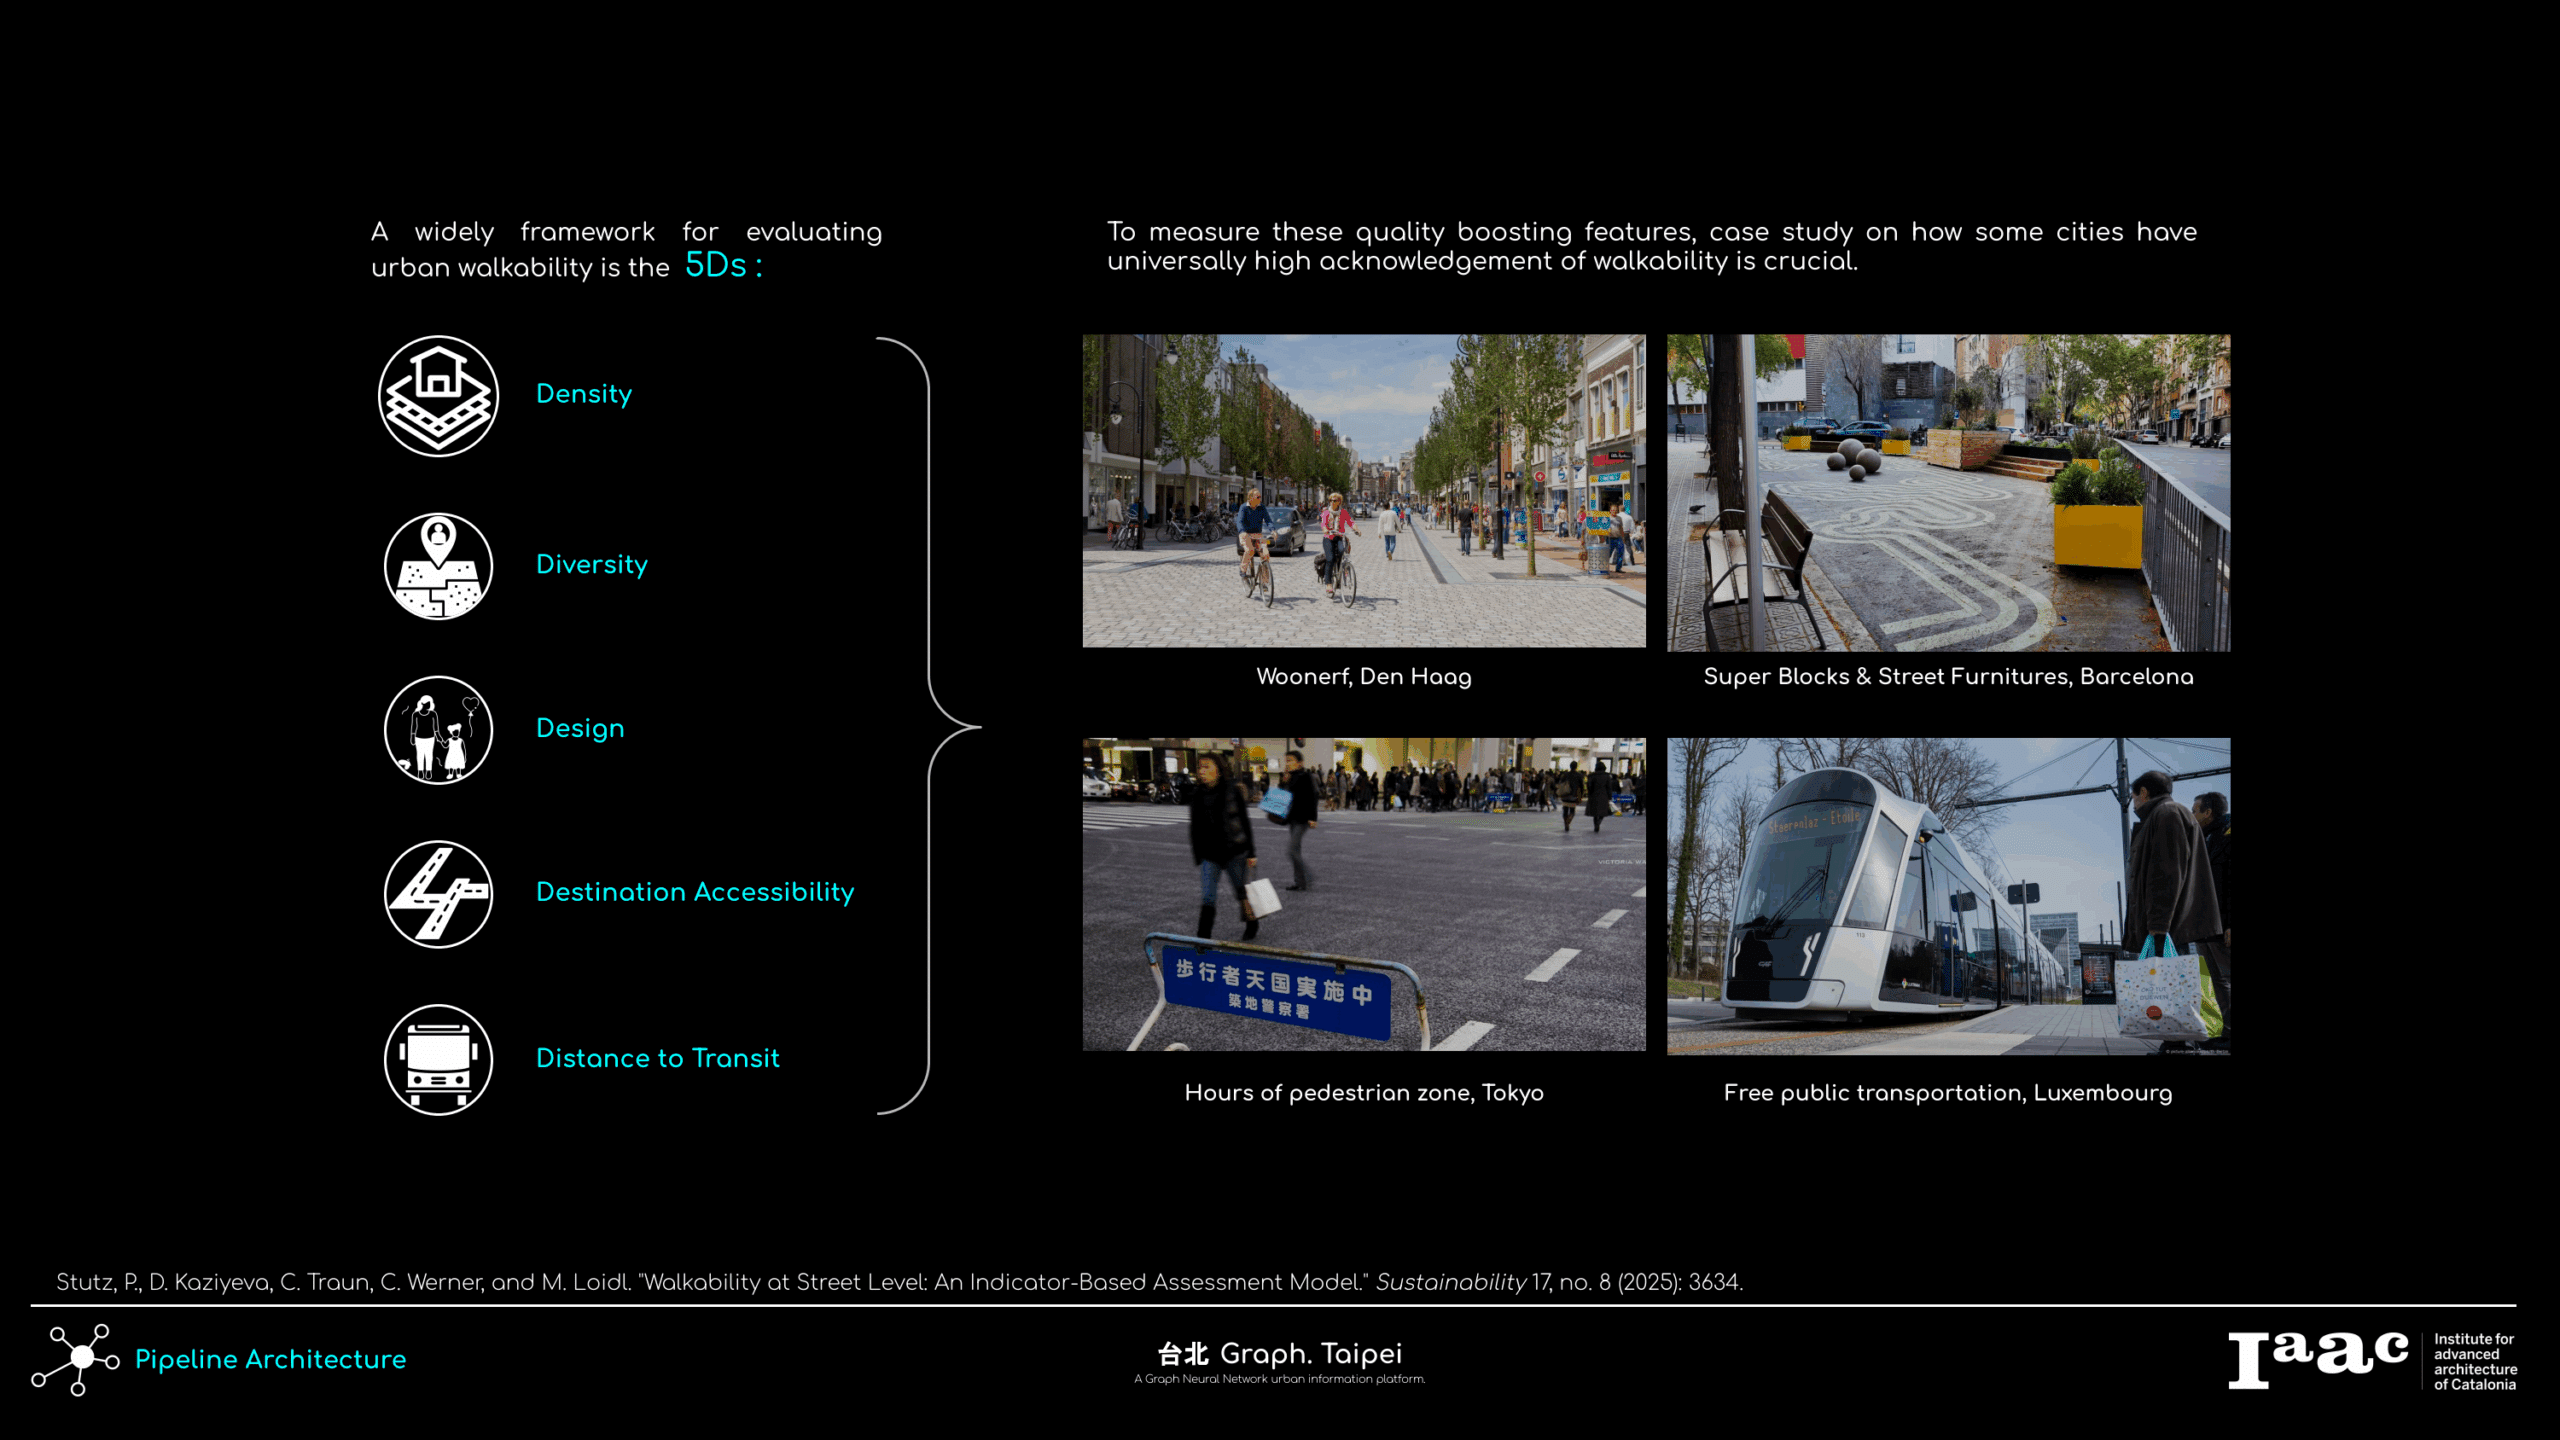
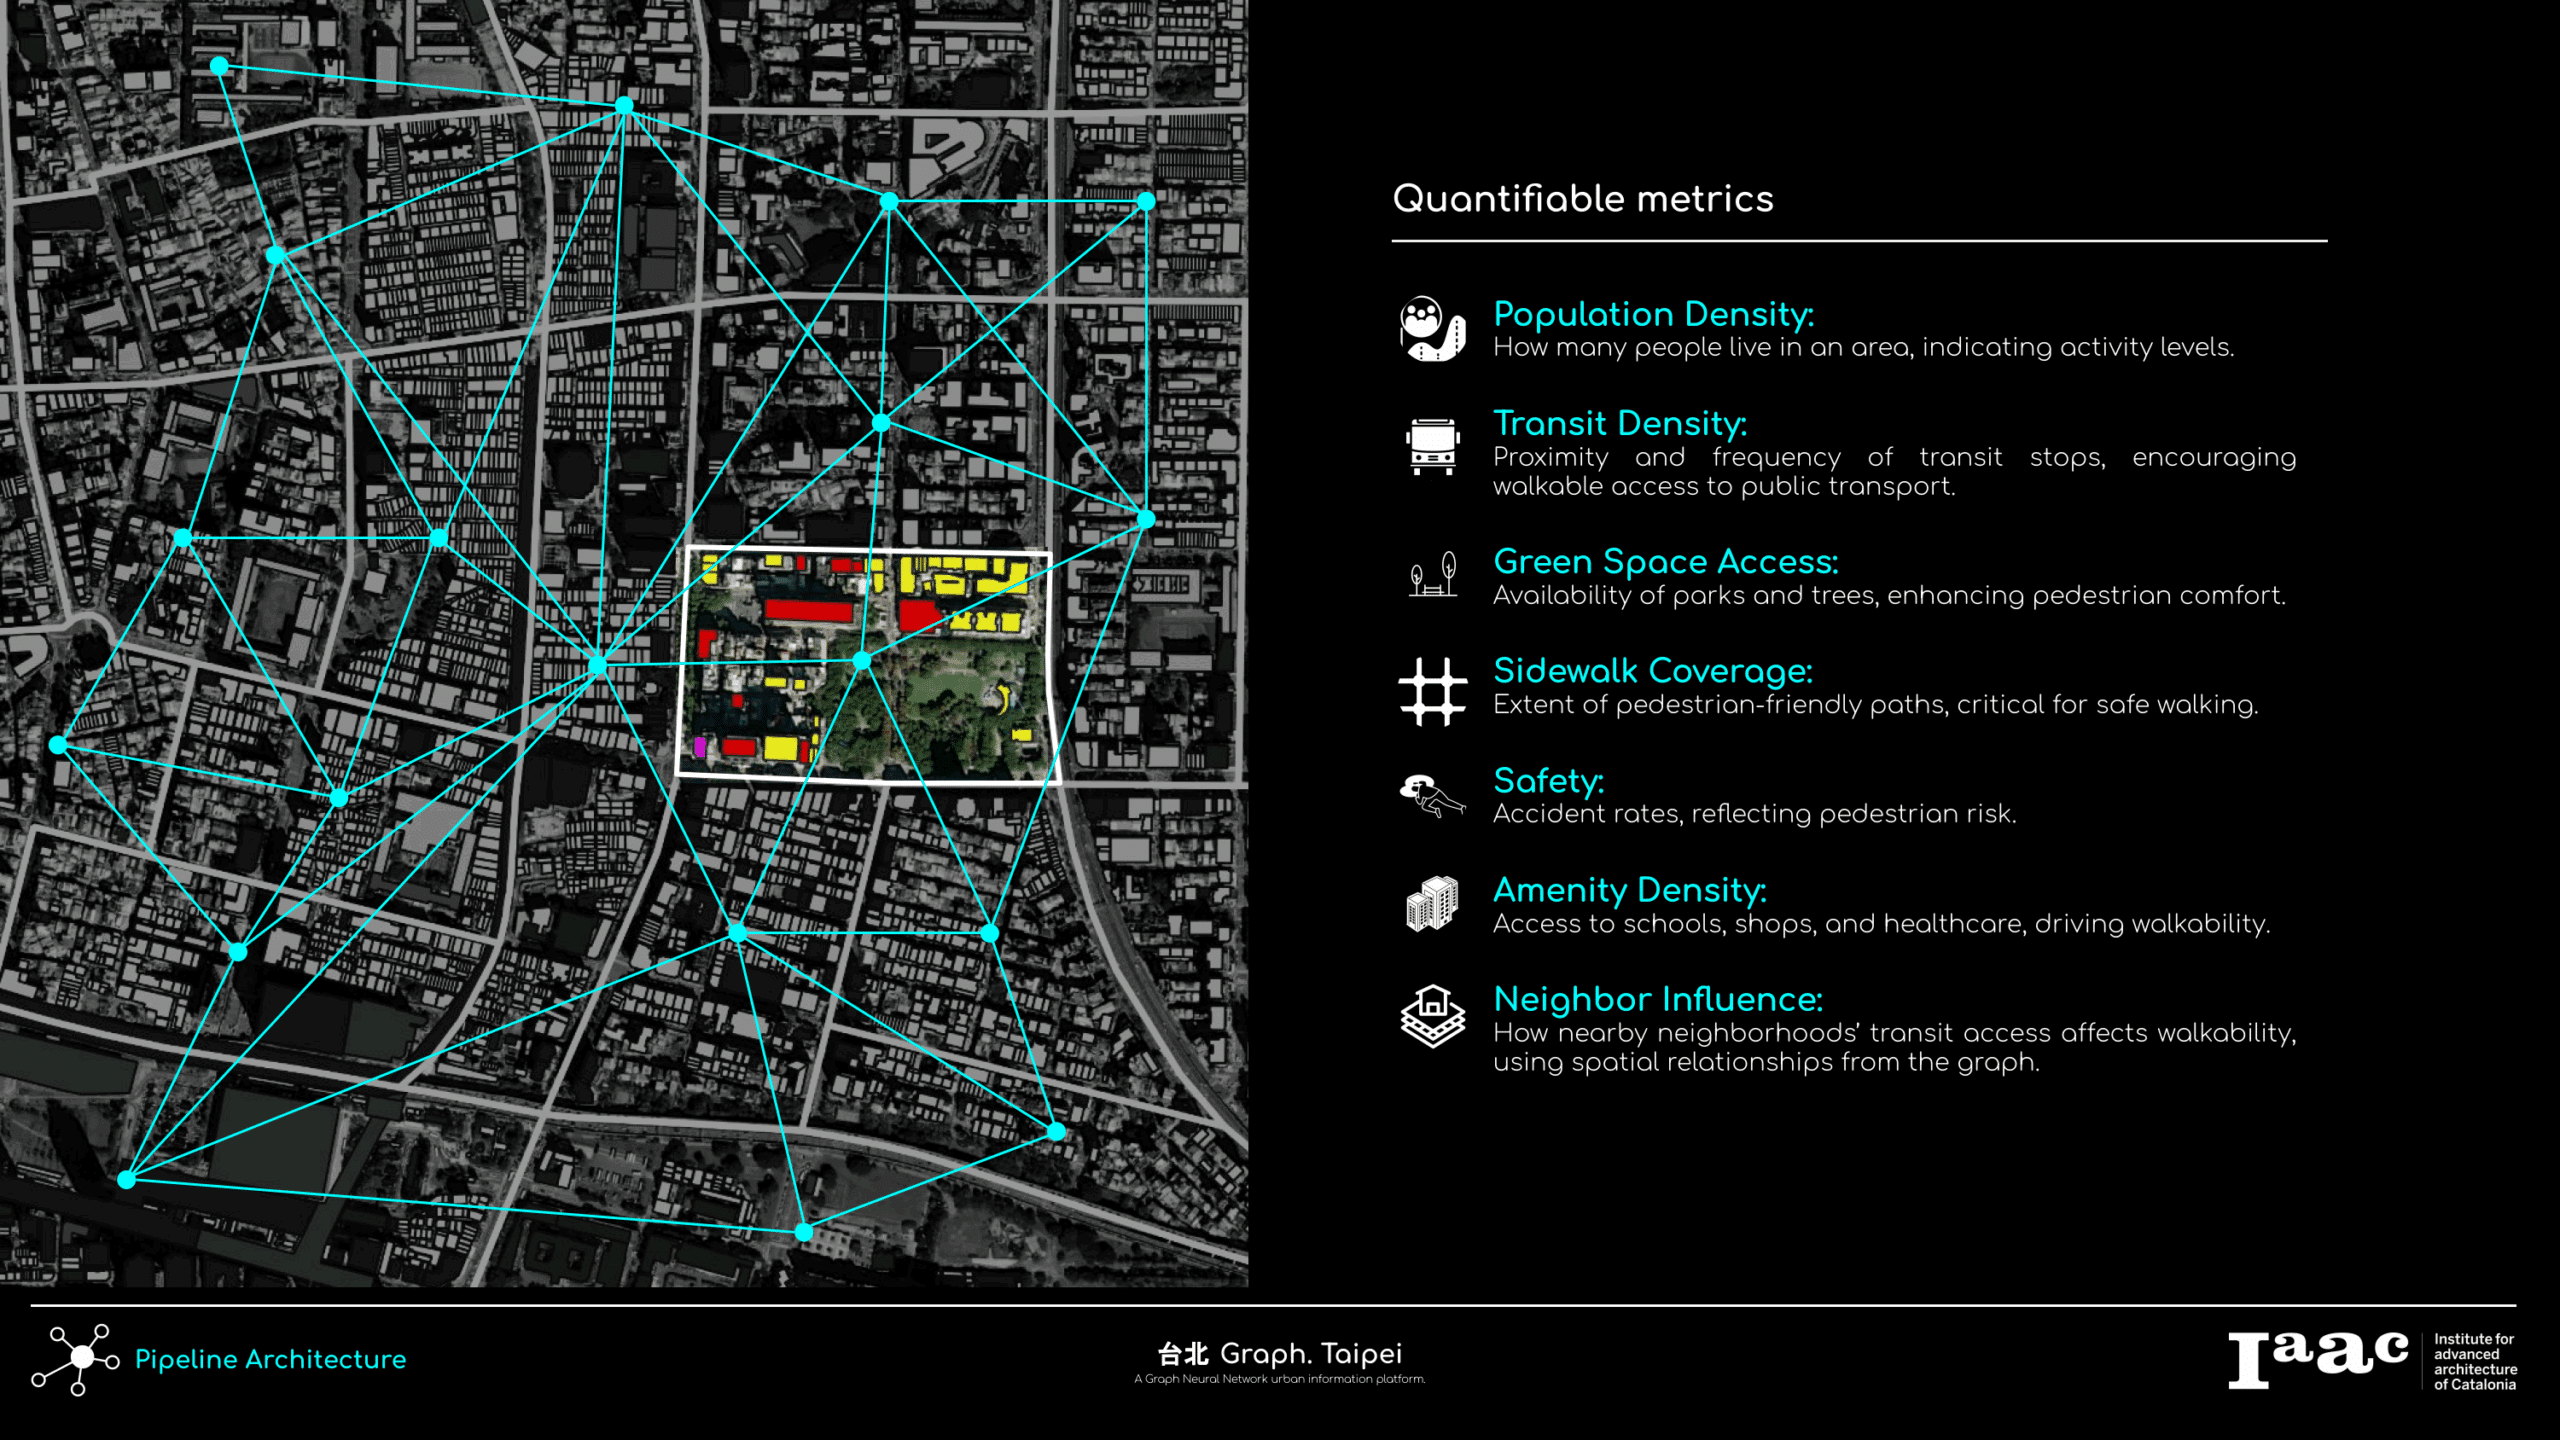
To improve walkability we must define it , and by taking case studies, we can identify how some city are genuinely “safer” by design. Human are born with two legs, and several advanced city have treated higher walkability as one of their key aspects when determine the city design. Hence we may use the 5D features to set up the walkability criteria.
In order to construct a meaningful map system, which includes buildings, street, open spaces, and safety data. We looked for the open sources platform and expect the dynamic API update.
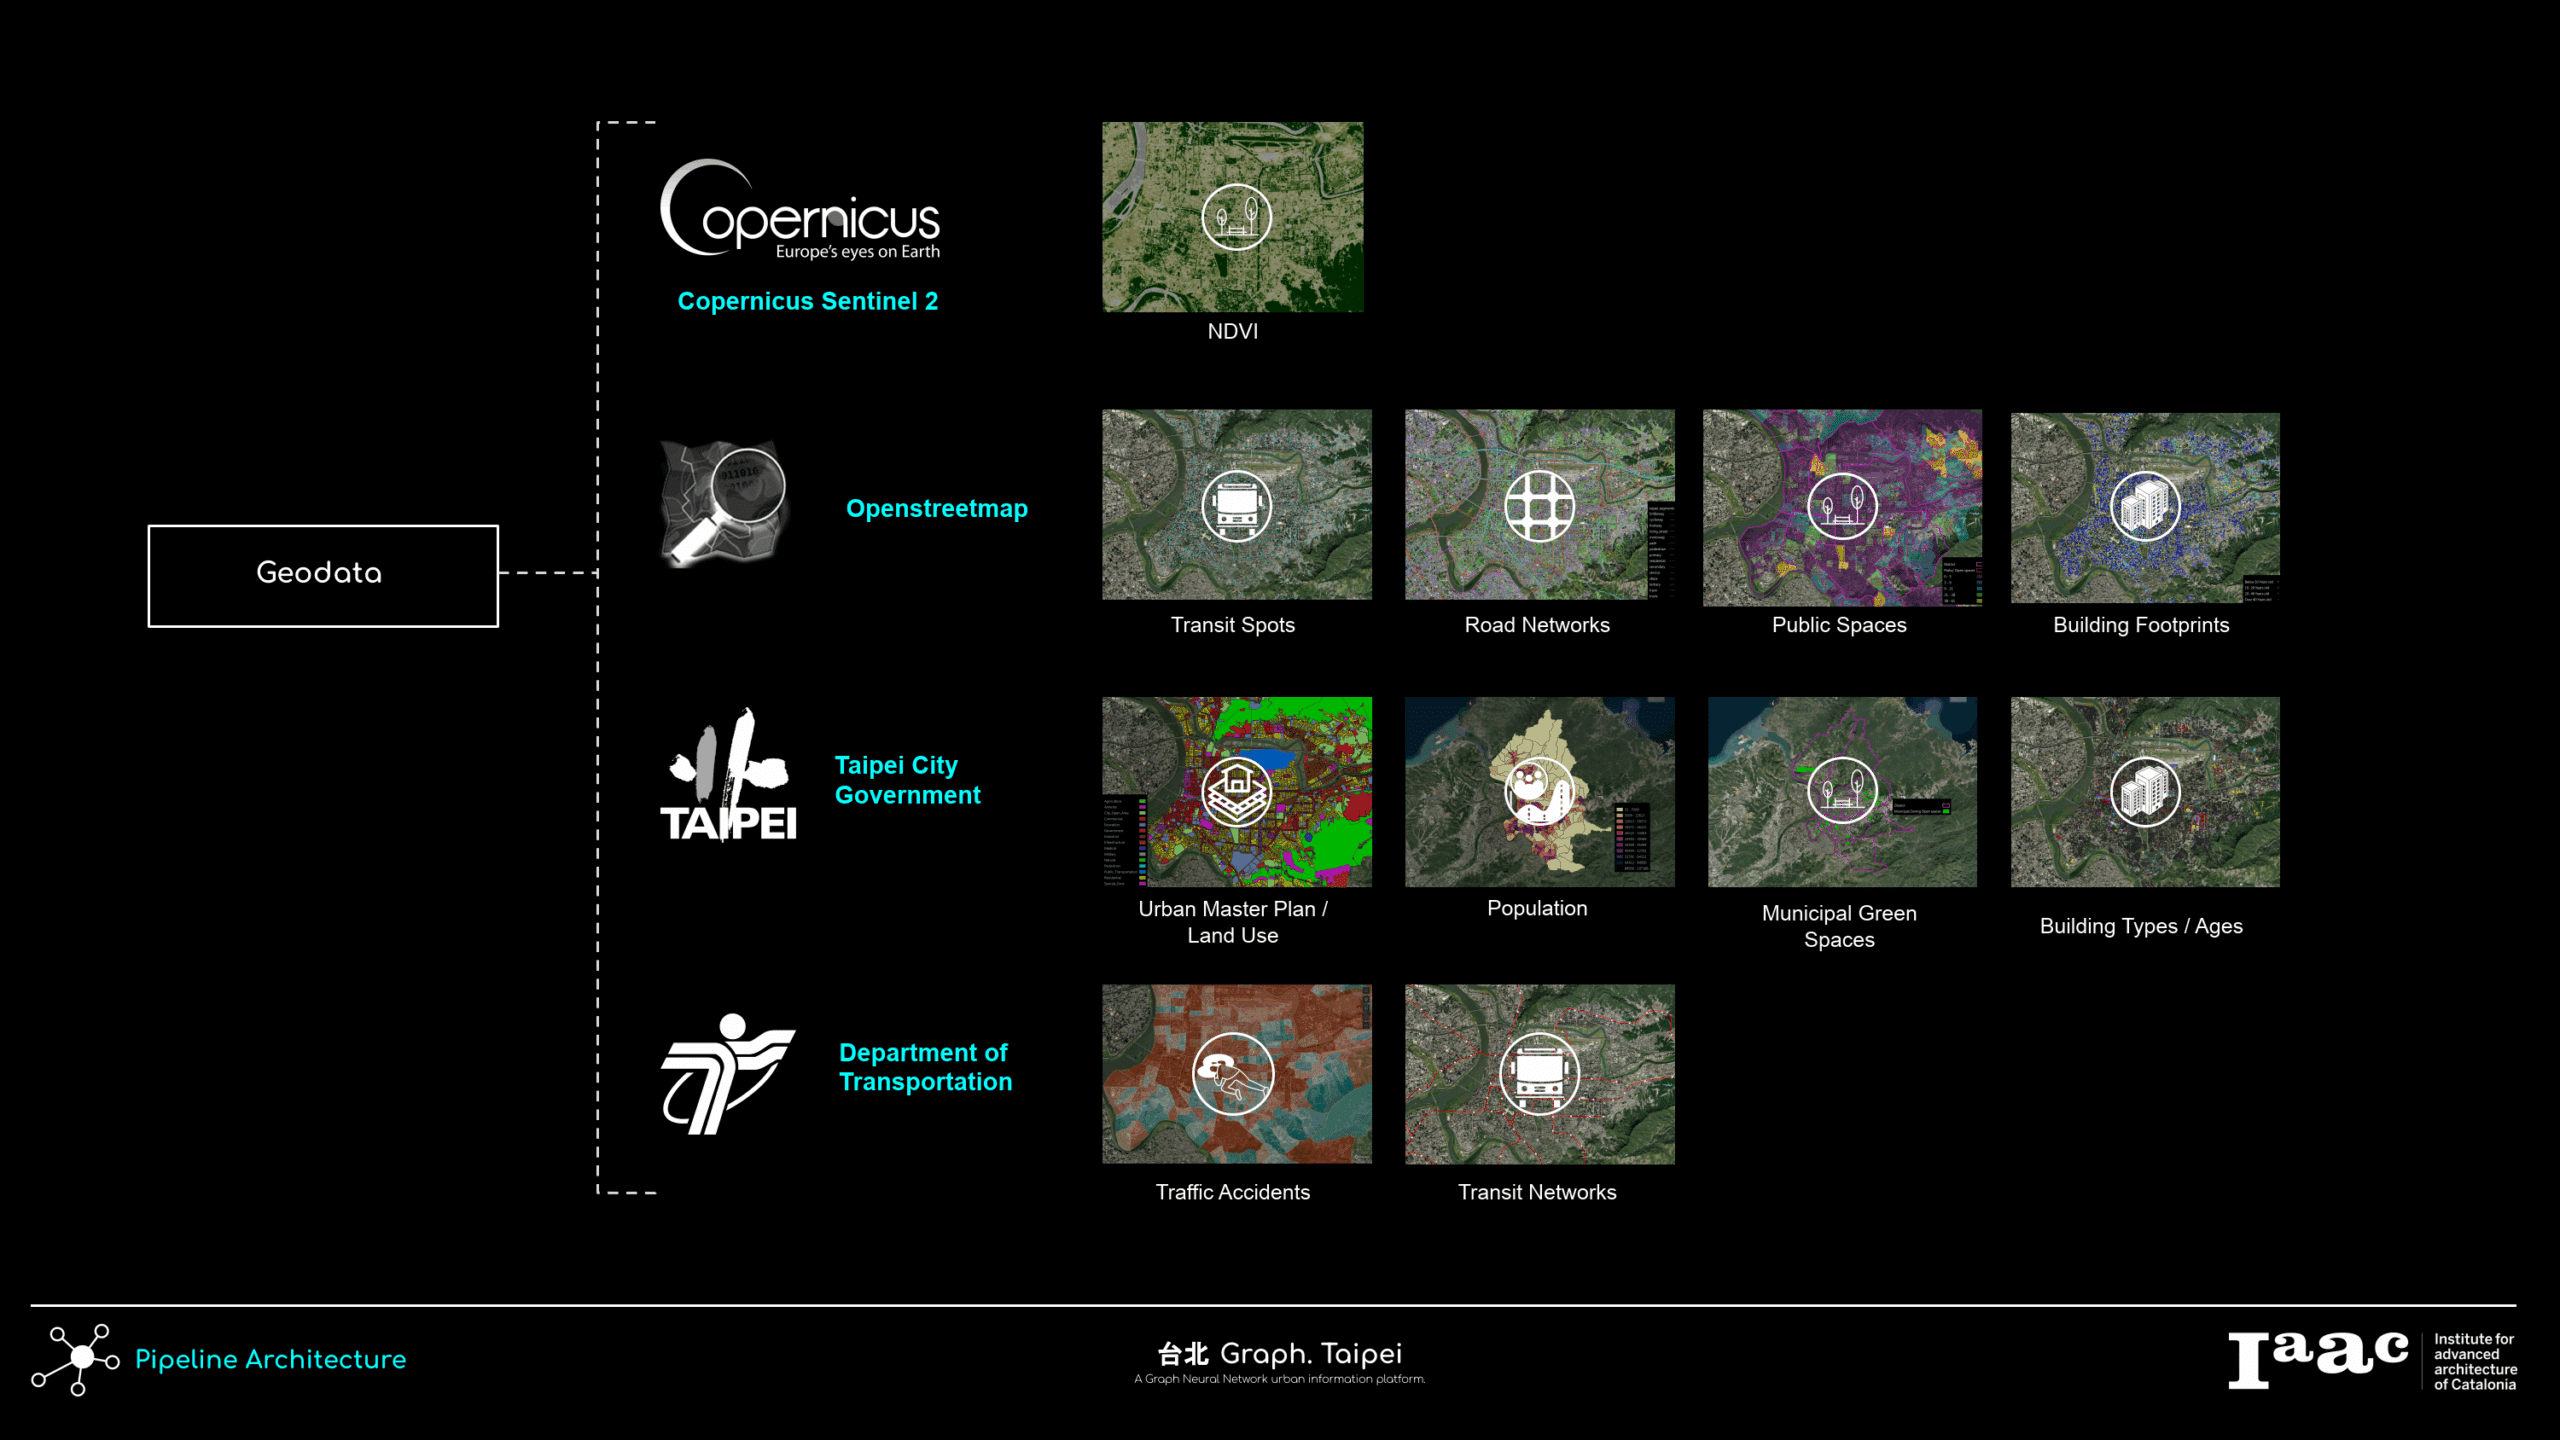
By utilizing the GNN data feature, these loose datasets can be normalized and connected by their distances and spatial relationships, these processed data are then divided by every neighborhoods boundaries, and stored as neighborhood nodes feature (gdf).
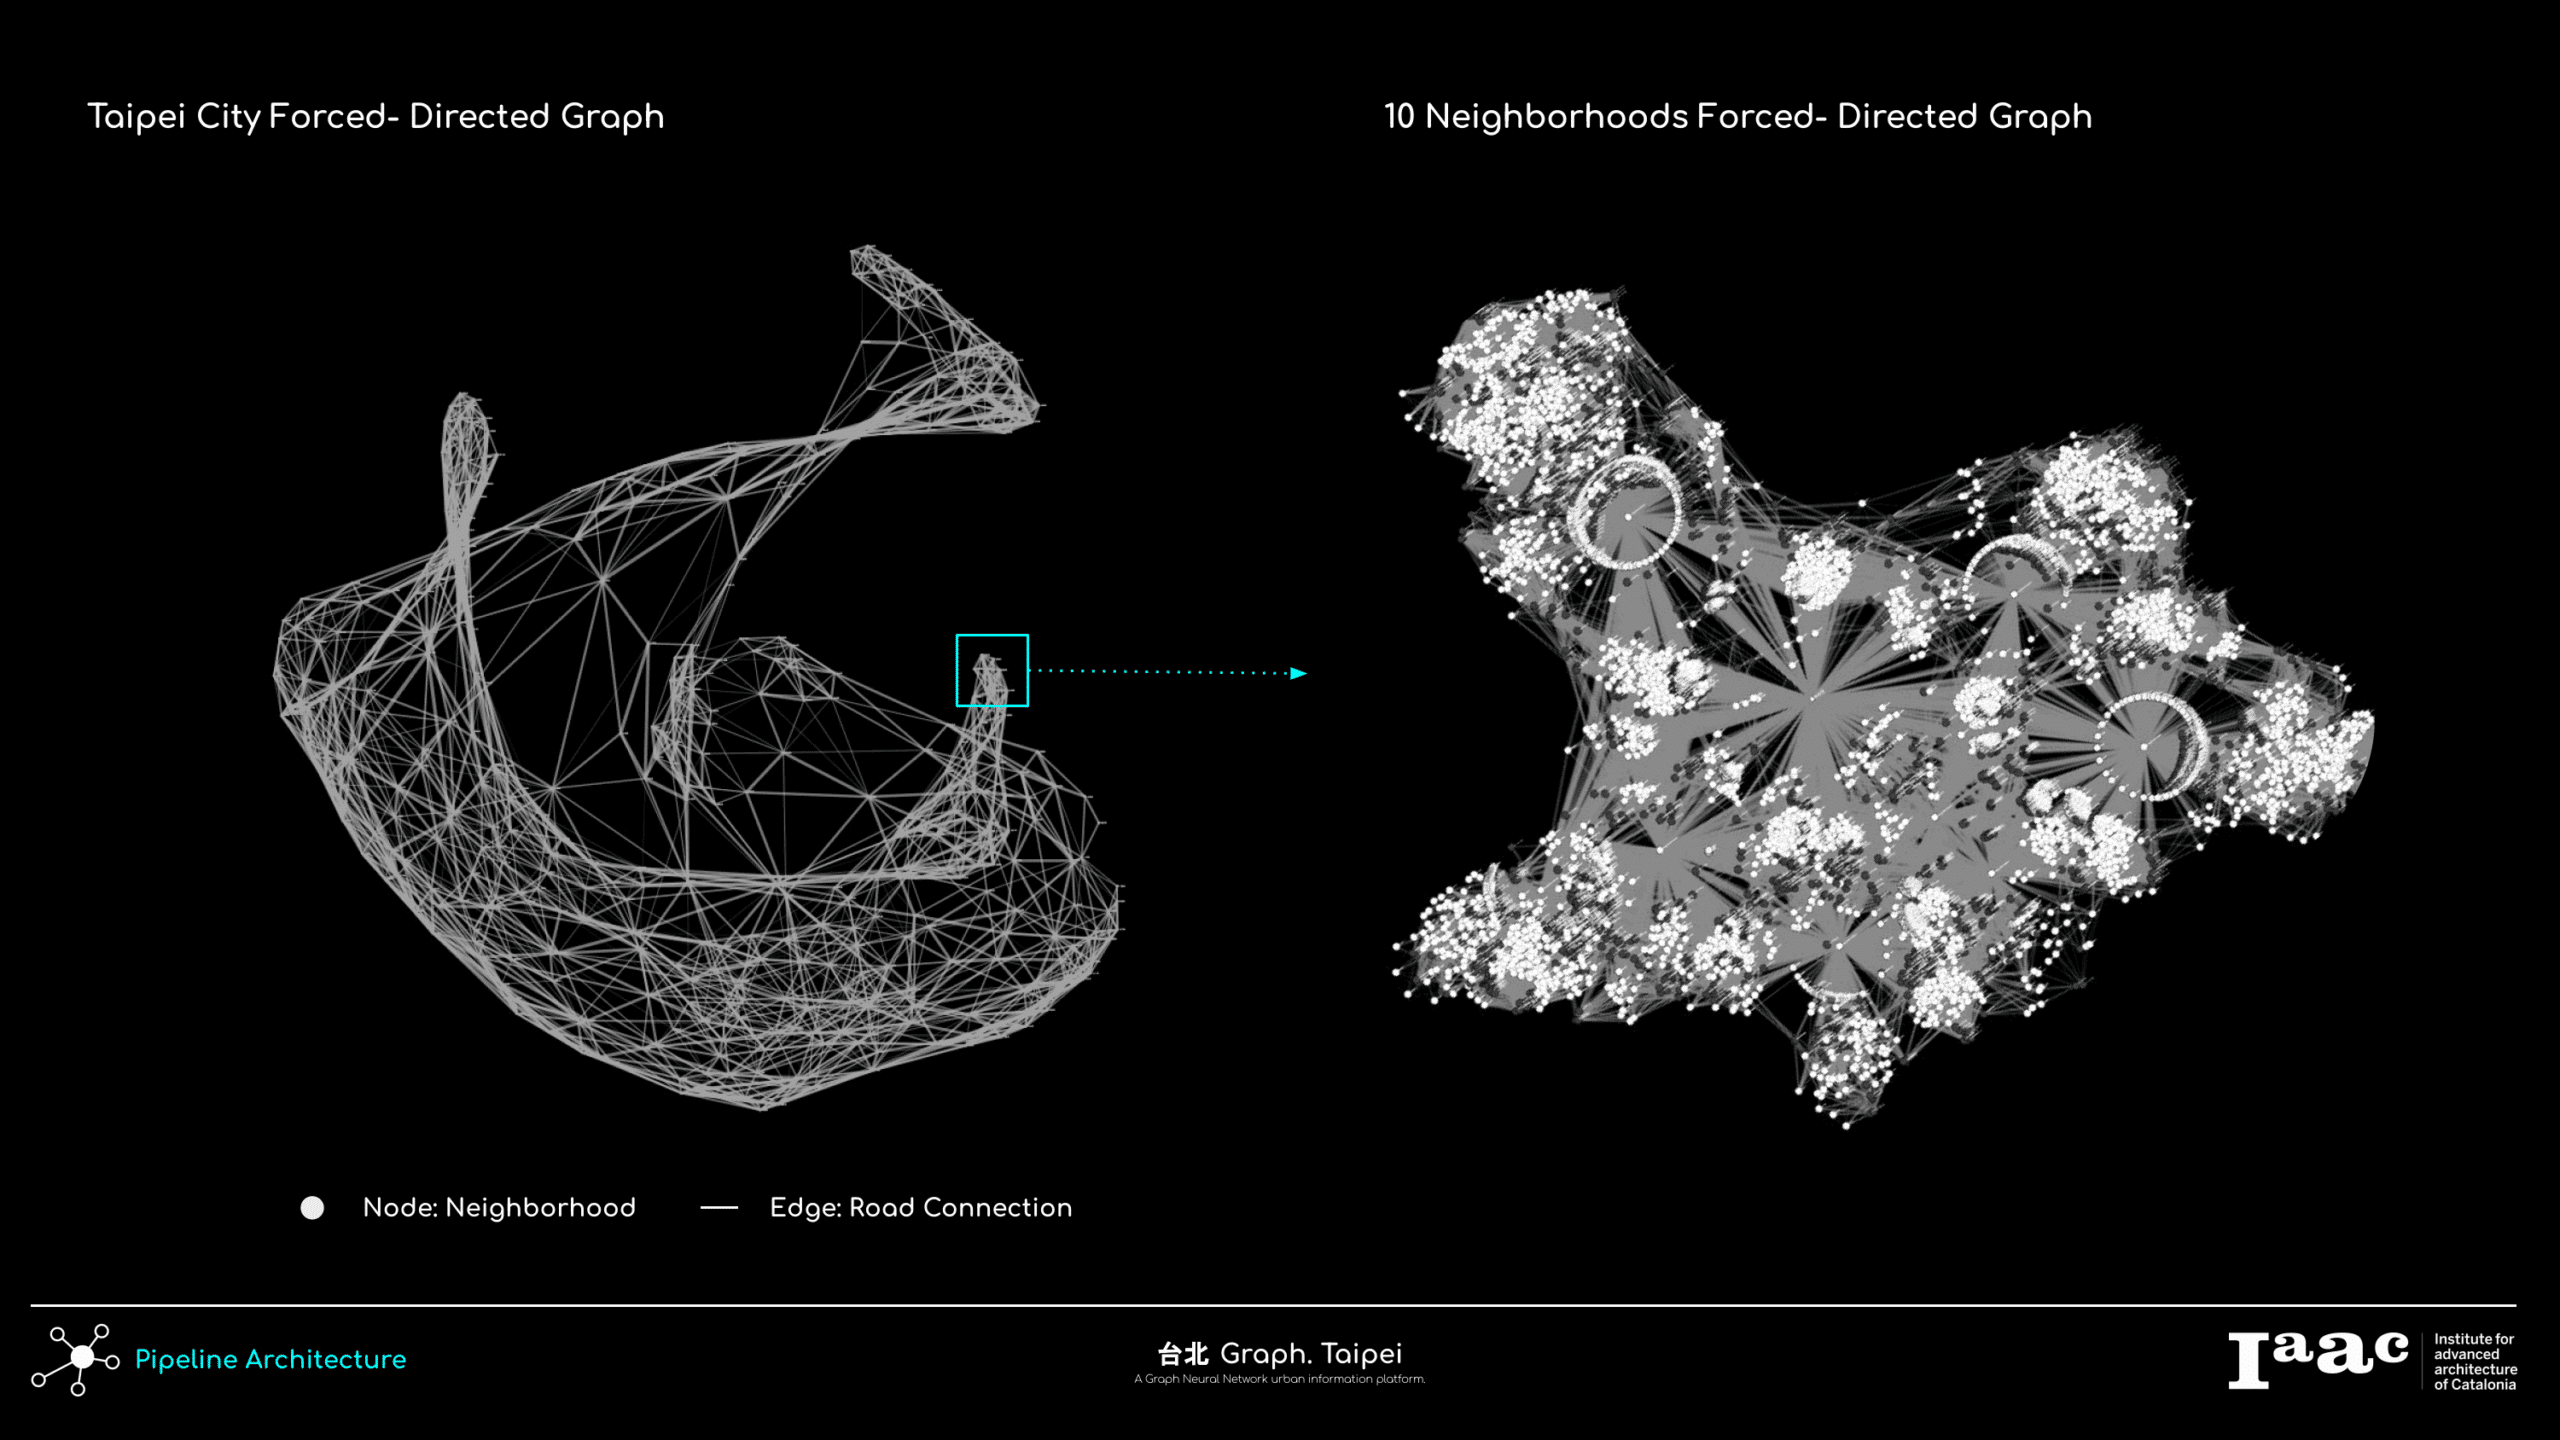
The result is that all 456 neighborhoods are constructed as a graph networks, and a forced directed graph method is used to visualize the data.
Analysis Pipeline
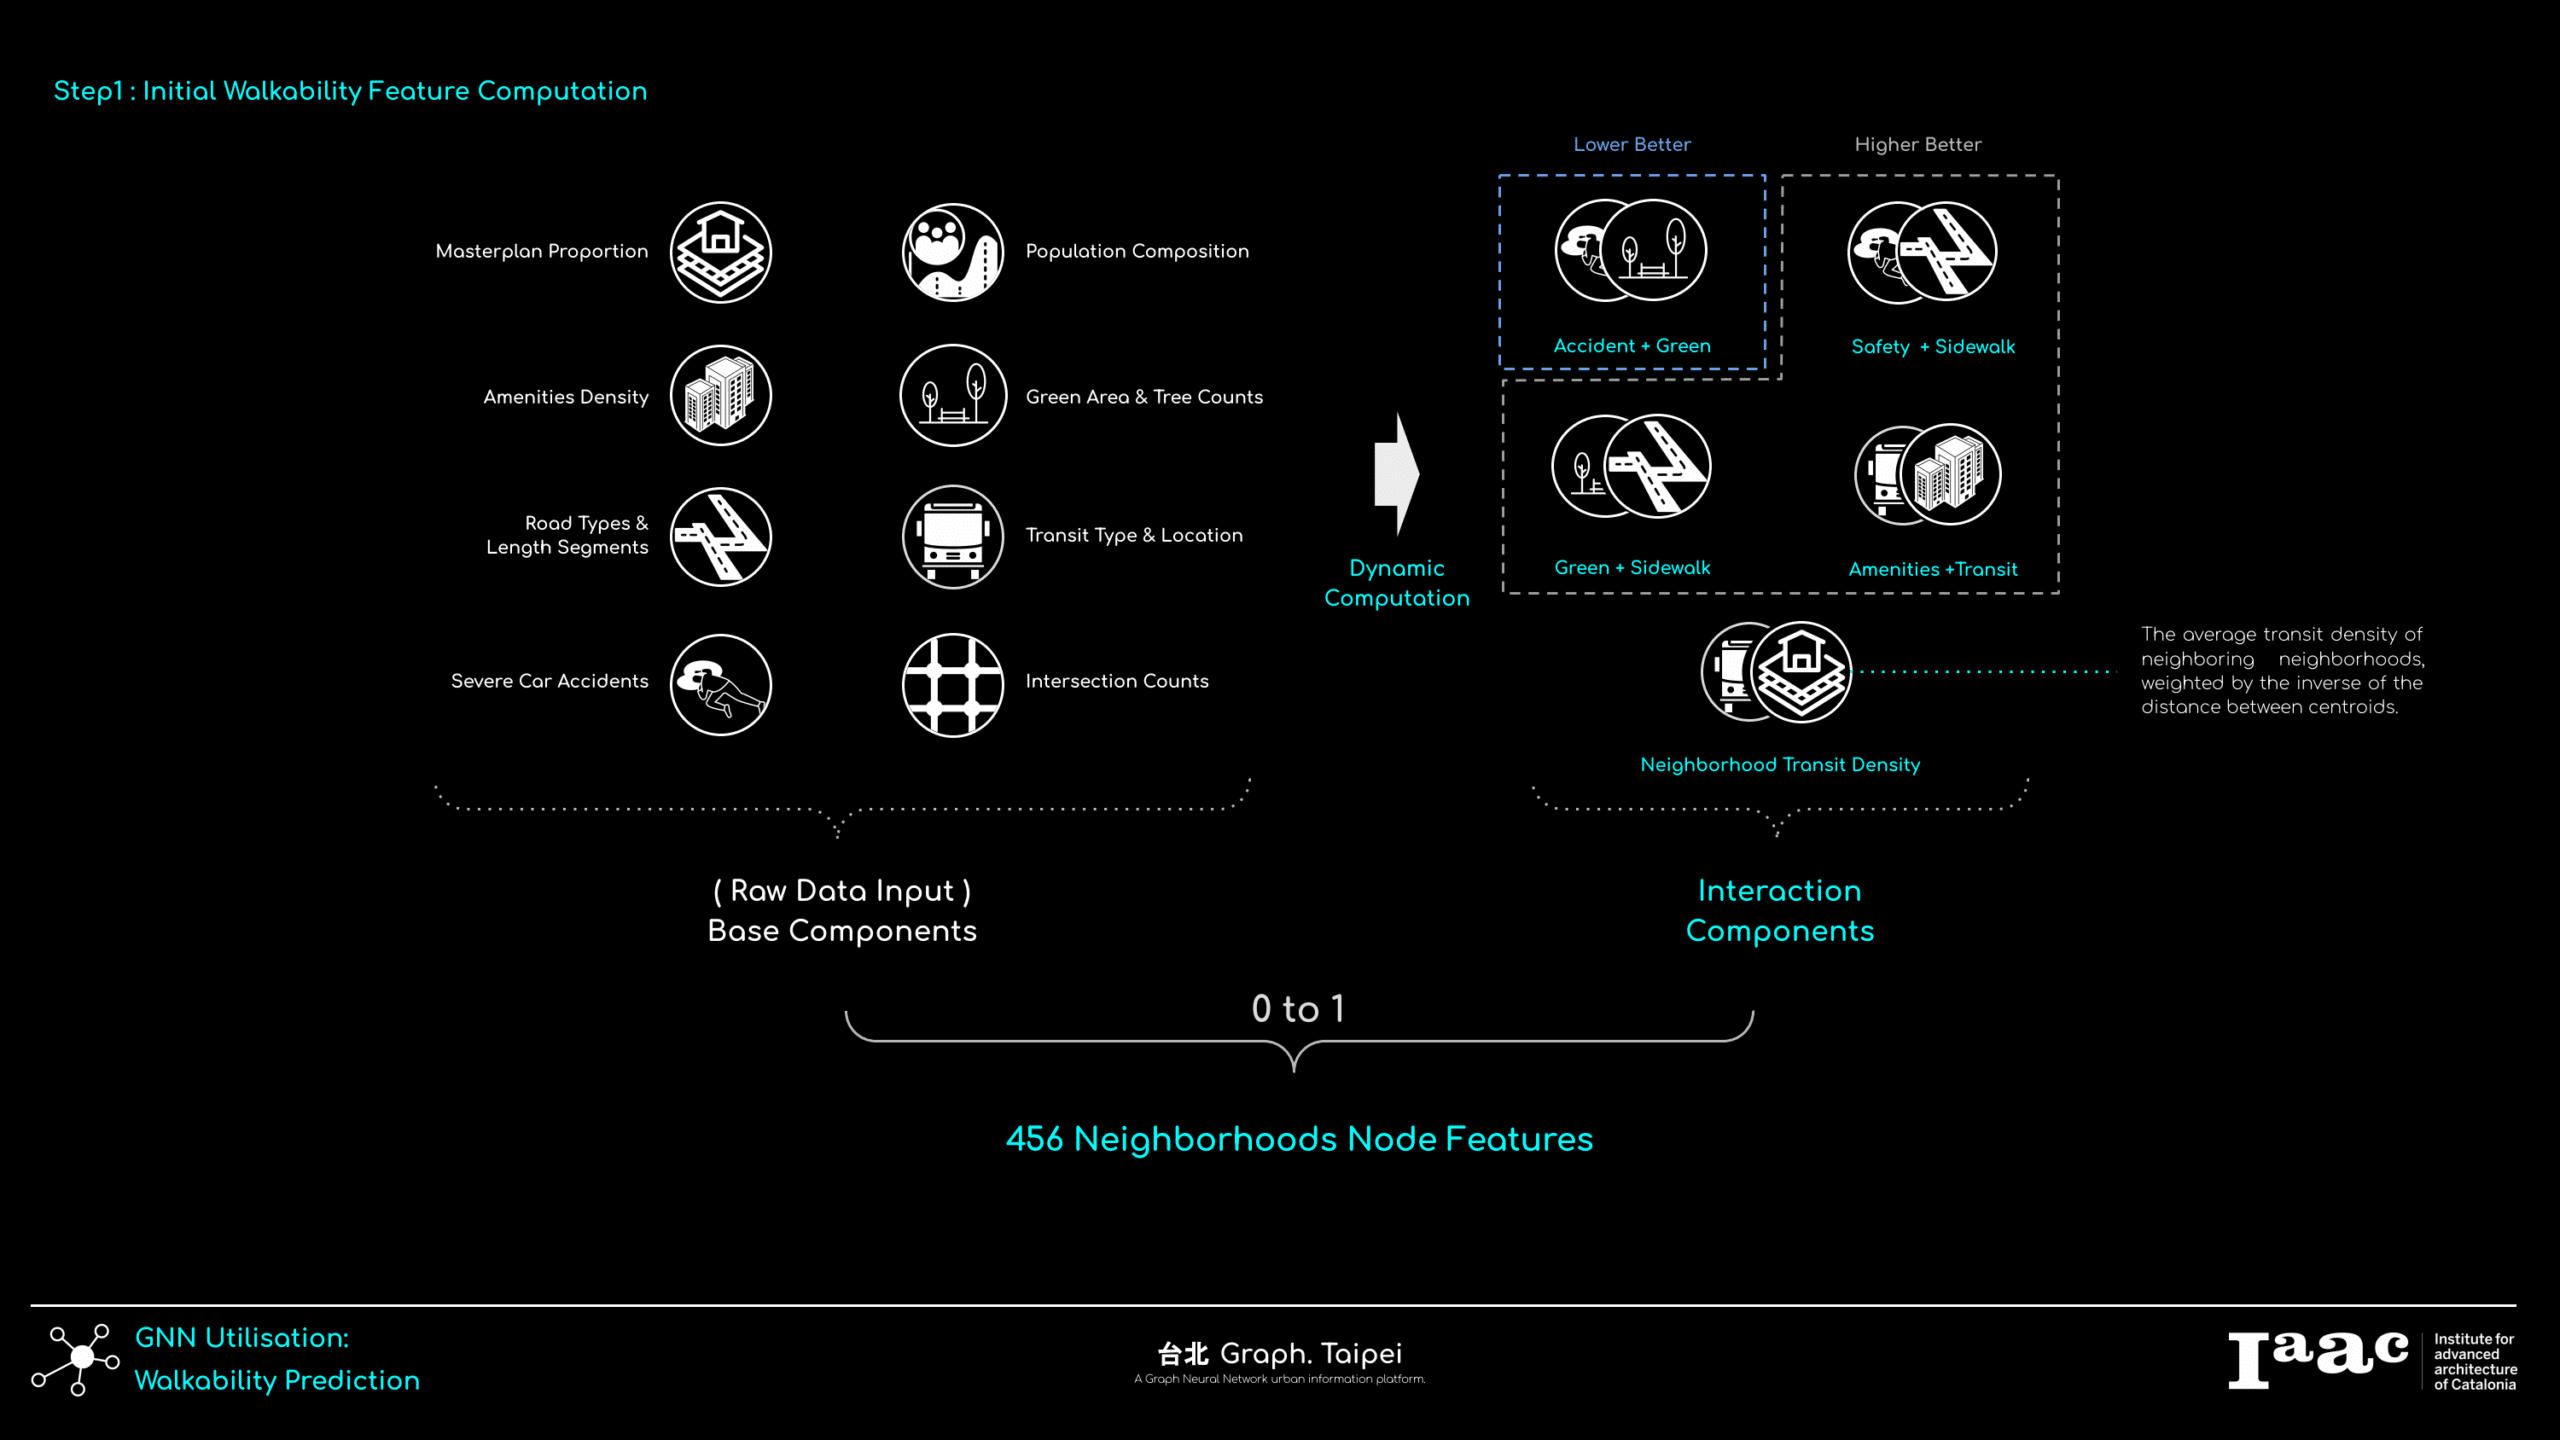
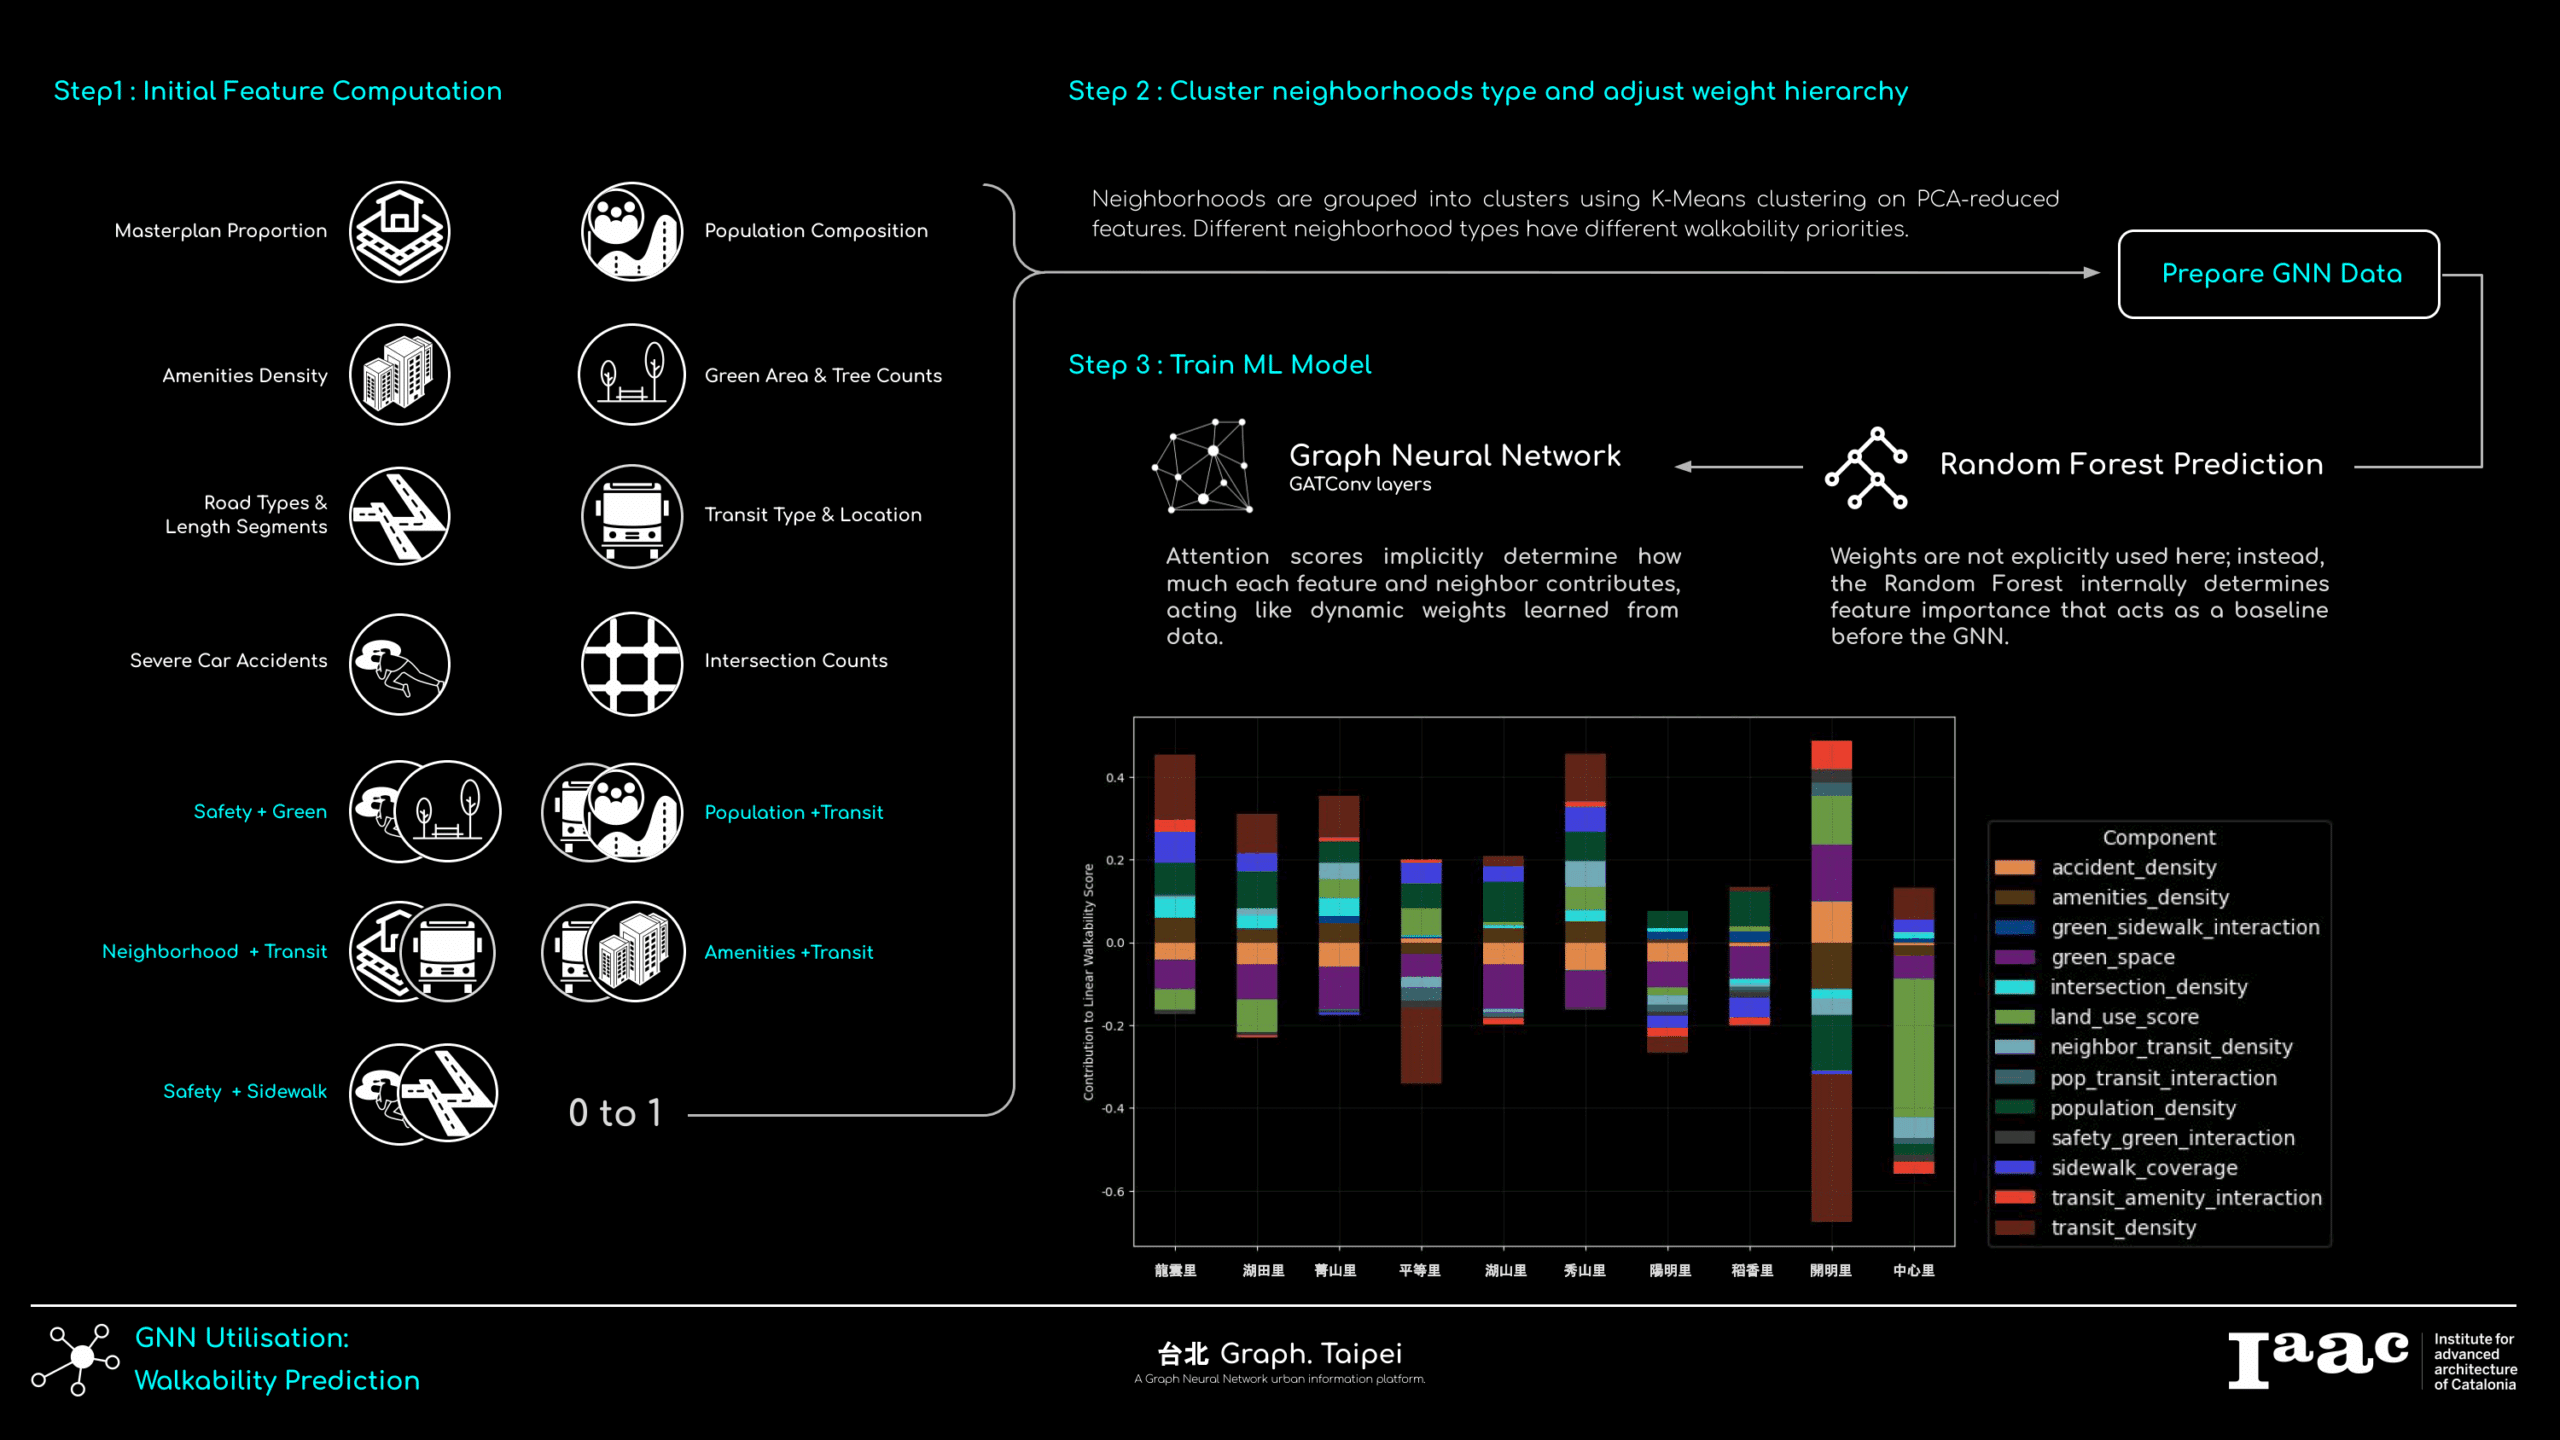
After the construction of the GNN, variable are required to calculate the initial walkability scores. These features are categorized and clustered based on their measuring roles.
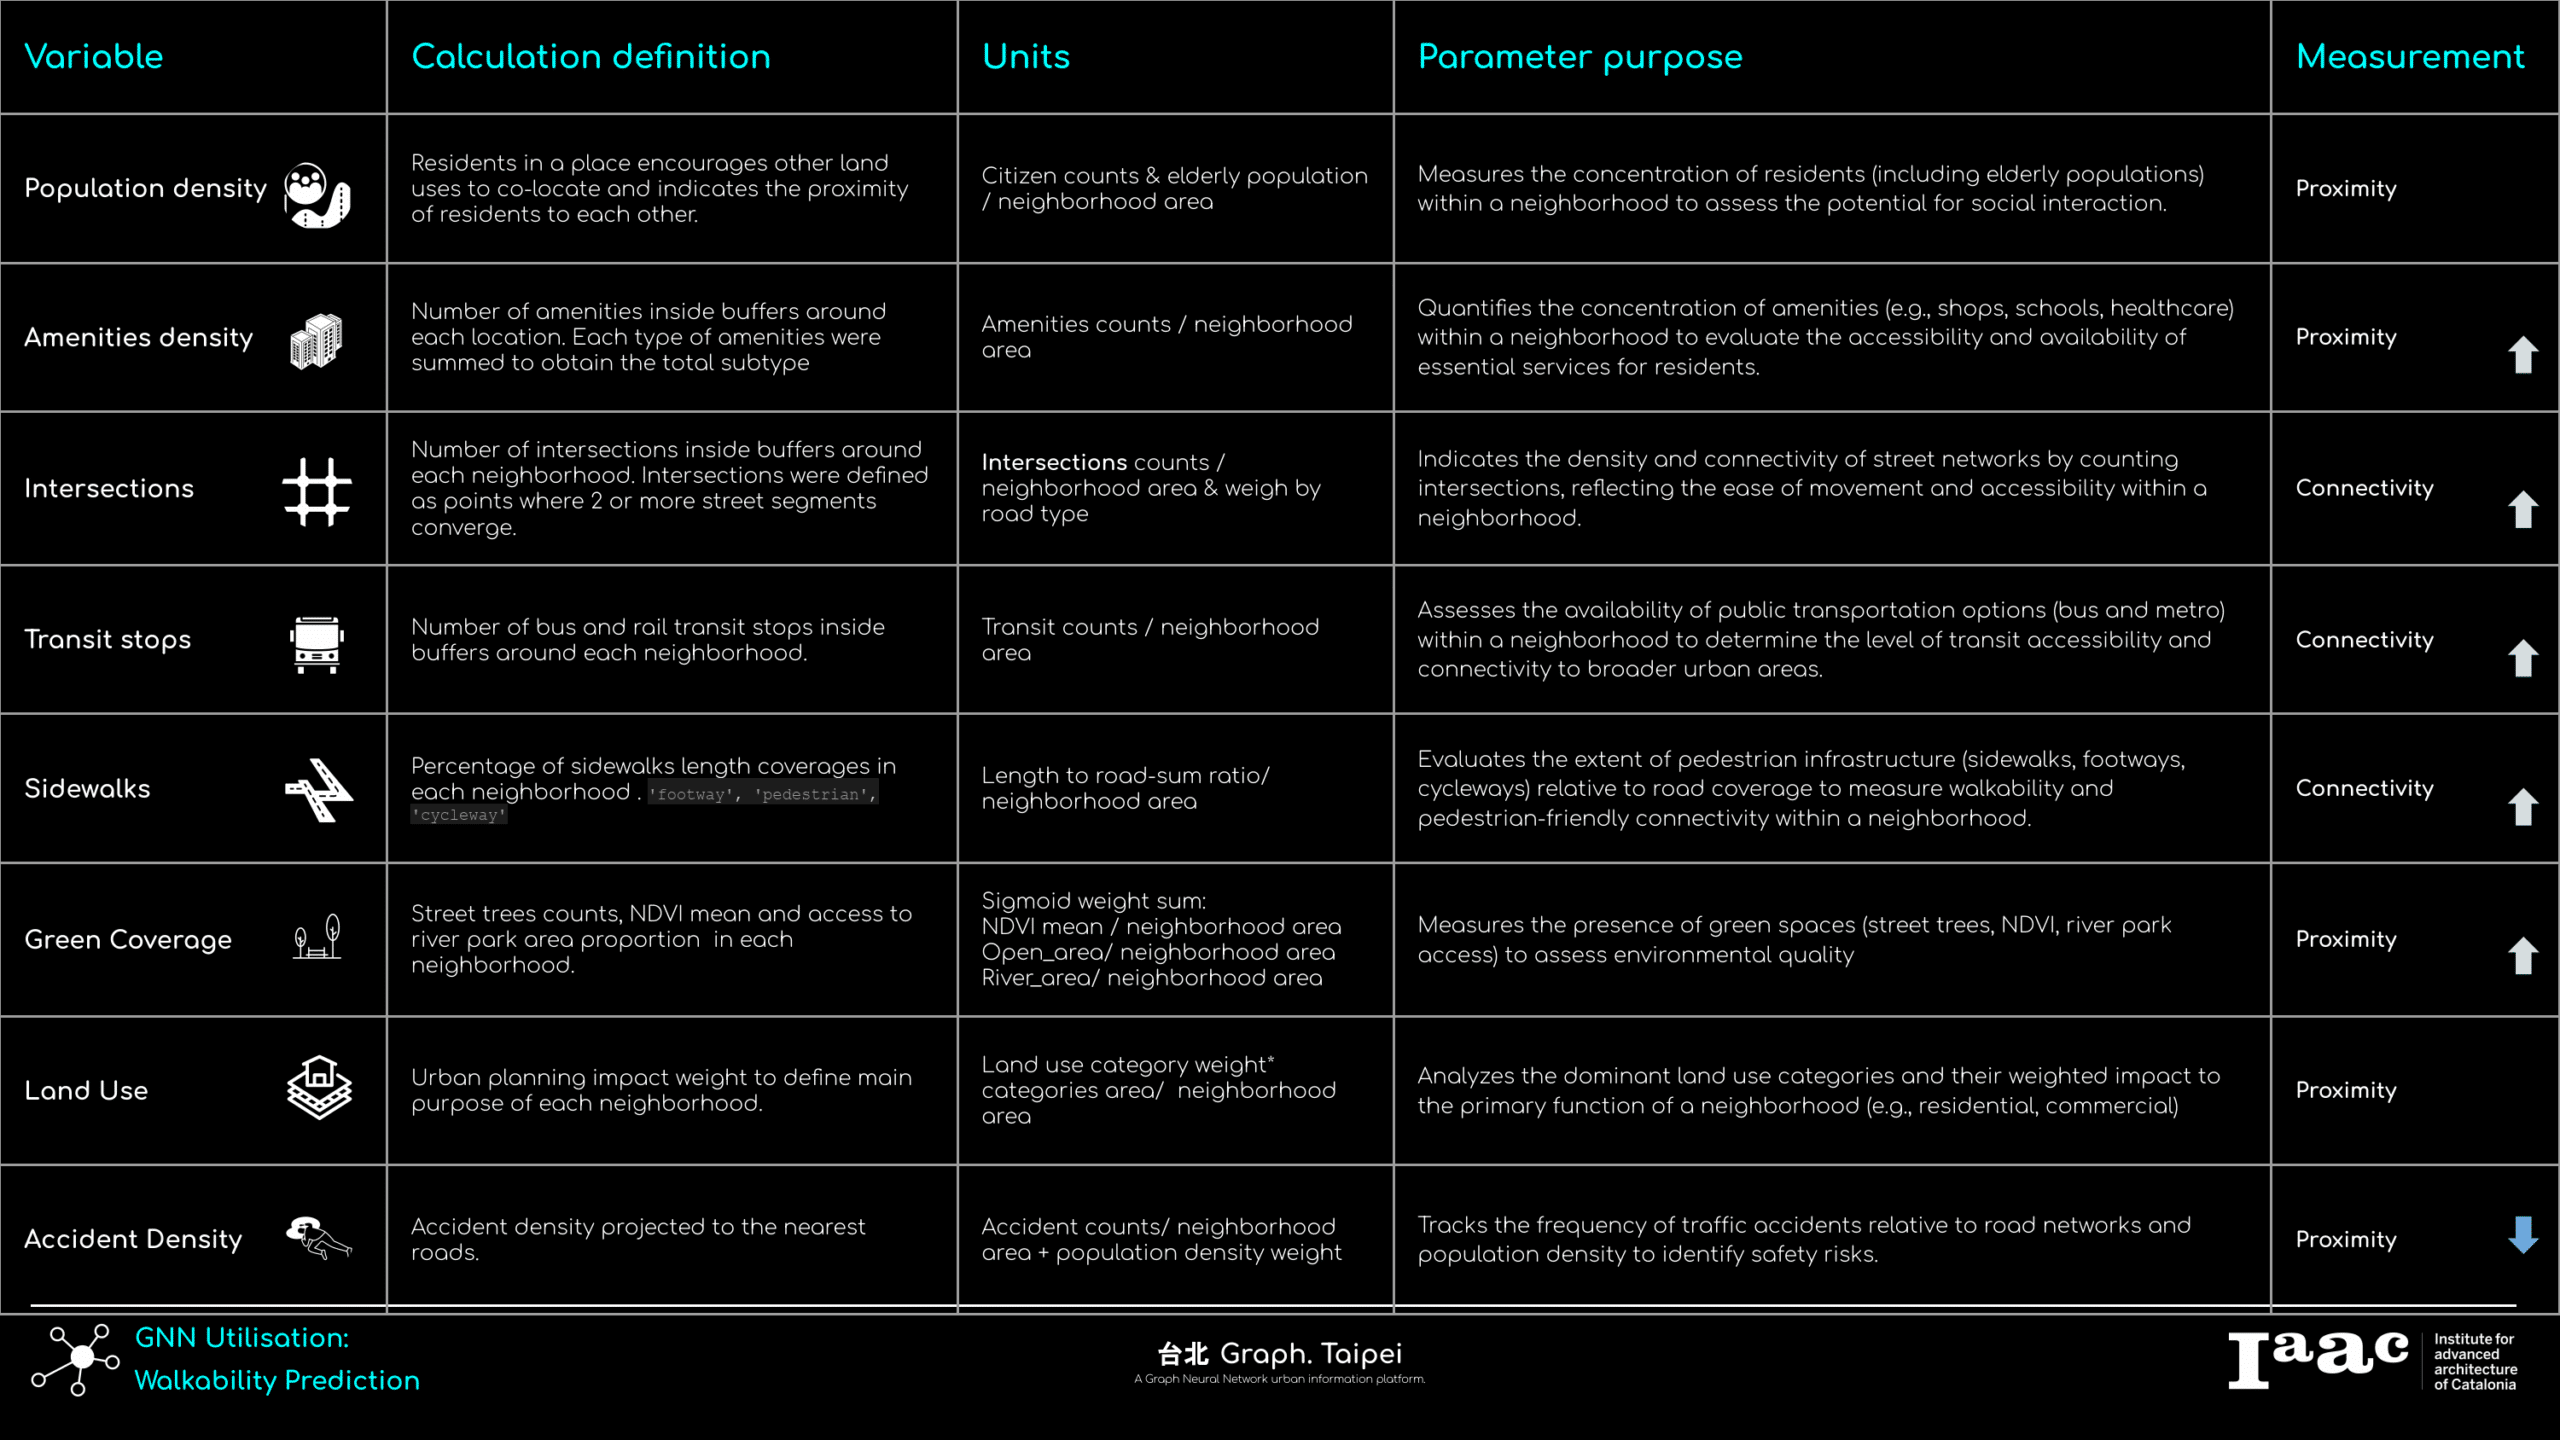
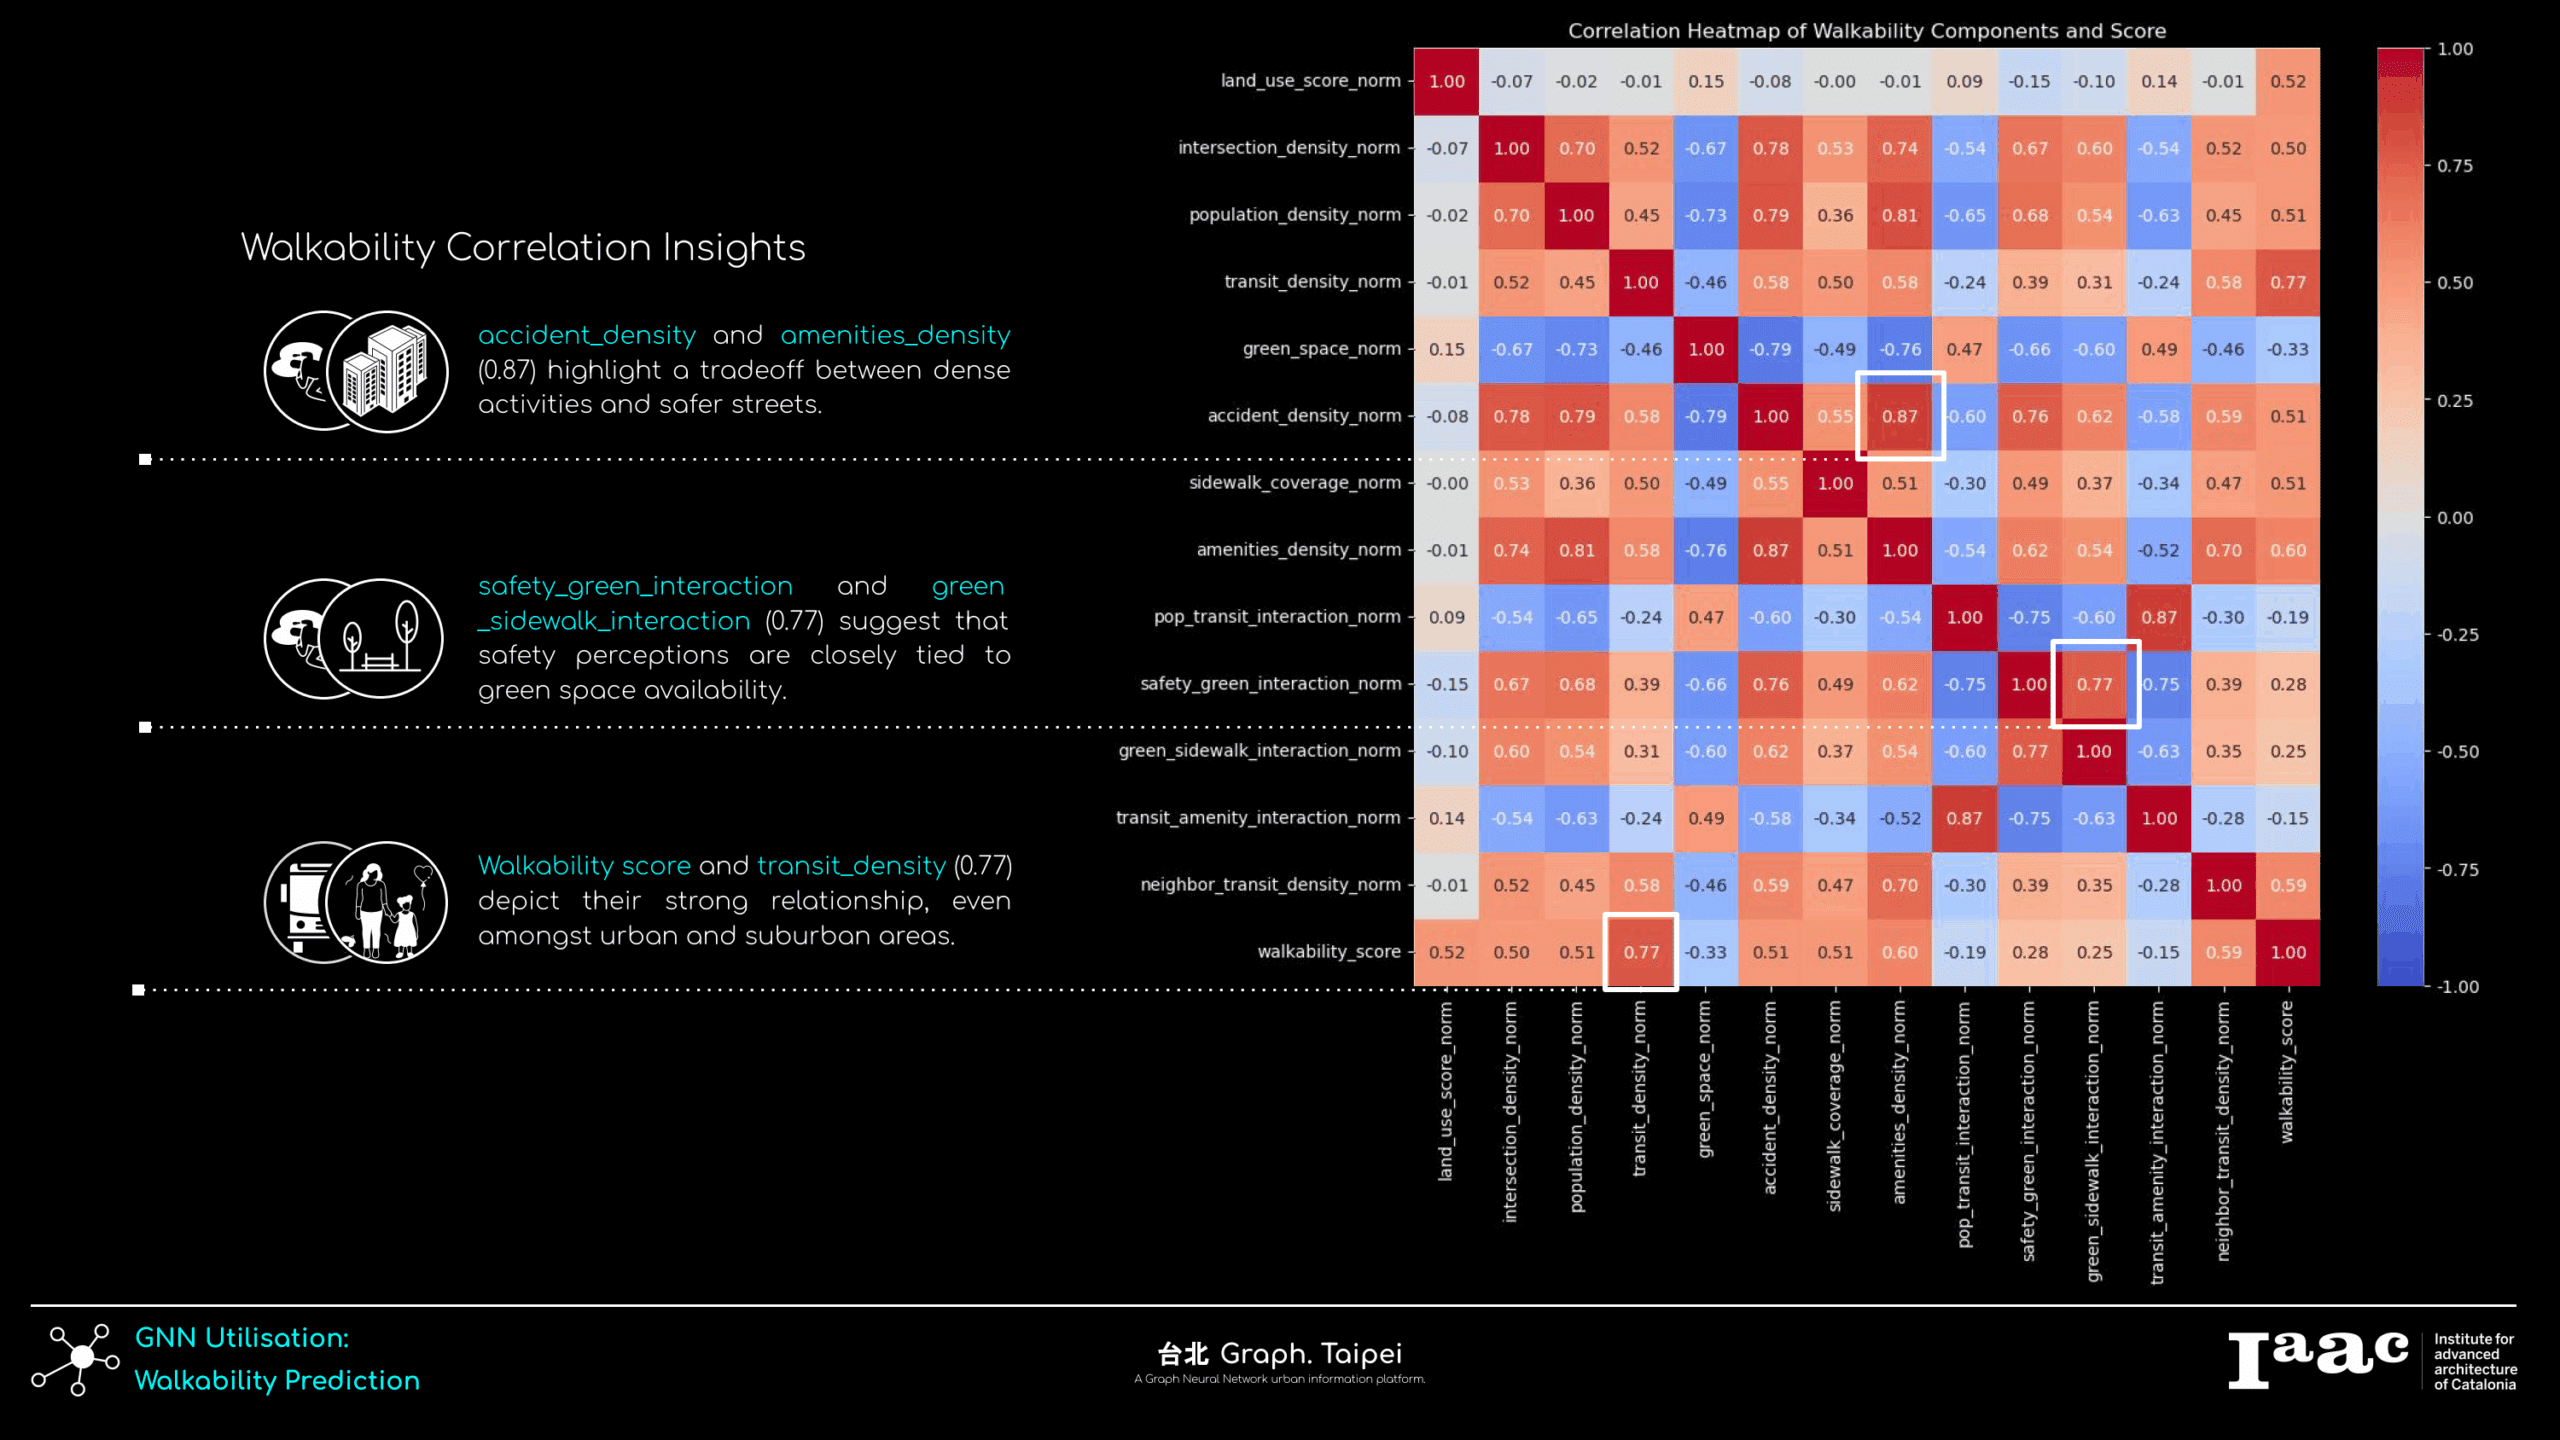
These basic parameters are then further defined to create a secondary analysis layer for more sophisticated calculations. Then these features are normalized further and produce the initial walkability scores for each neighborhoods.
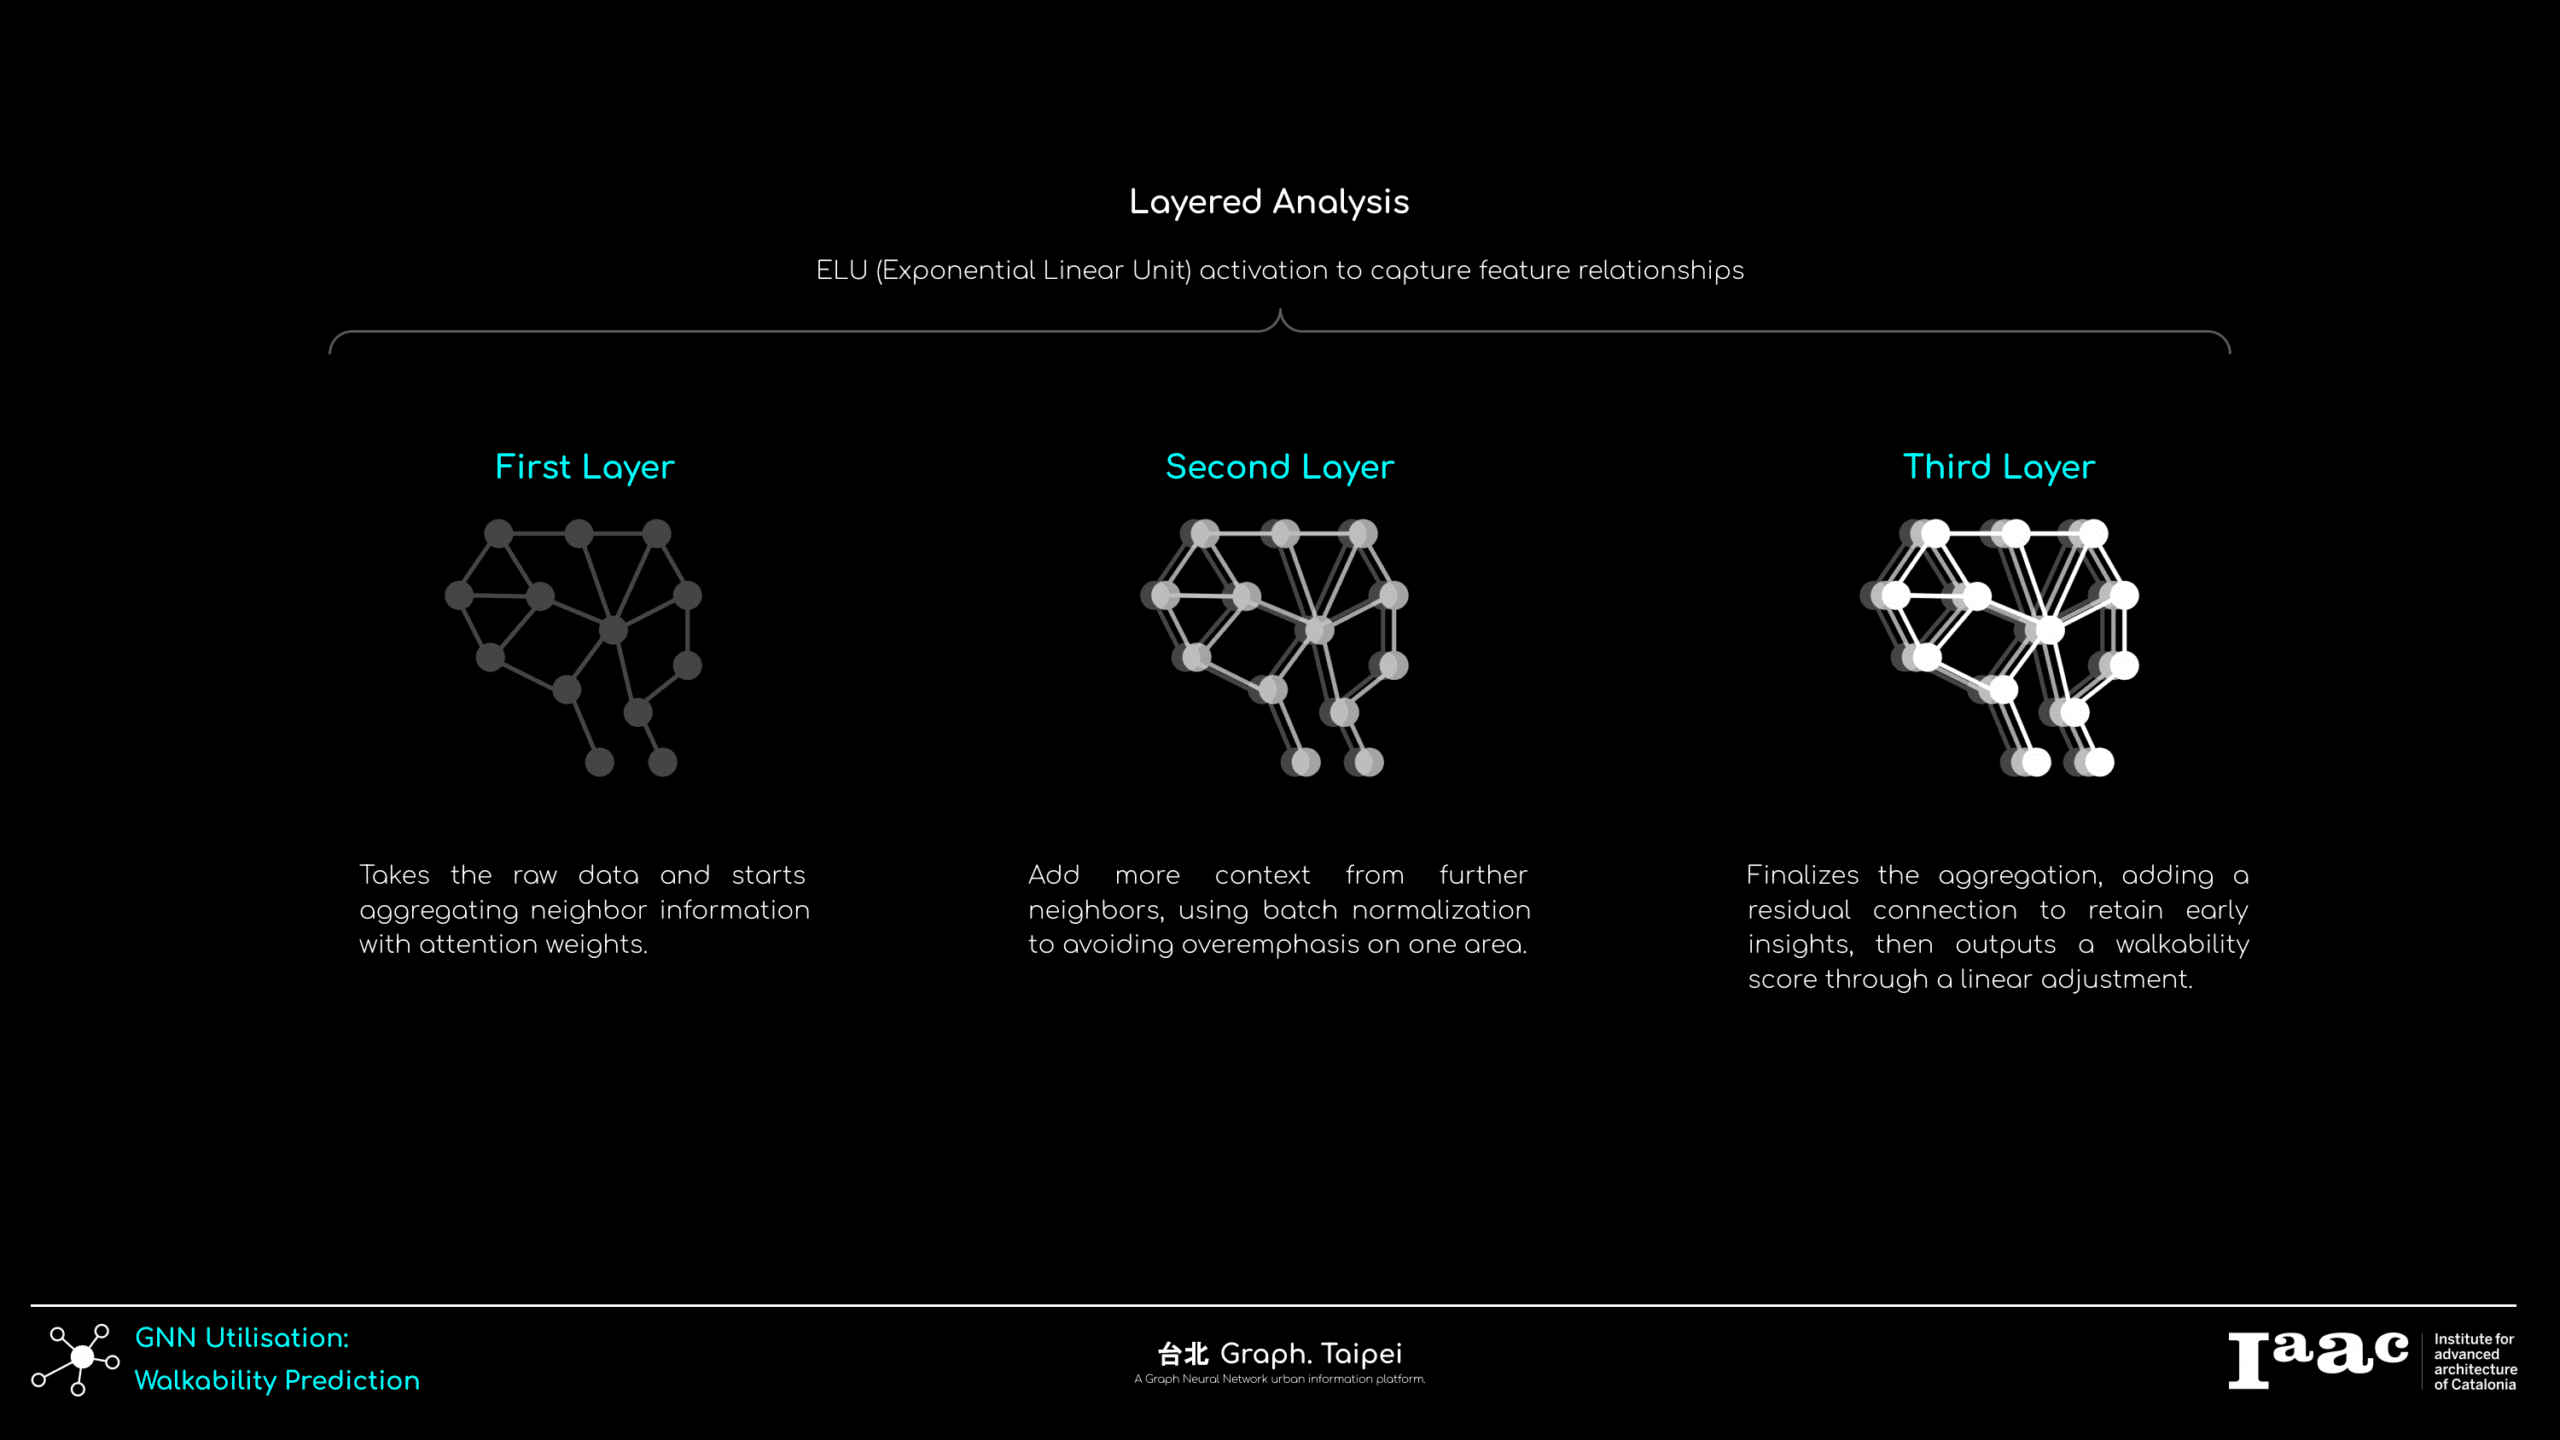
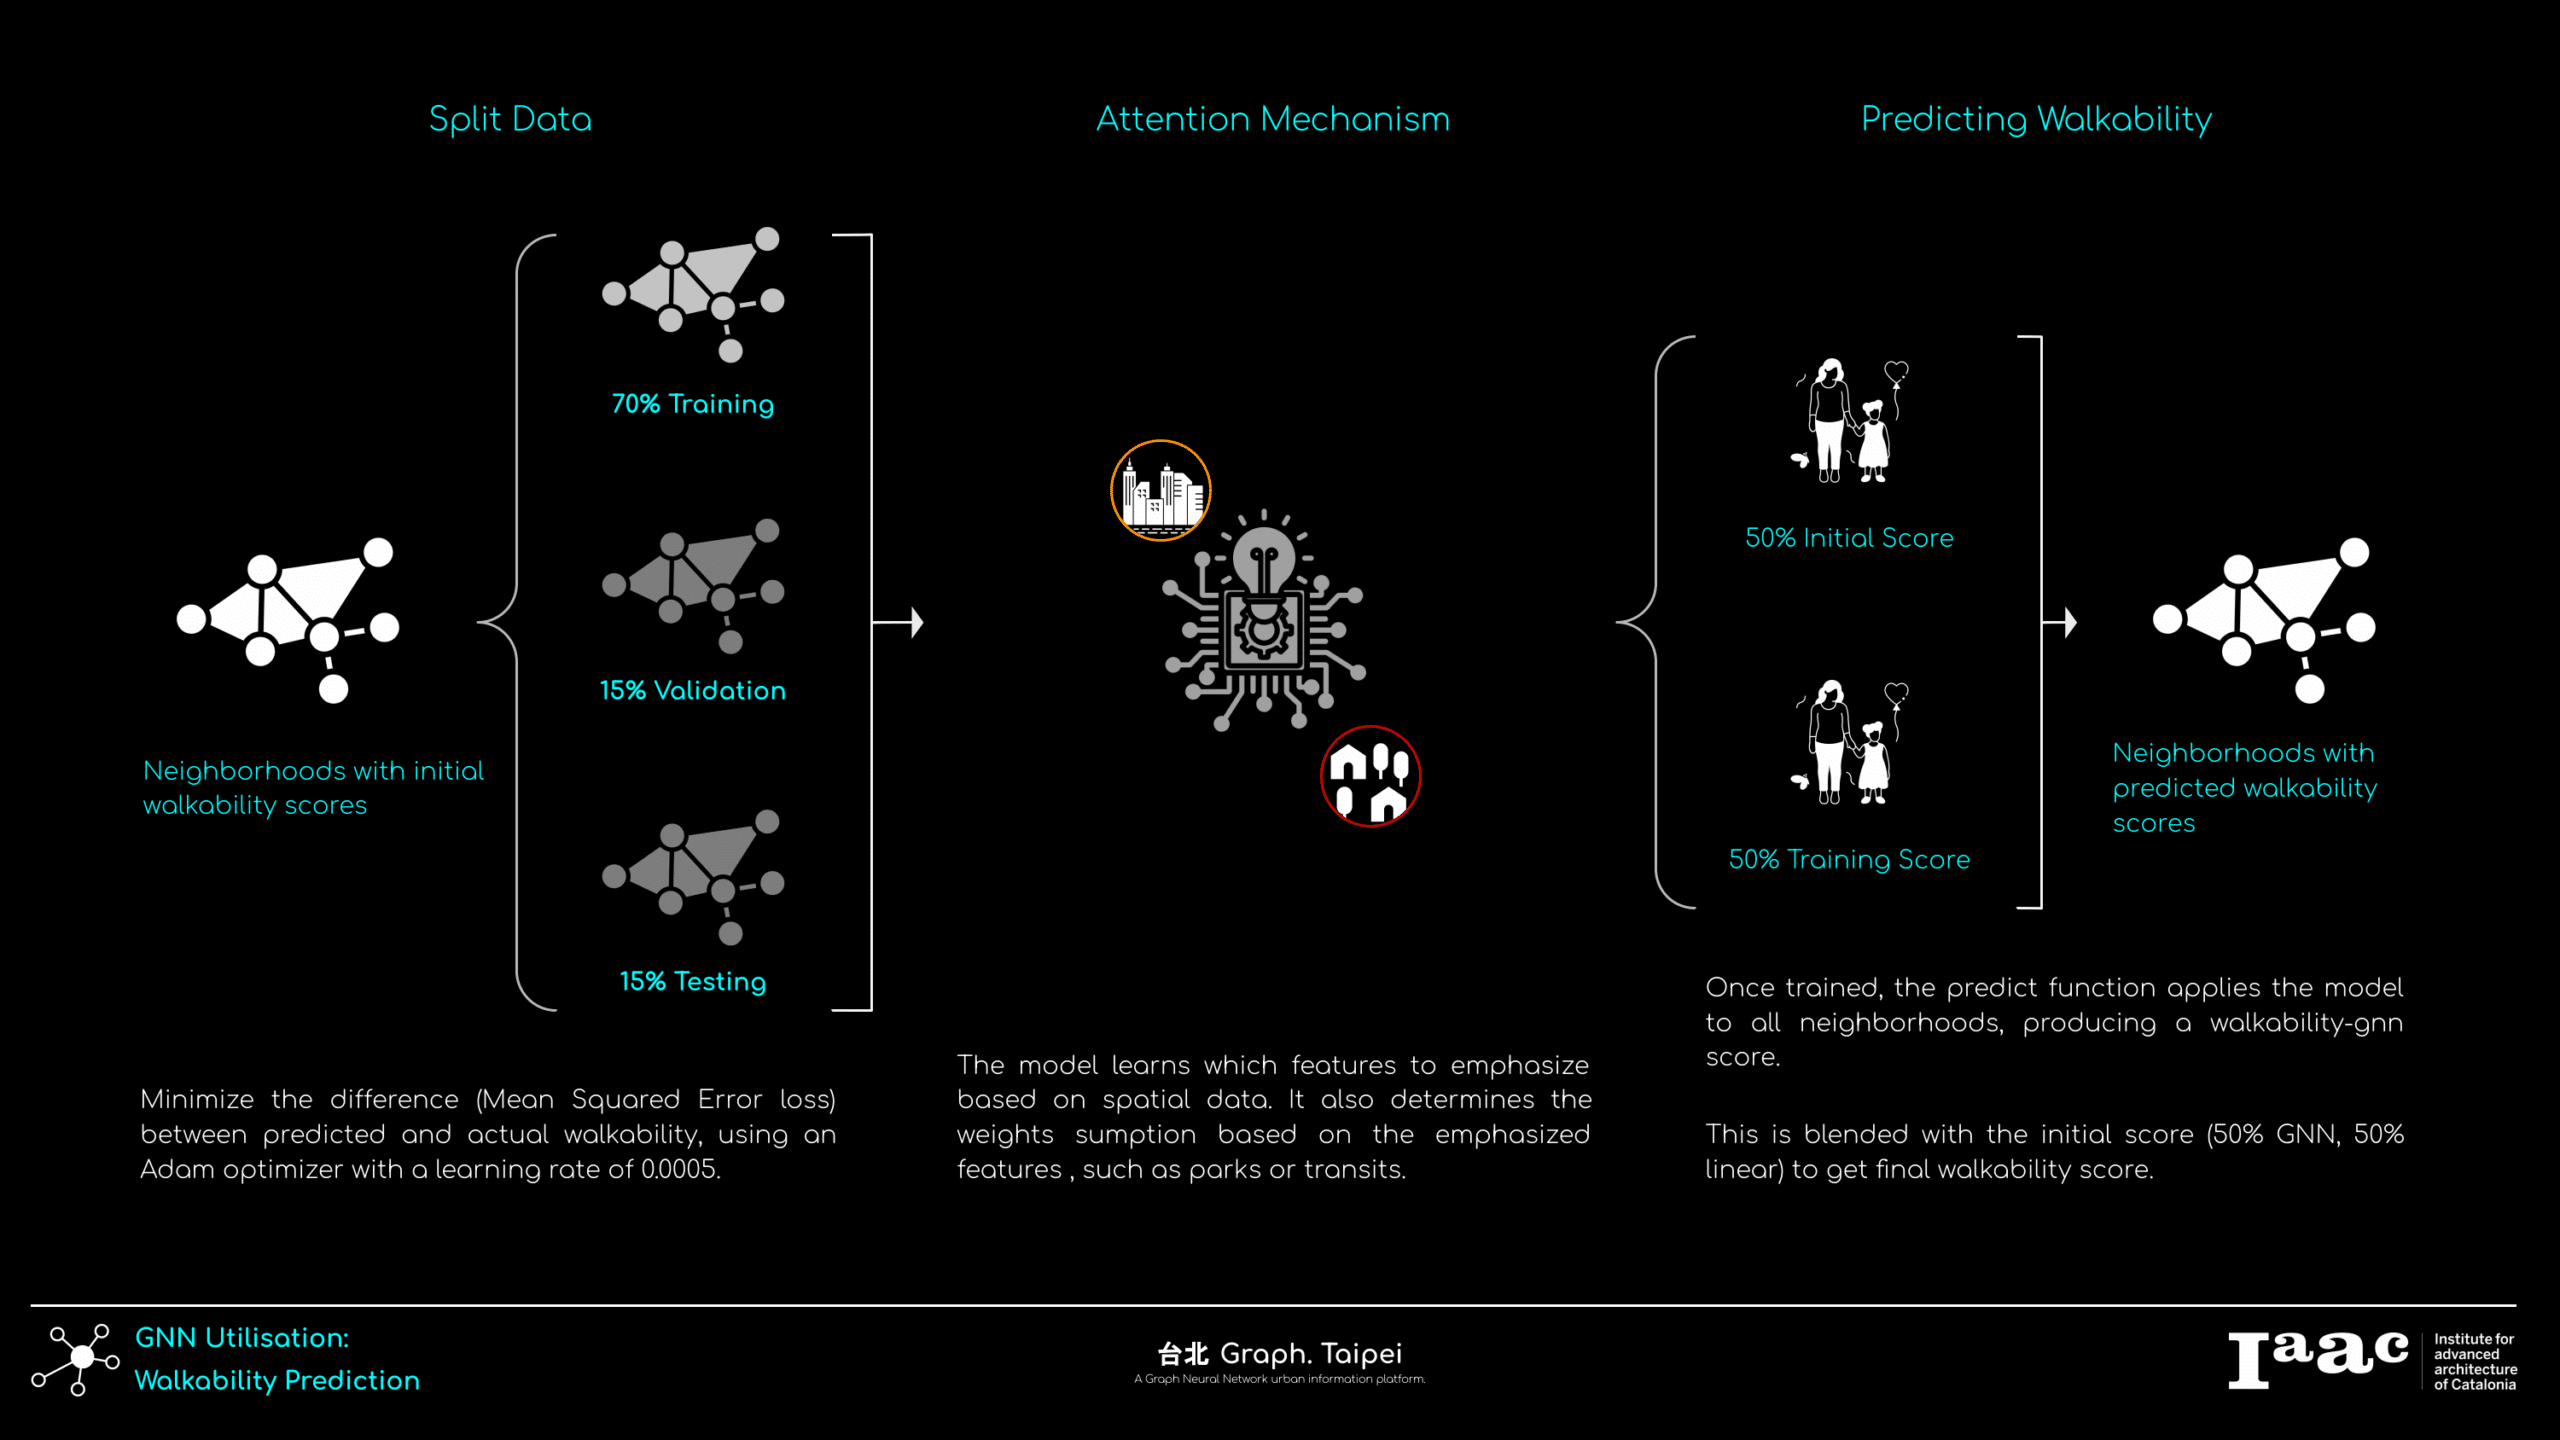
During the calculation, K-mean clustering is used to define Urban/ Suburban area to distinguish different walkable weights, then a layer of random forest prediction to determines the feature importance. Finally, the Graph Attentional Convoluting Networks (GATconv) will determine the dynamic weights for every neighborhoods.
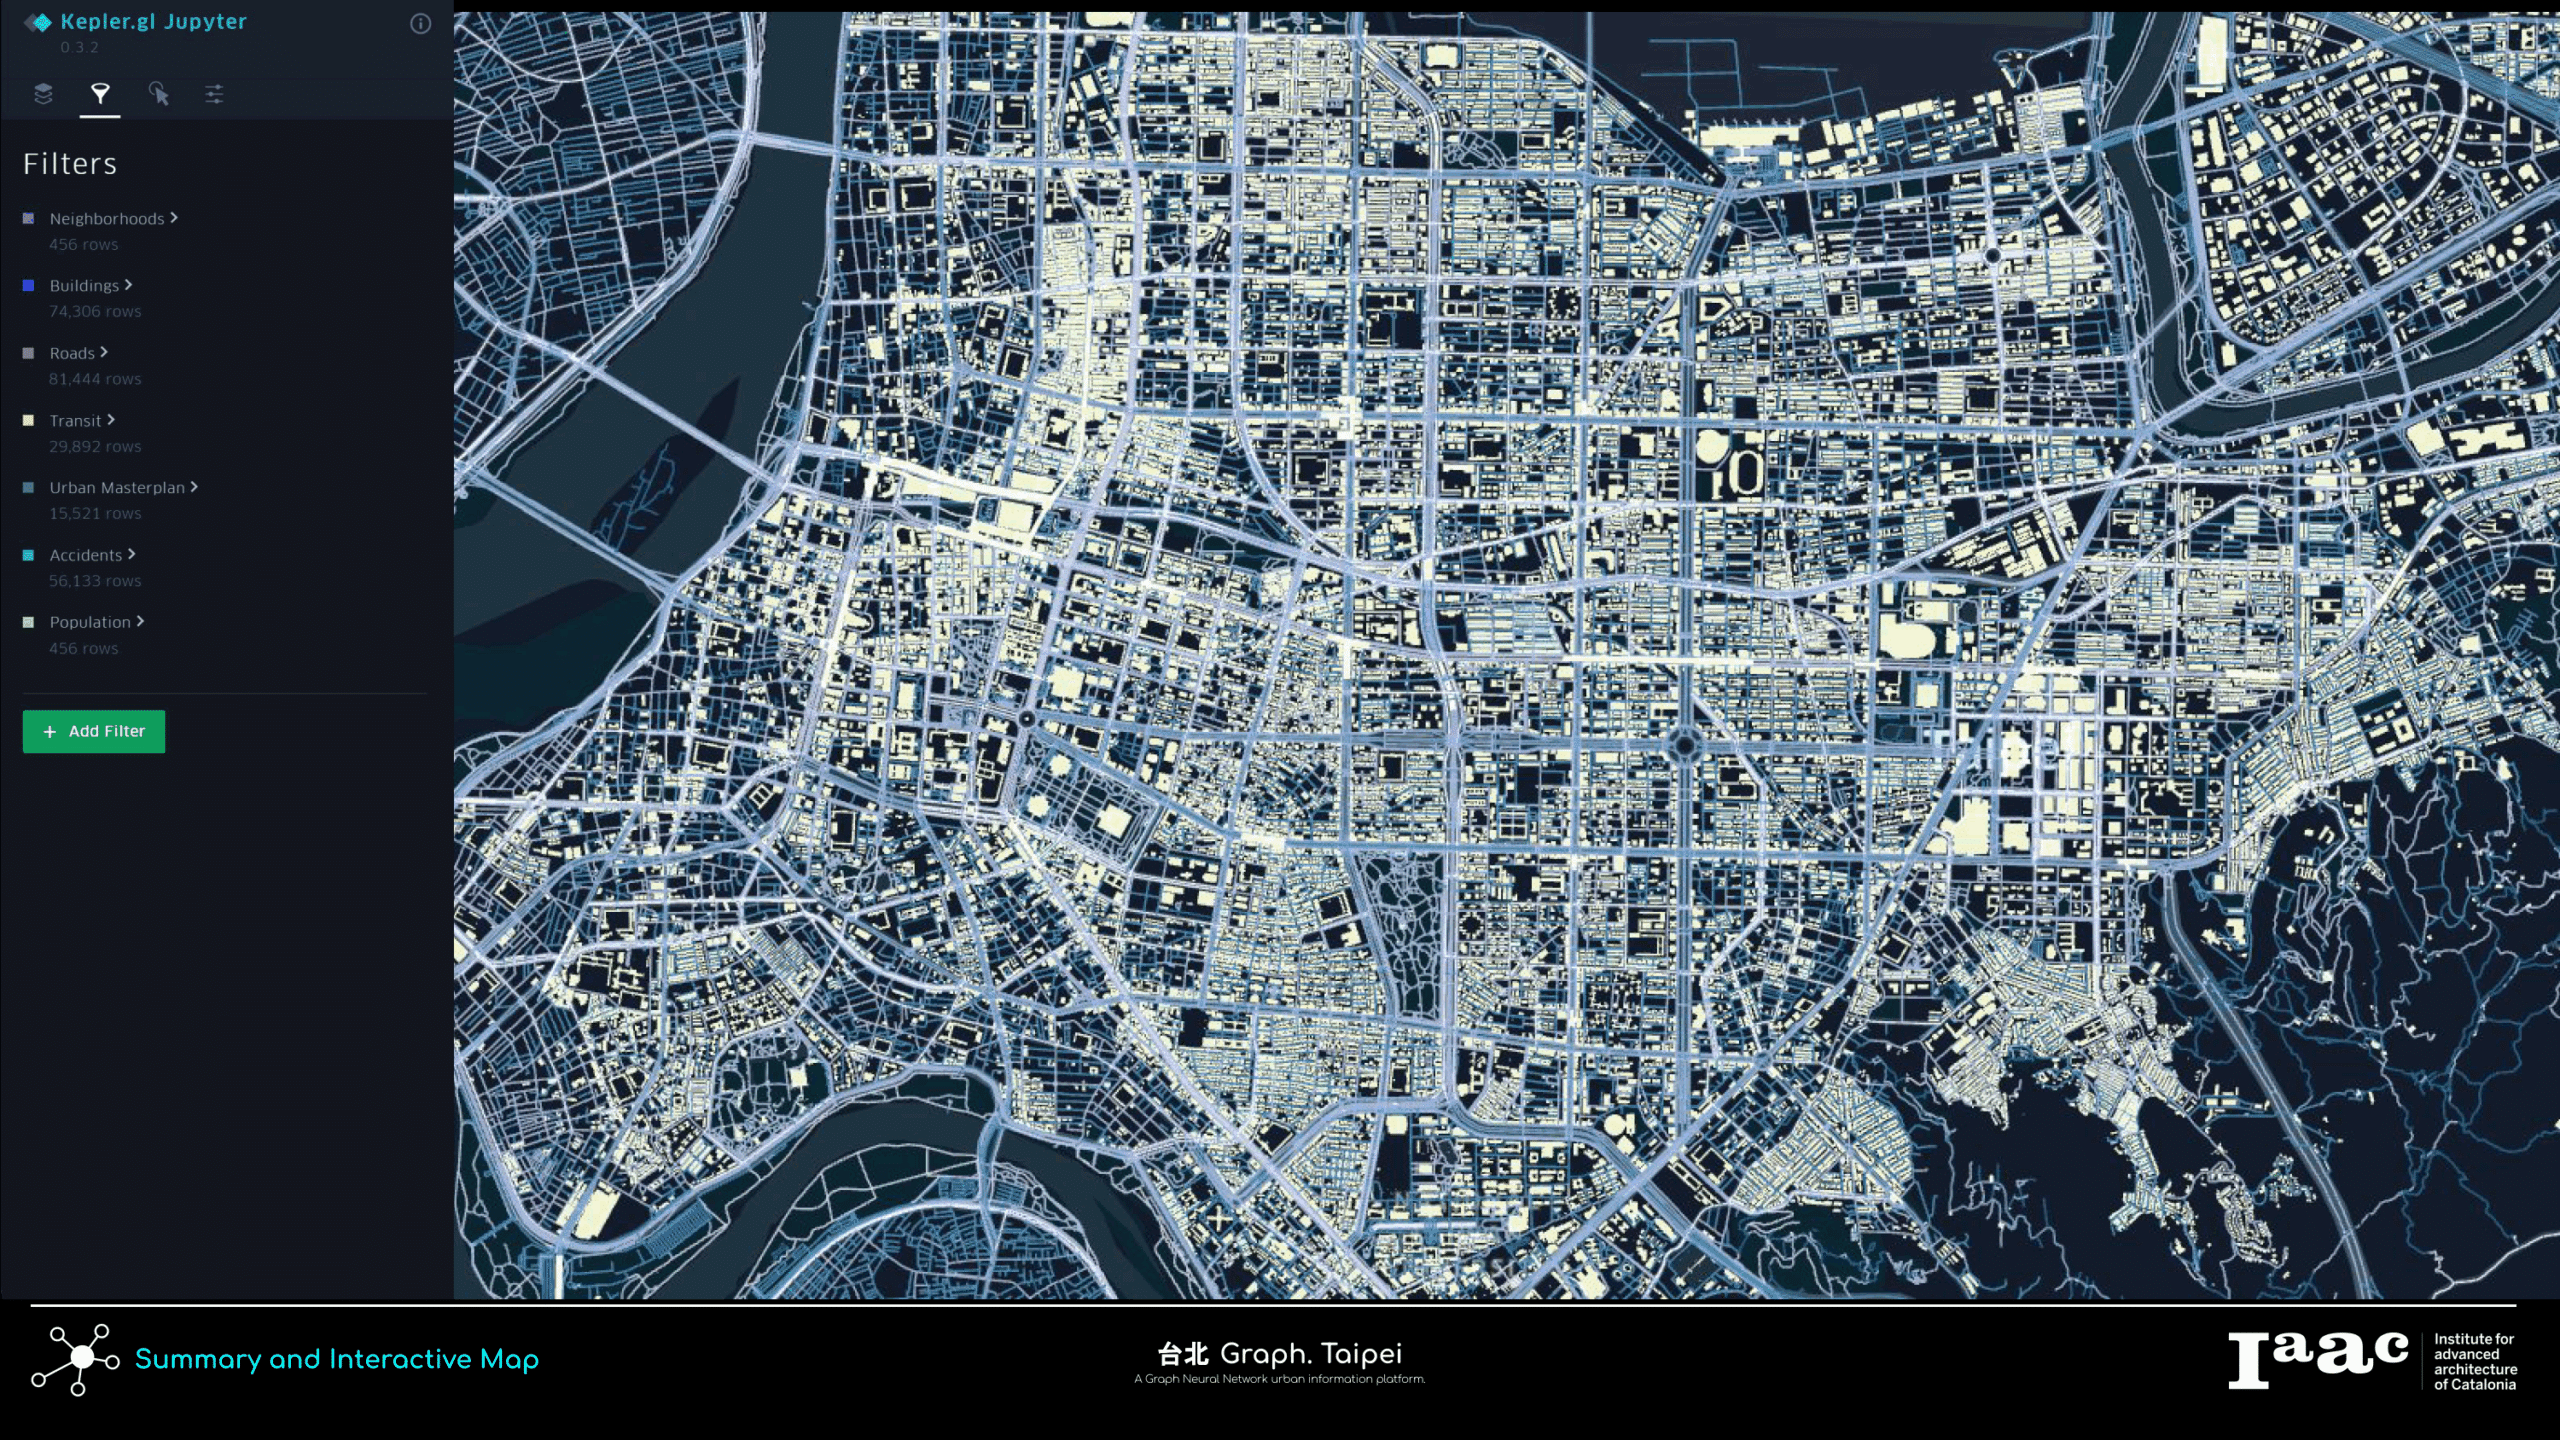
Output
The final is shown on a Kepler.gl platform, with innate visualization for each elements, suitable for urban planners and citizens to closer inspect their living neighborhoods condition and walkability scoring components.