
Introduction to Bicing
Bicing is the bike-sharing service in Barcelona, Spain, providing residents and tourists with an eco-friendly, convenient, and affordable means of transportation. Launched in 2007, Bicing has grown to include thousands of bicycles distributed across hundreds of docking stations throughout the city. Users can pick up a bike at one station and return it to any other, promoting a flexible and sustainable mode of travel. As cities worldwide grapple with traffic congestion and environmental challenges, bike-sharing programs like Bicing offer a promising solution by encouraging cycling and reducing reliance on motor vehicles.
The Challenge
Despite its benefits, the success of Bicing depends on the availability of bikes and docking spaces at each station. Users can face significant inconvenience if they arrive at a station only to find no bikes available or no space to return a bike. This issue is particularly acute during peak hours and in high-demand areas. To enhance user satisfaction and operational efficiency, it is crucial to predict the availability of bikes and docking spaces accurately.
The Project & Workflow
In this machine learning project, we aim to develop a predictive model to forecast the availability of bikes at Bicing stations in Barcelona. By leveraging historical data about the abailavility of bikes as well as other geographical and temporal data, in addition various predictive algorithms, we strive to provide insights that can help optimize the redistribution of bikes and improve user experience.
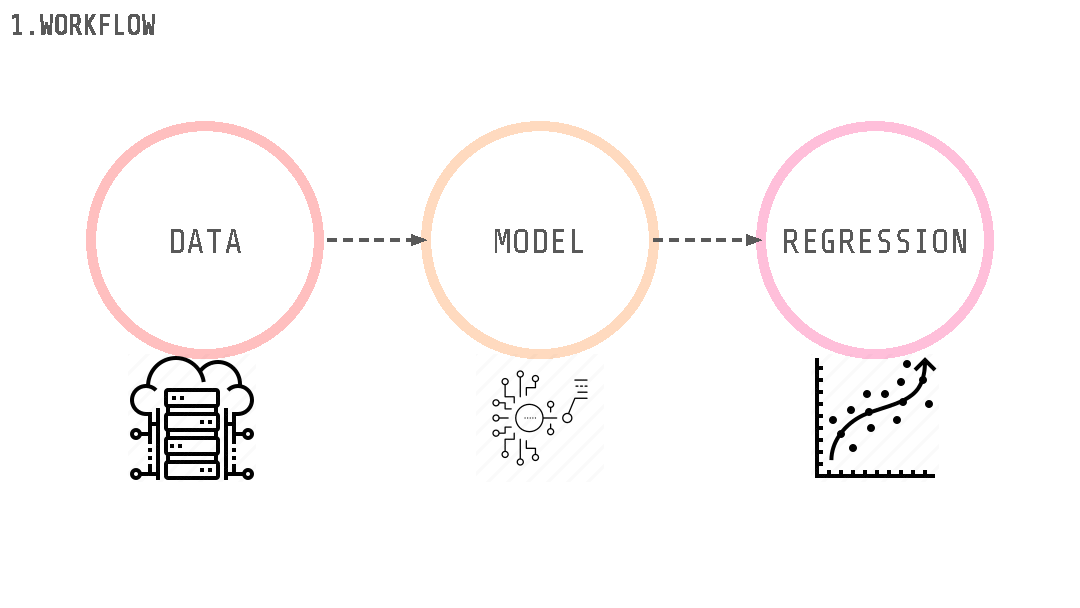
To achieve this objective we follow a 3 stage workflow. We begin with gathering the data needed to train the models, this data will then need to be analyzed to understand the relations that it encodes and clean to remove missing values or mistakes/outliers. The second stage consists of choosing and testing different machine learning regression models, training them multiple times and changing the setup on each training session, and evaluating their score after each training. Finally with the models trained the last consists of making predictions for the availability of bikes in bicing stations and comparing them to the real case.
Data Collection and preparation
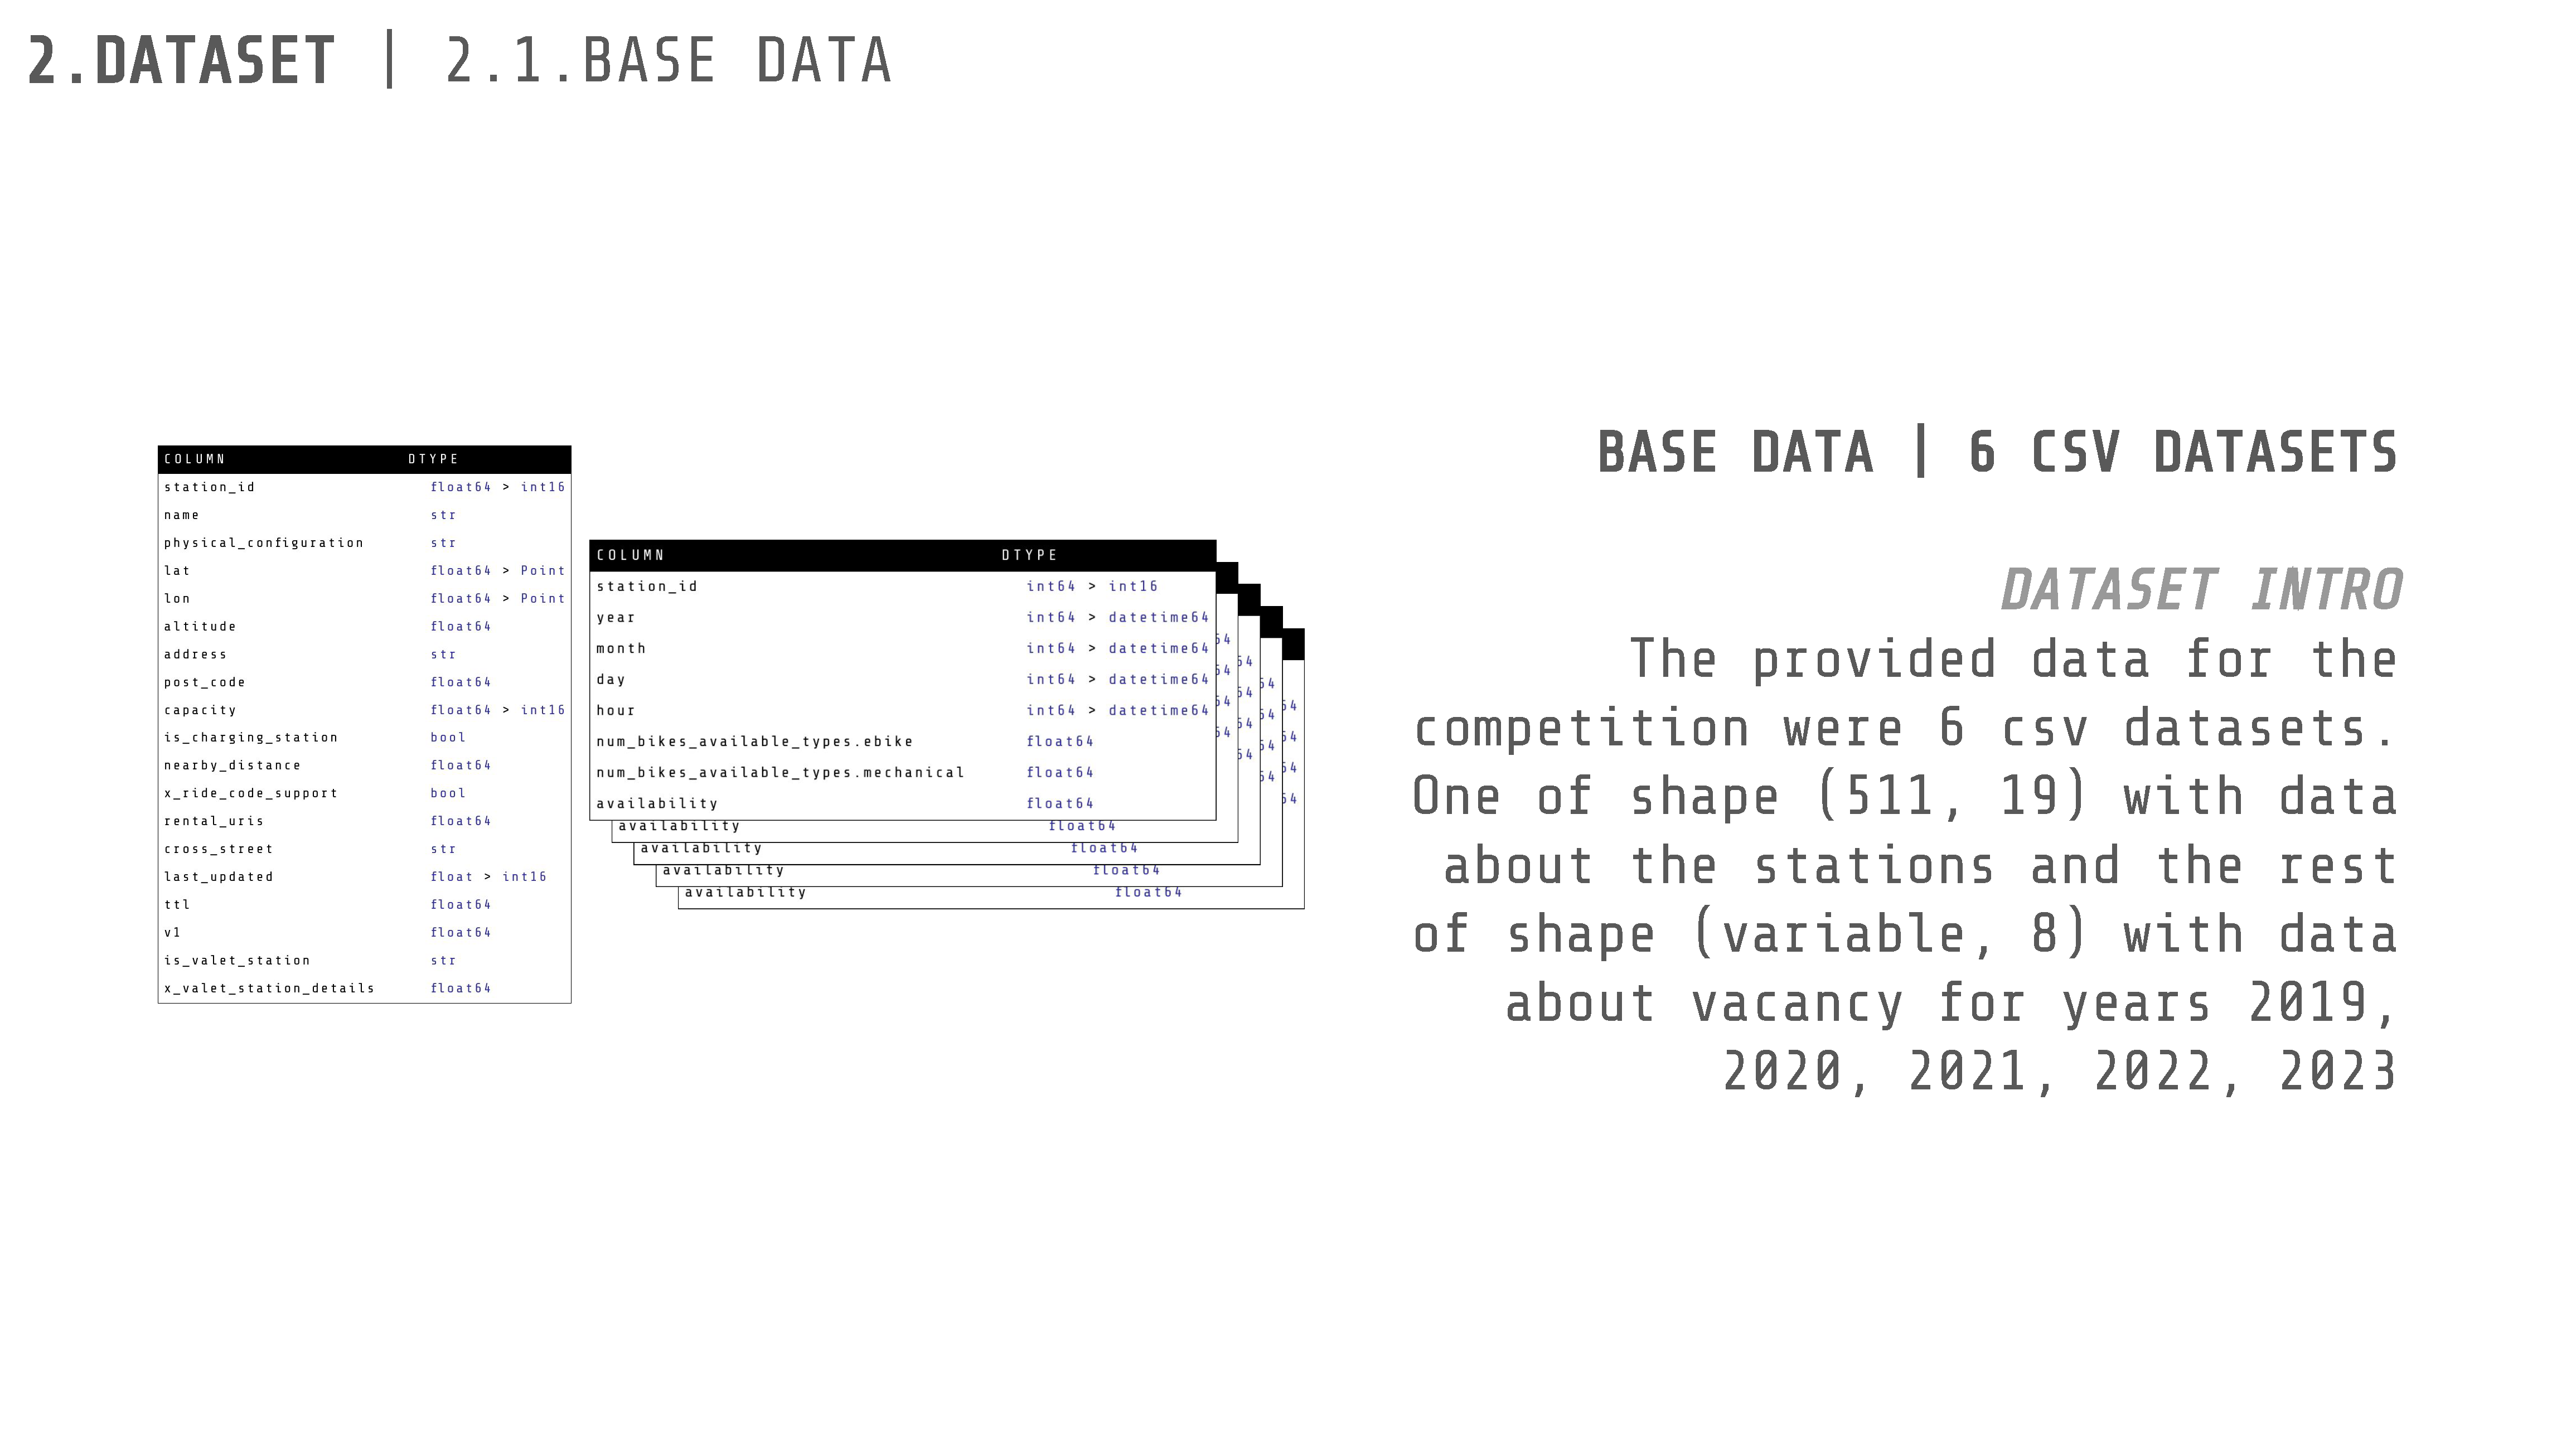
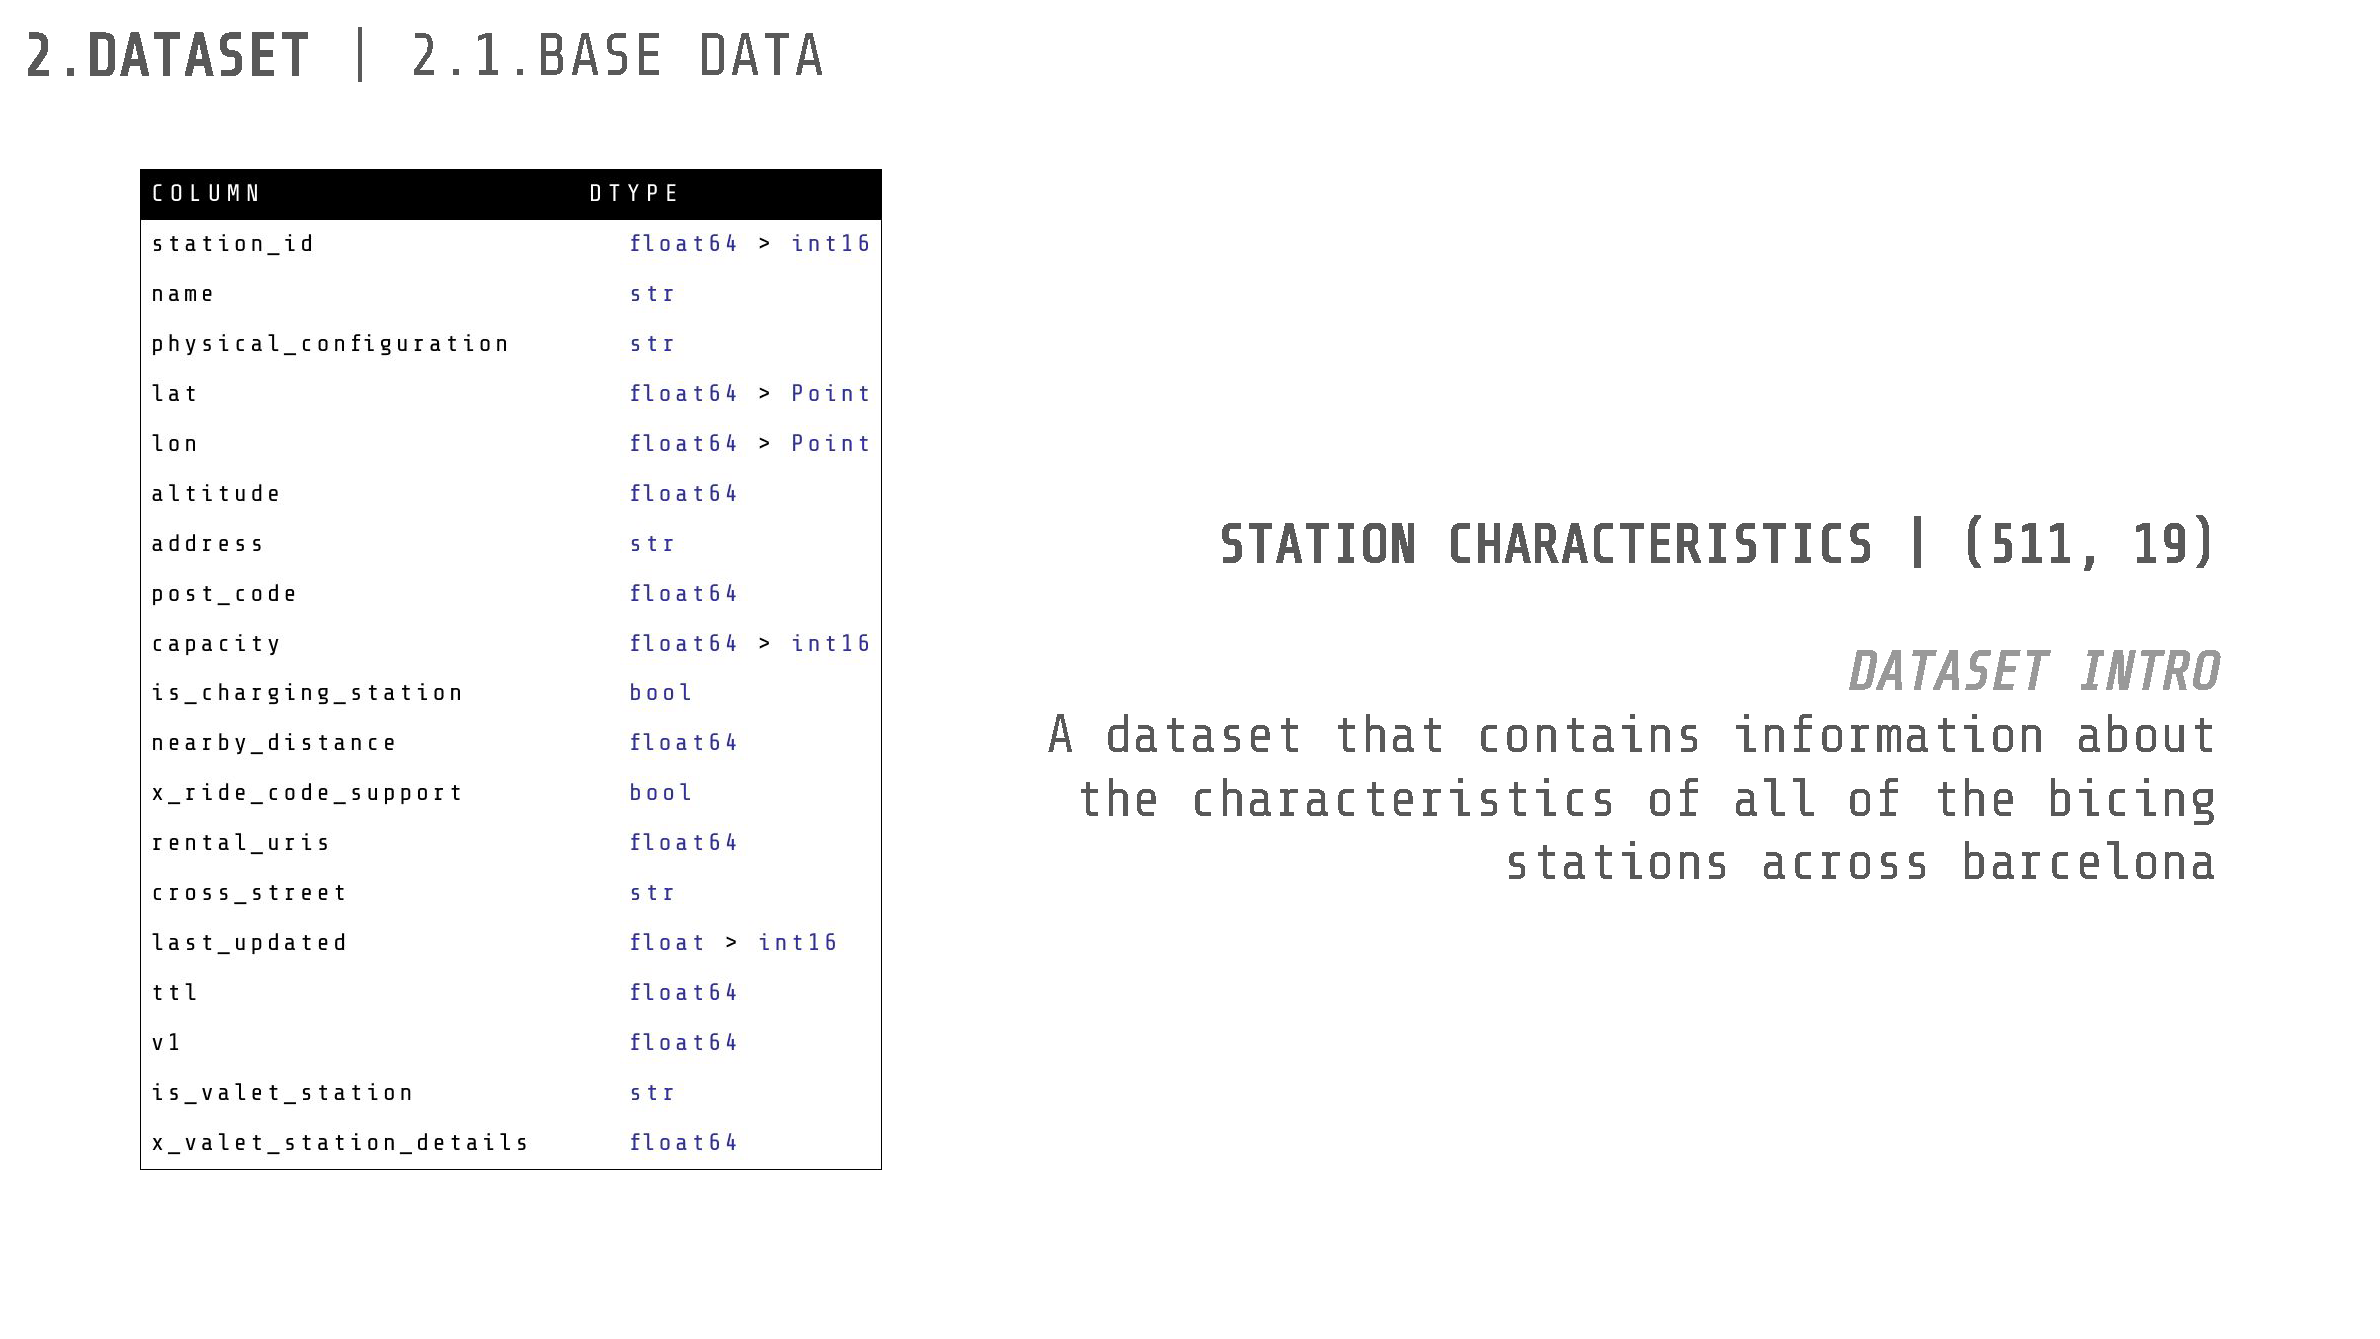
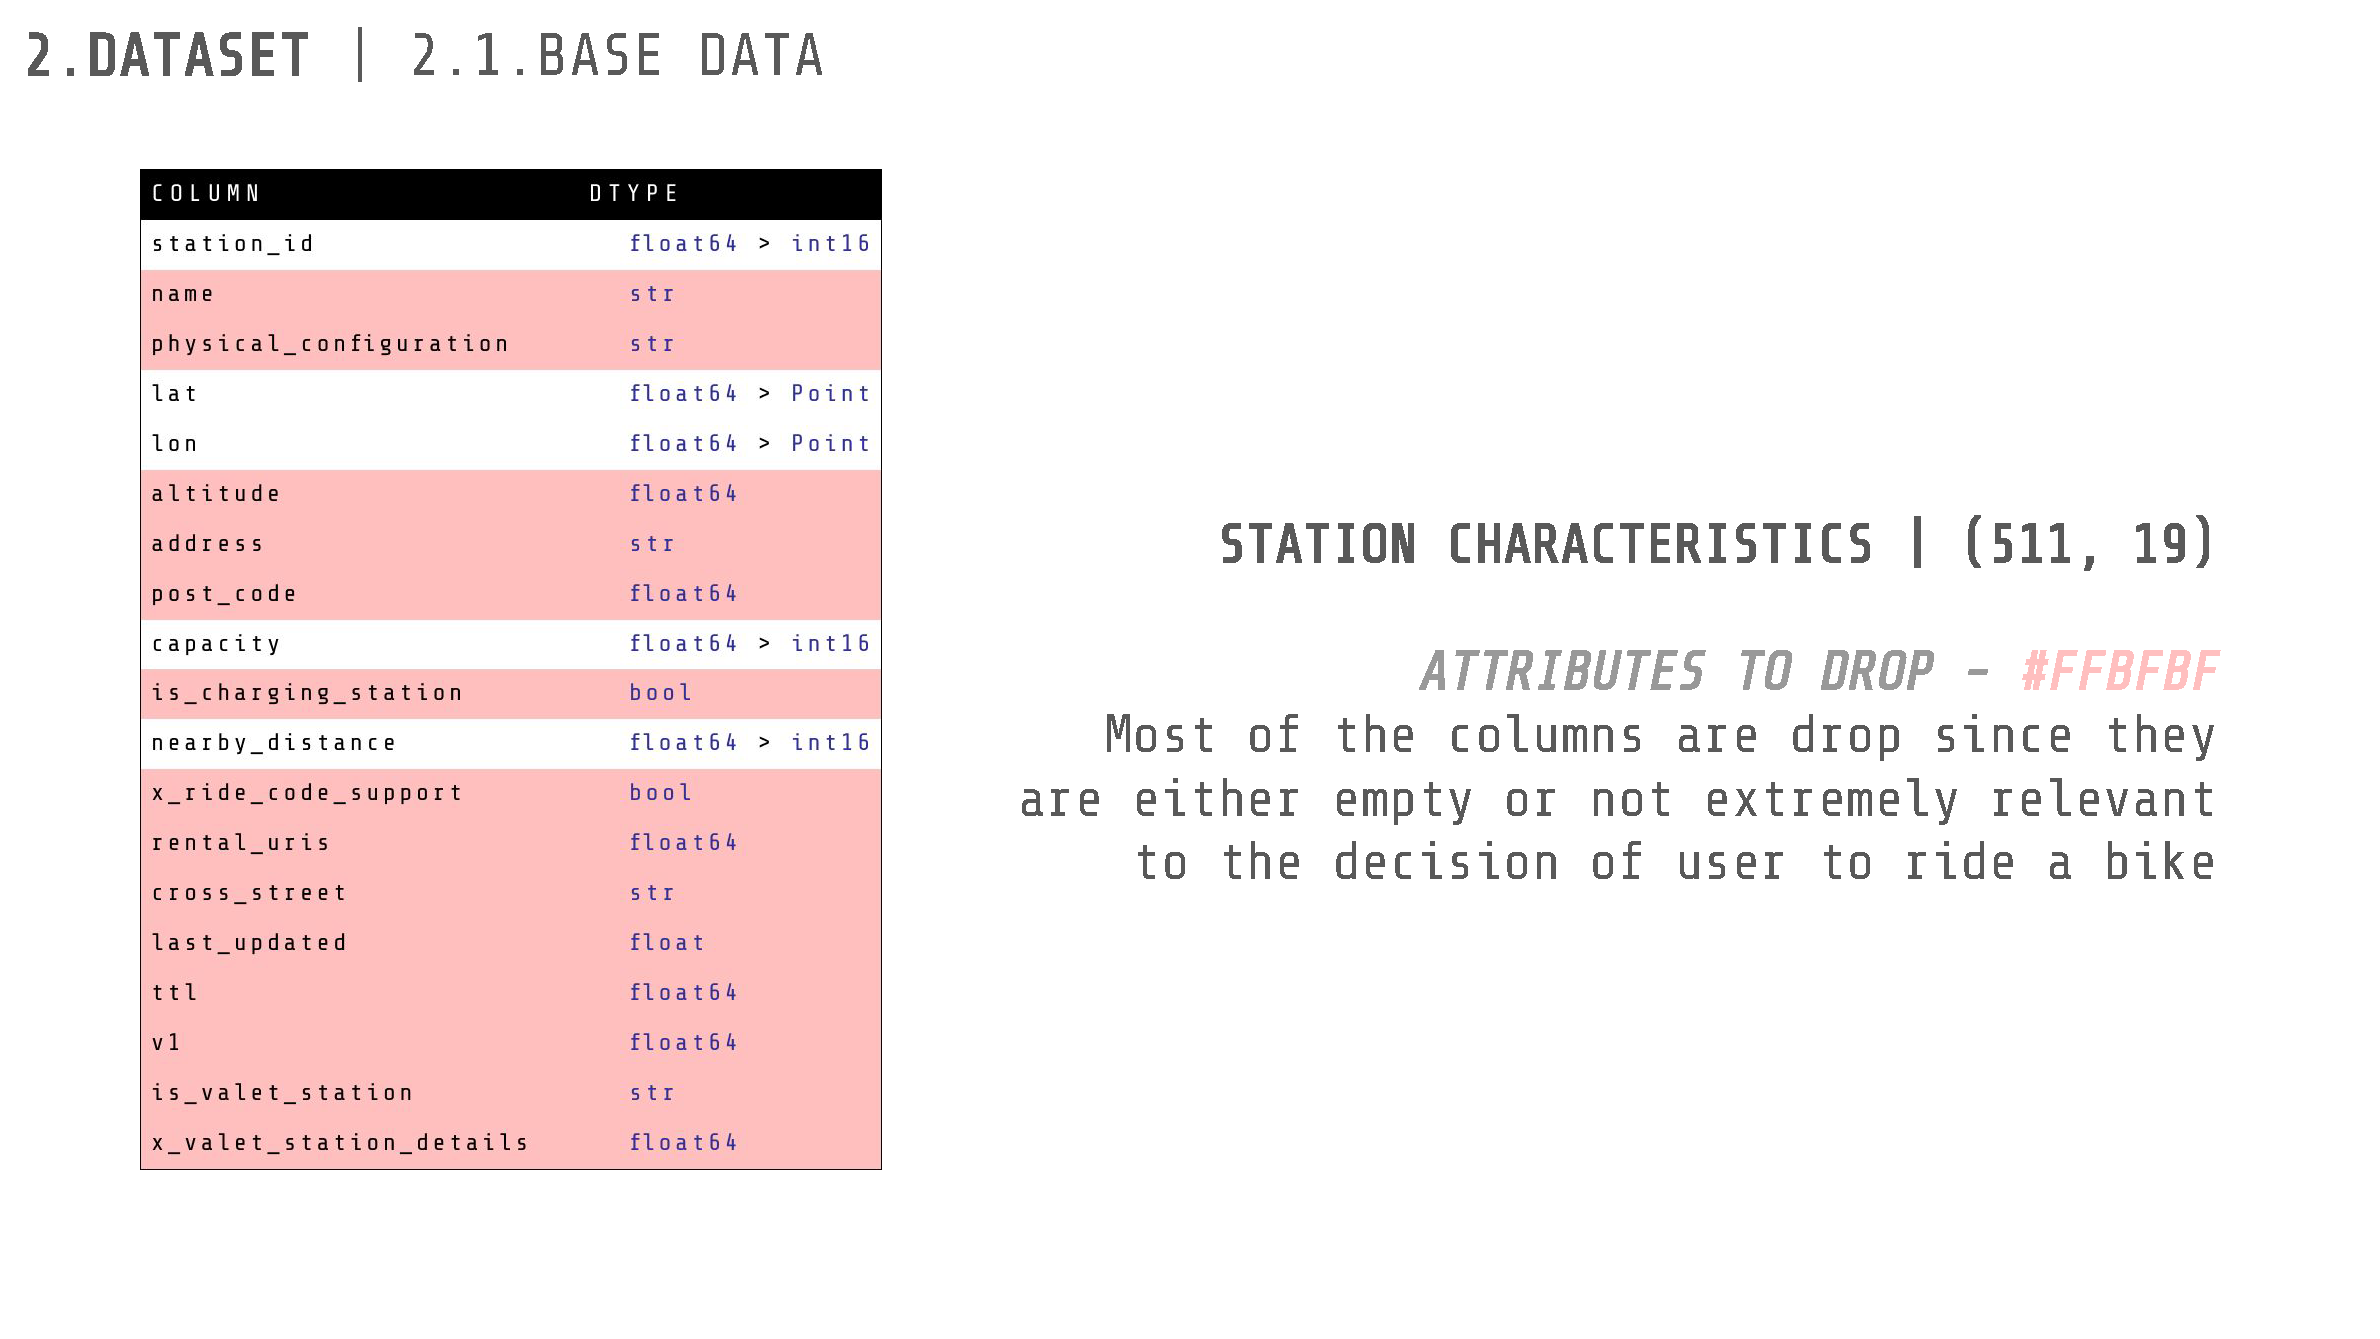
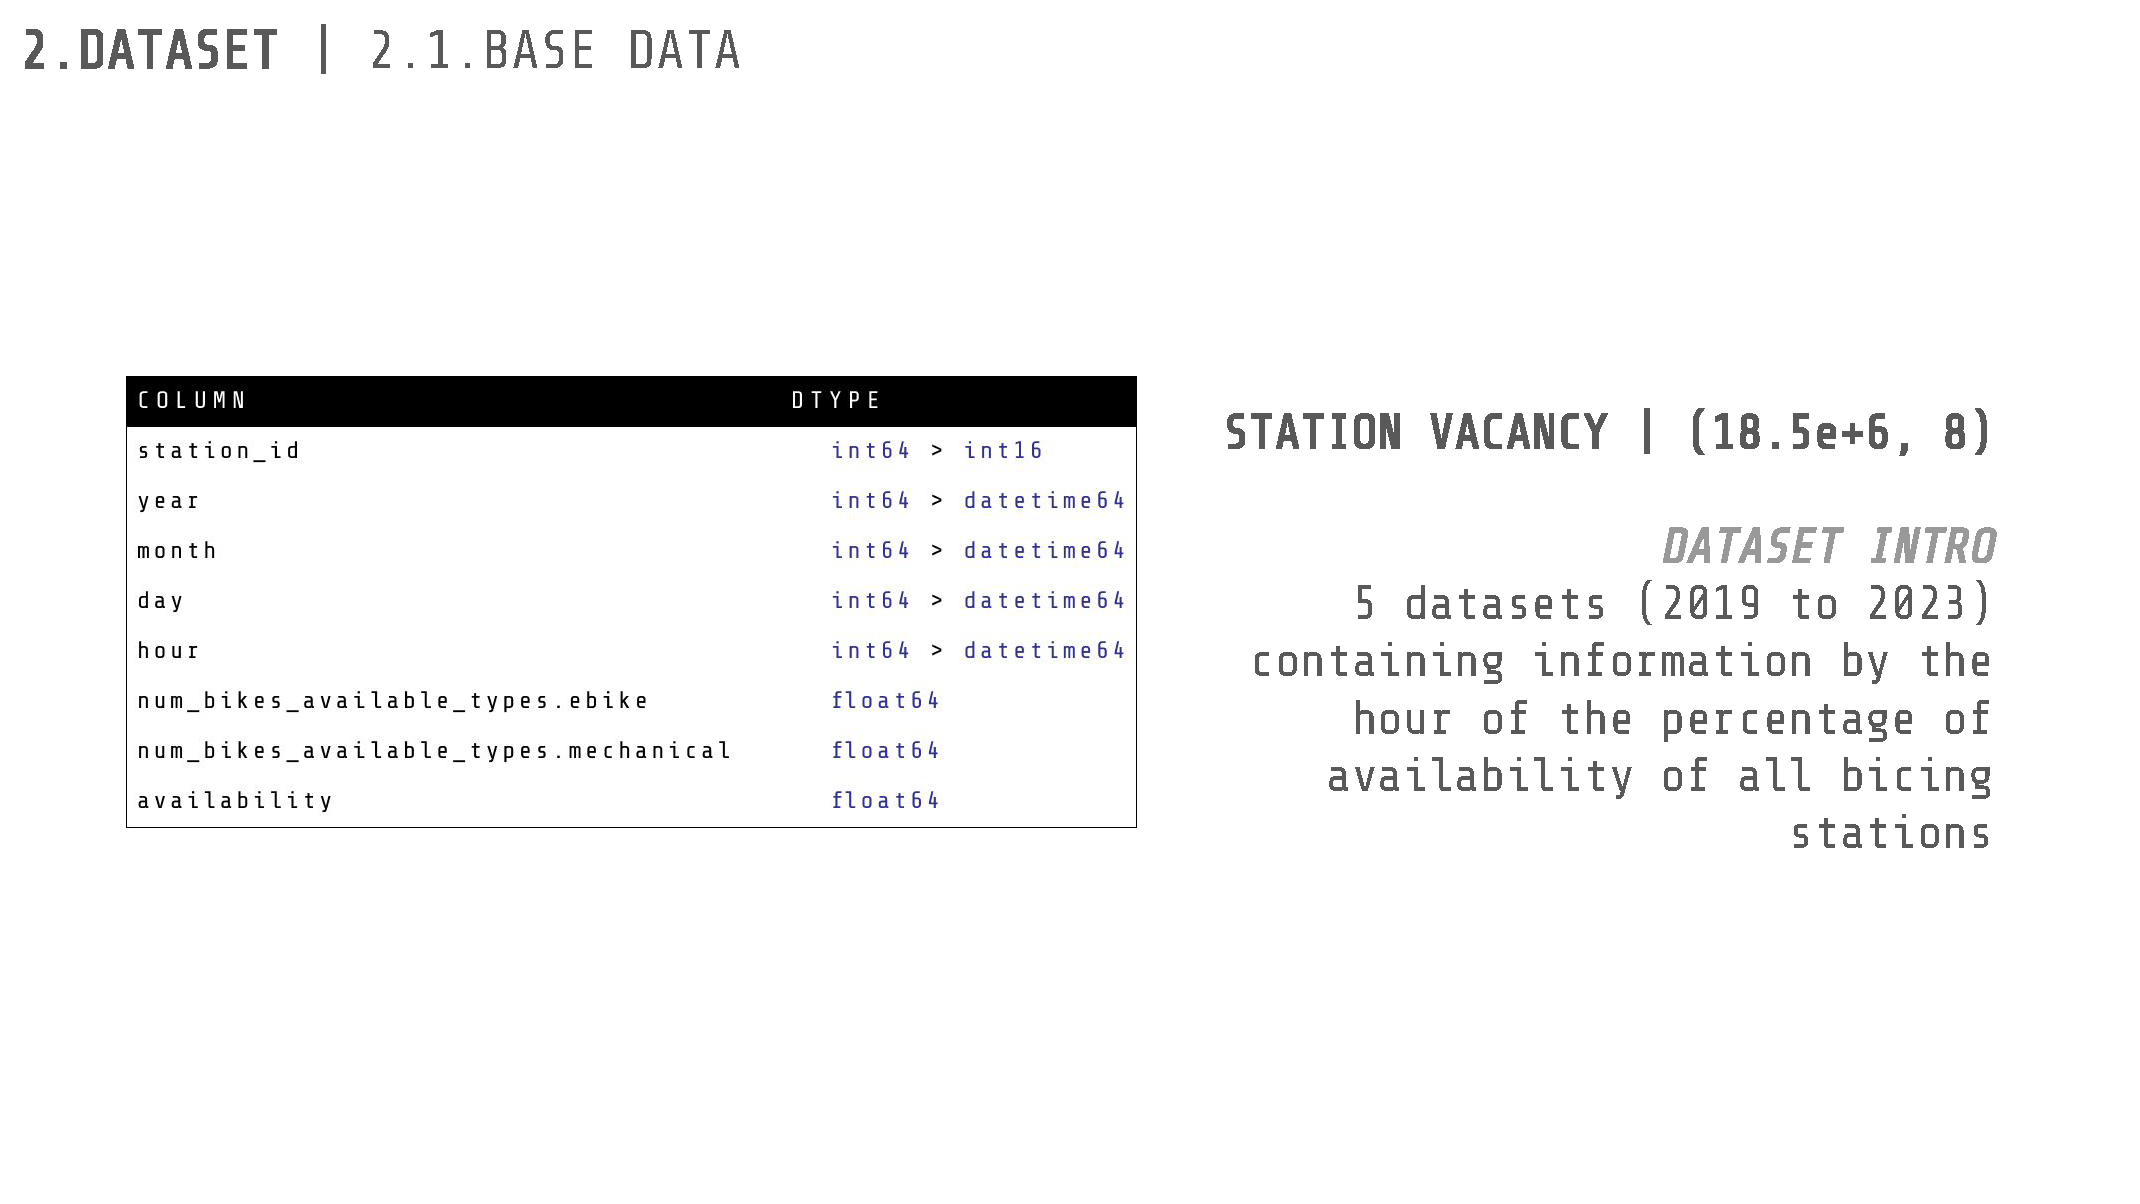
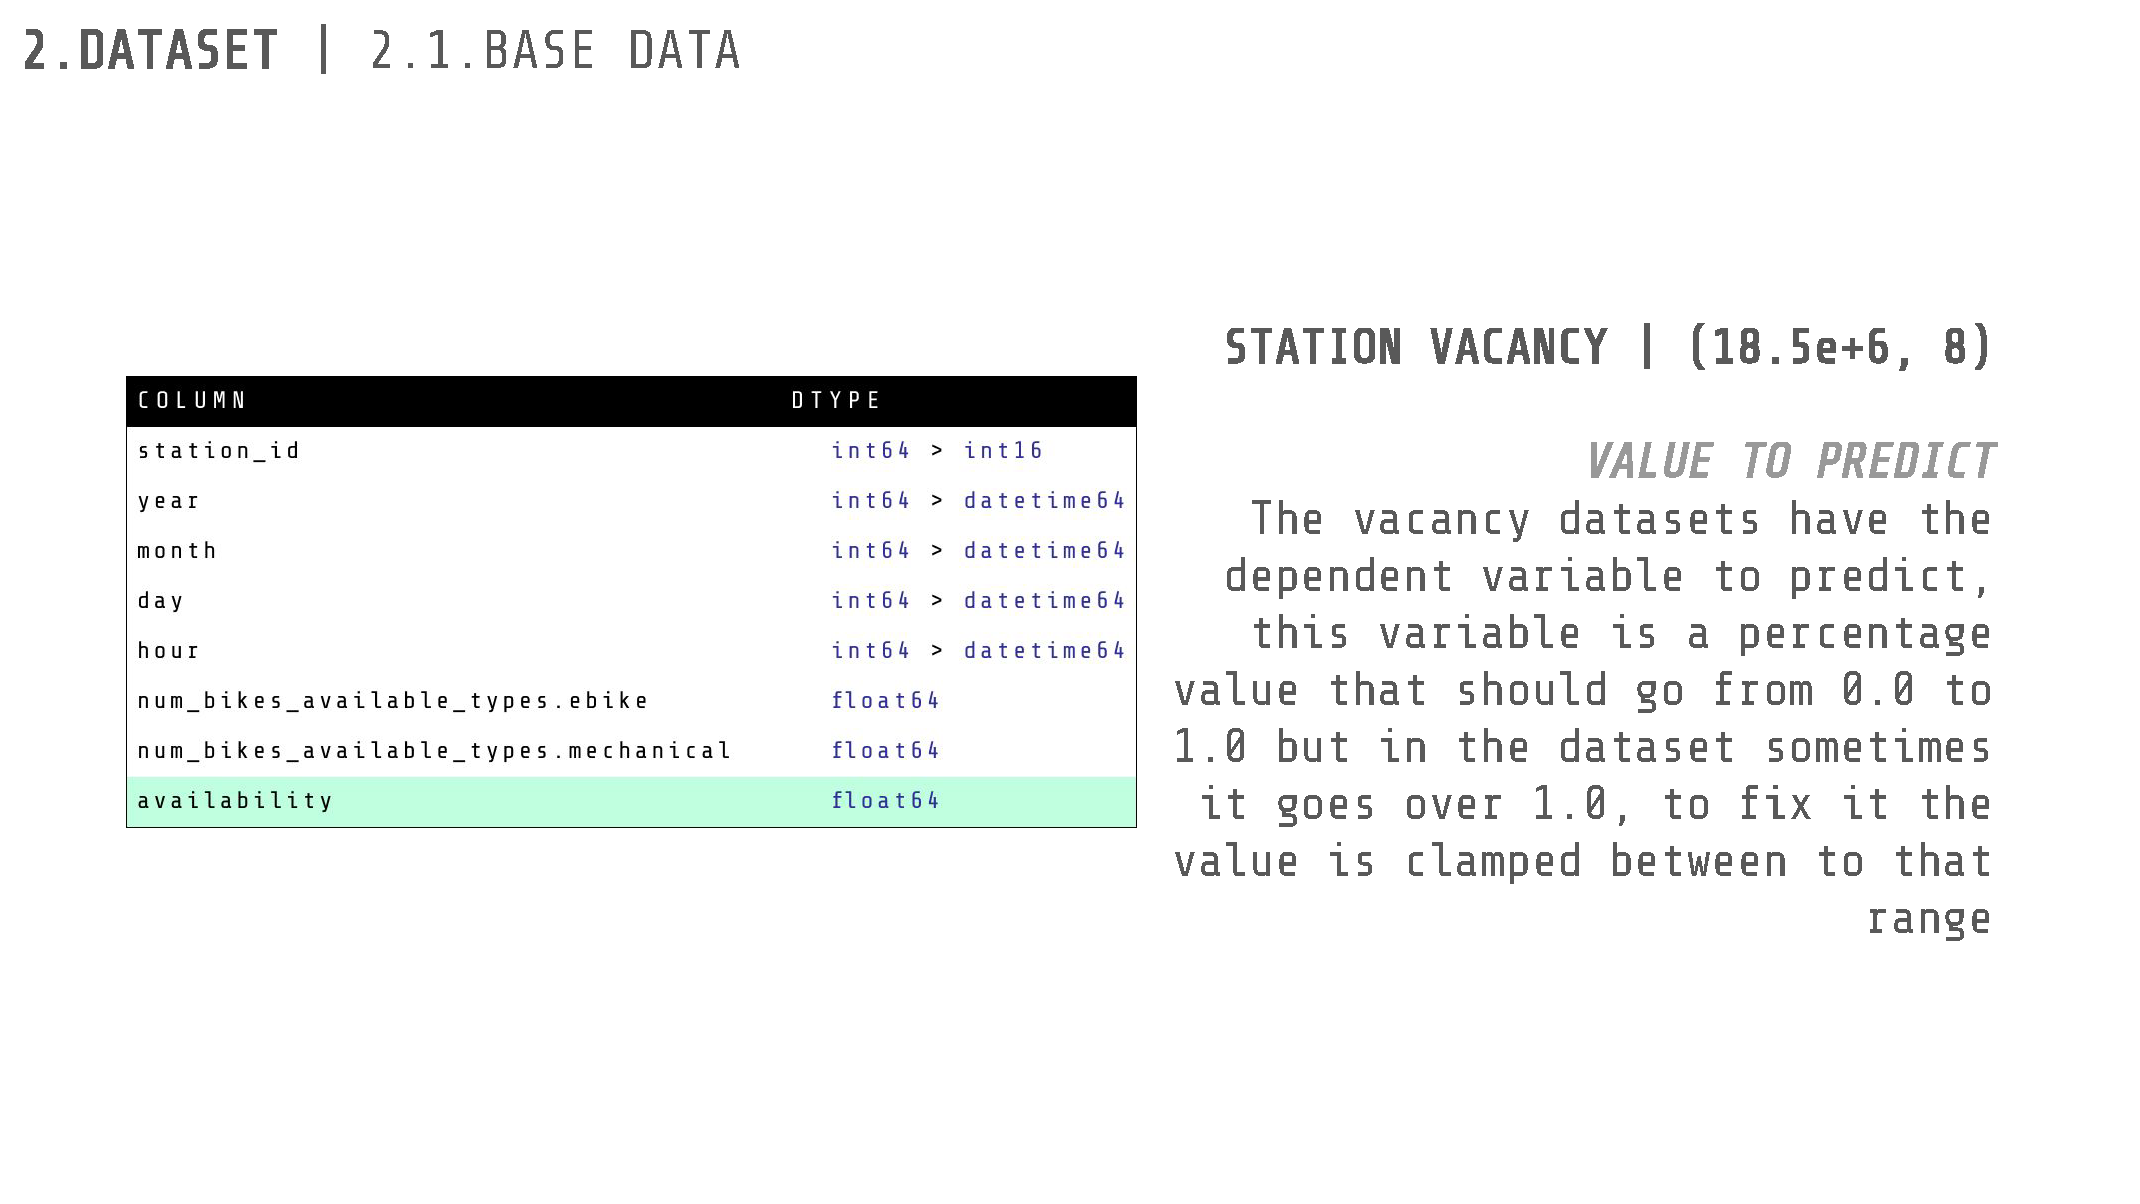
The provided data for this project included six CSV datasets. One dataset, with a shape of (511, 19), contained information about the characteristics of all Bicing stations across Barcelona. The remaining datasets varied in shape and contained data about bike availability from the years 2019, 2020, 2021, 2022, and 2023.
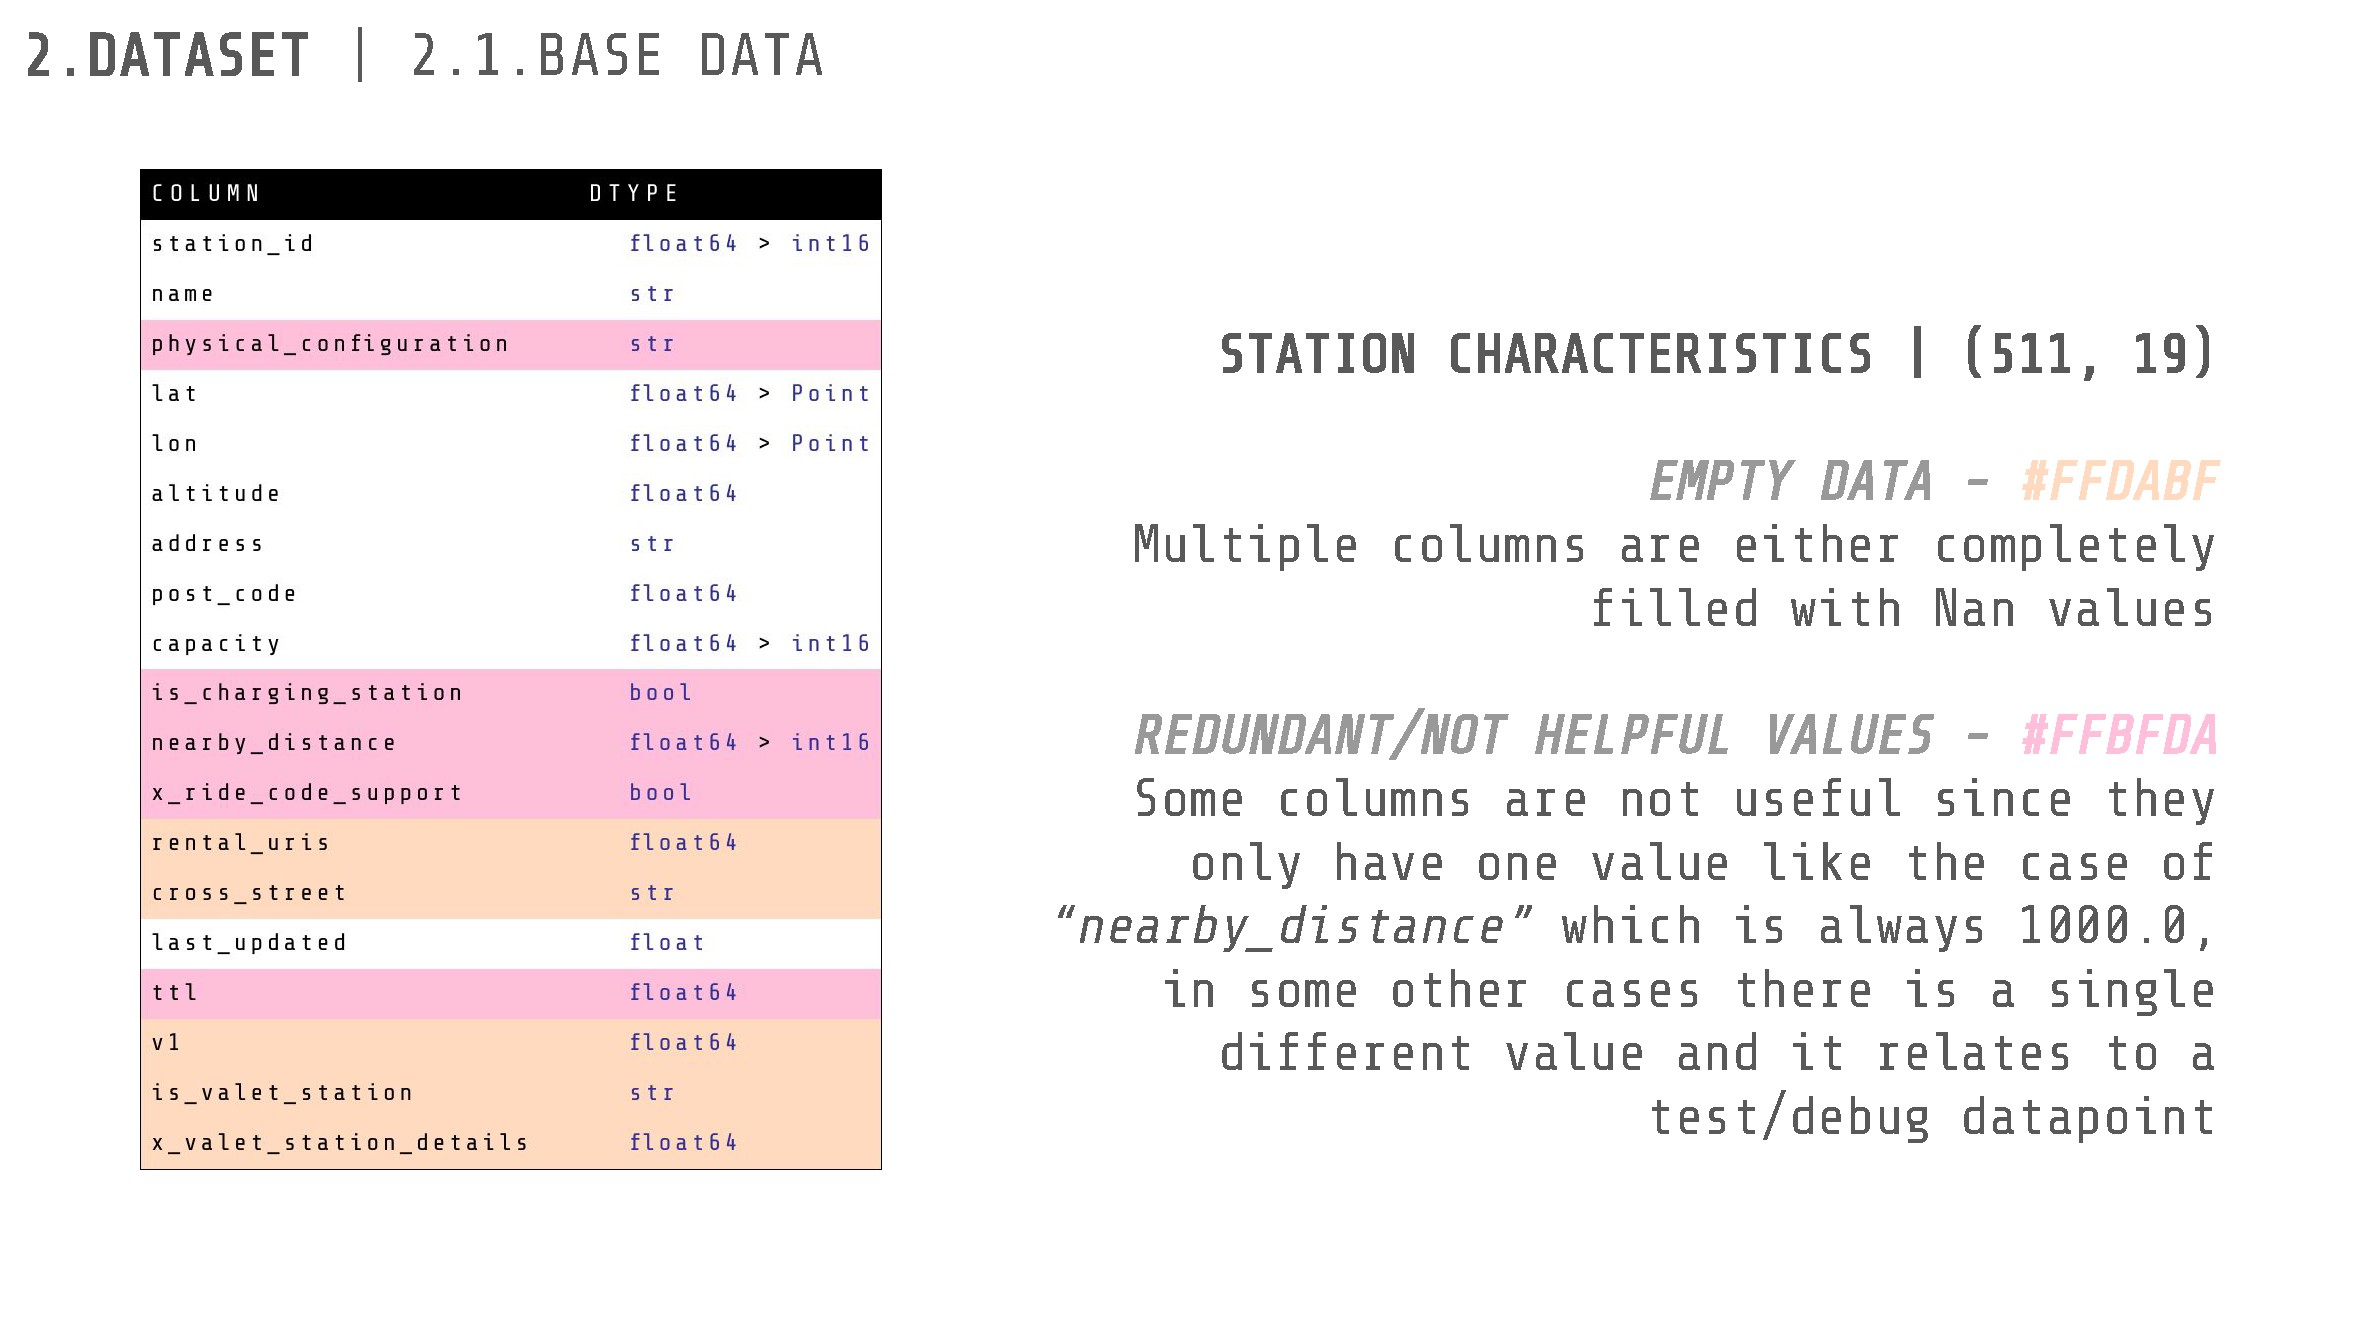
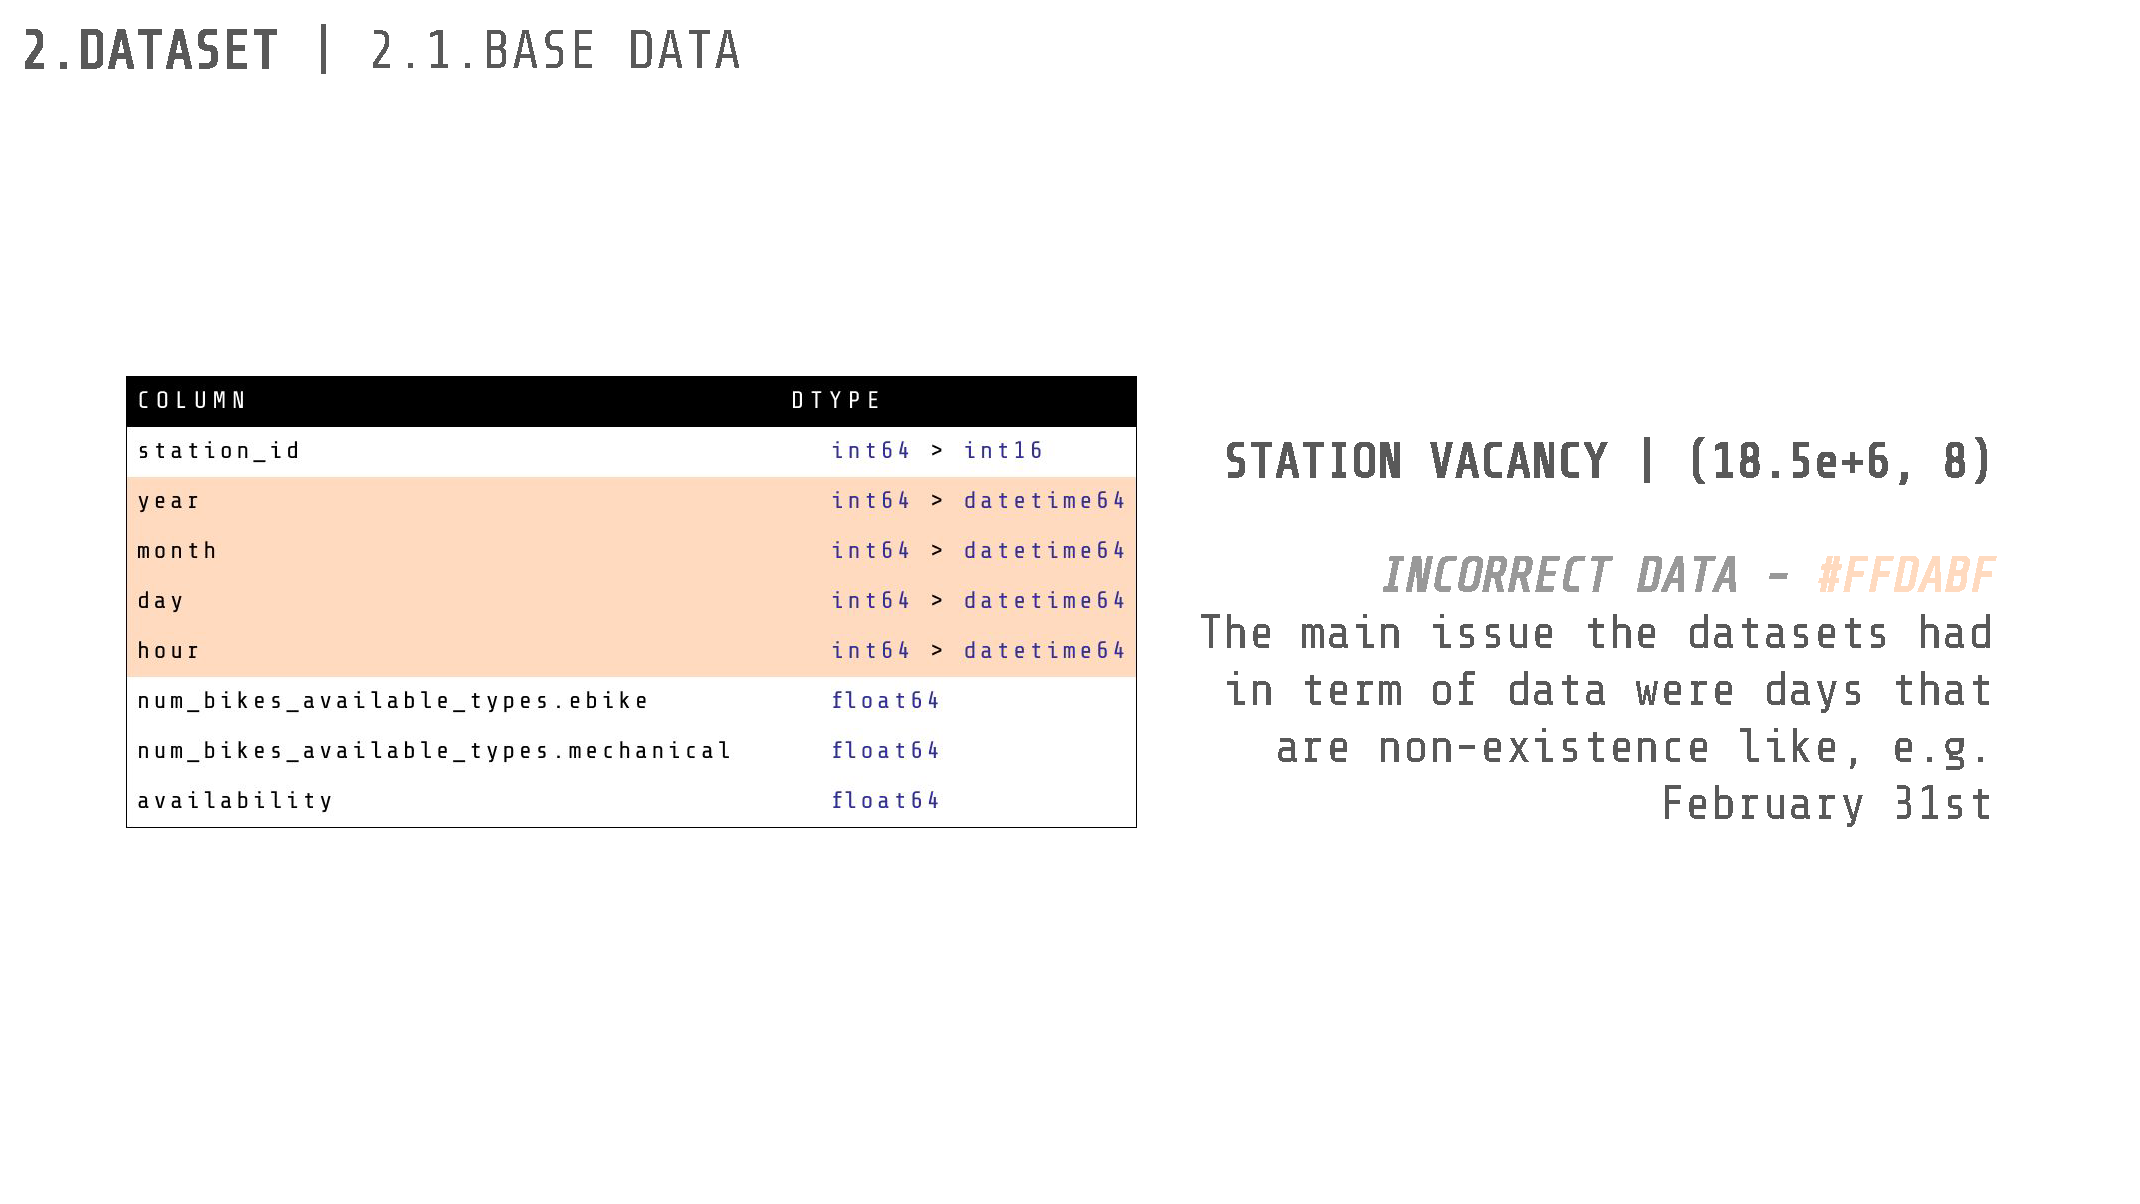
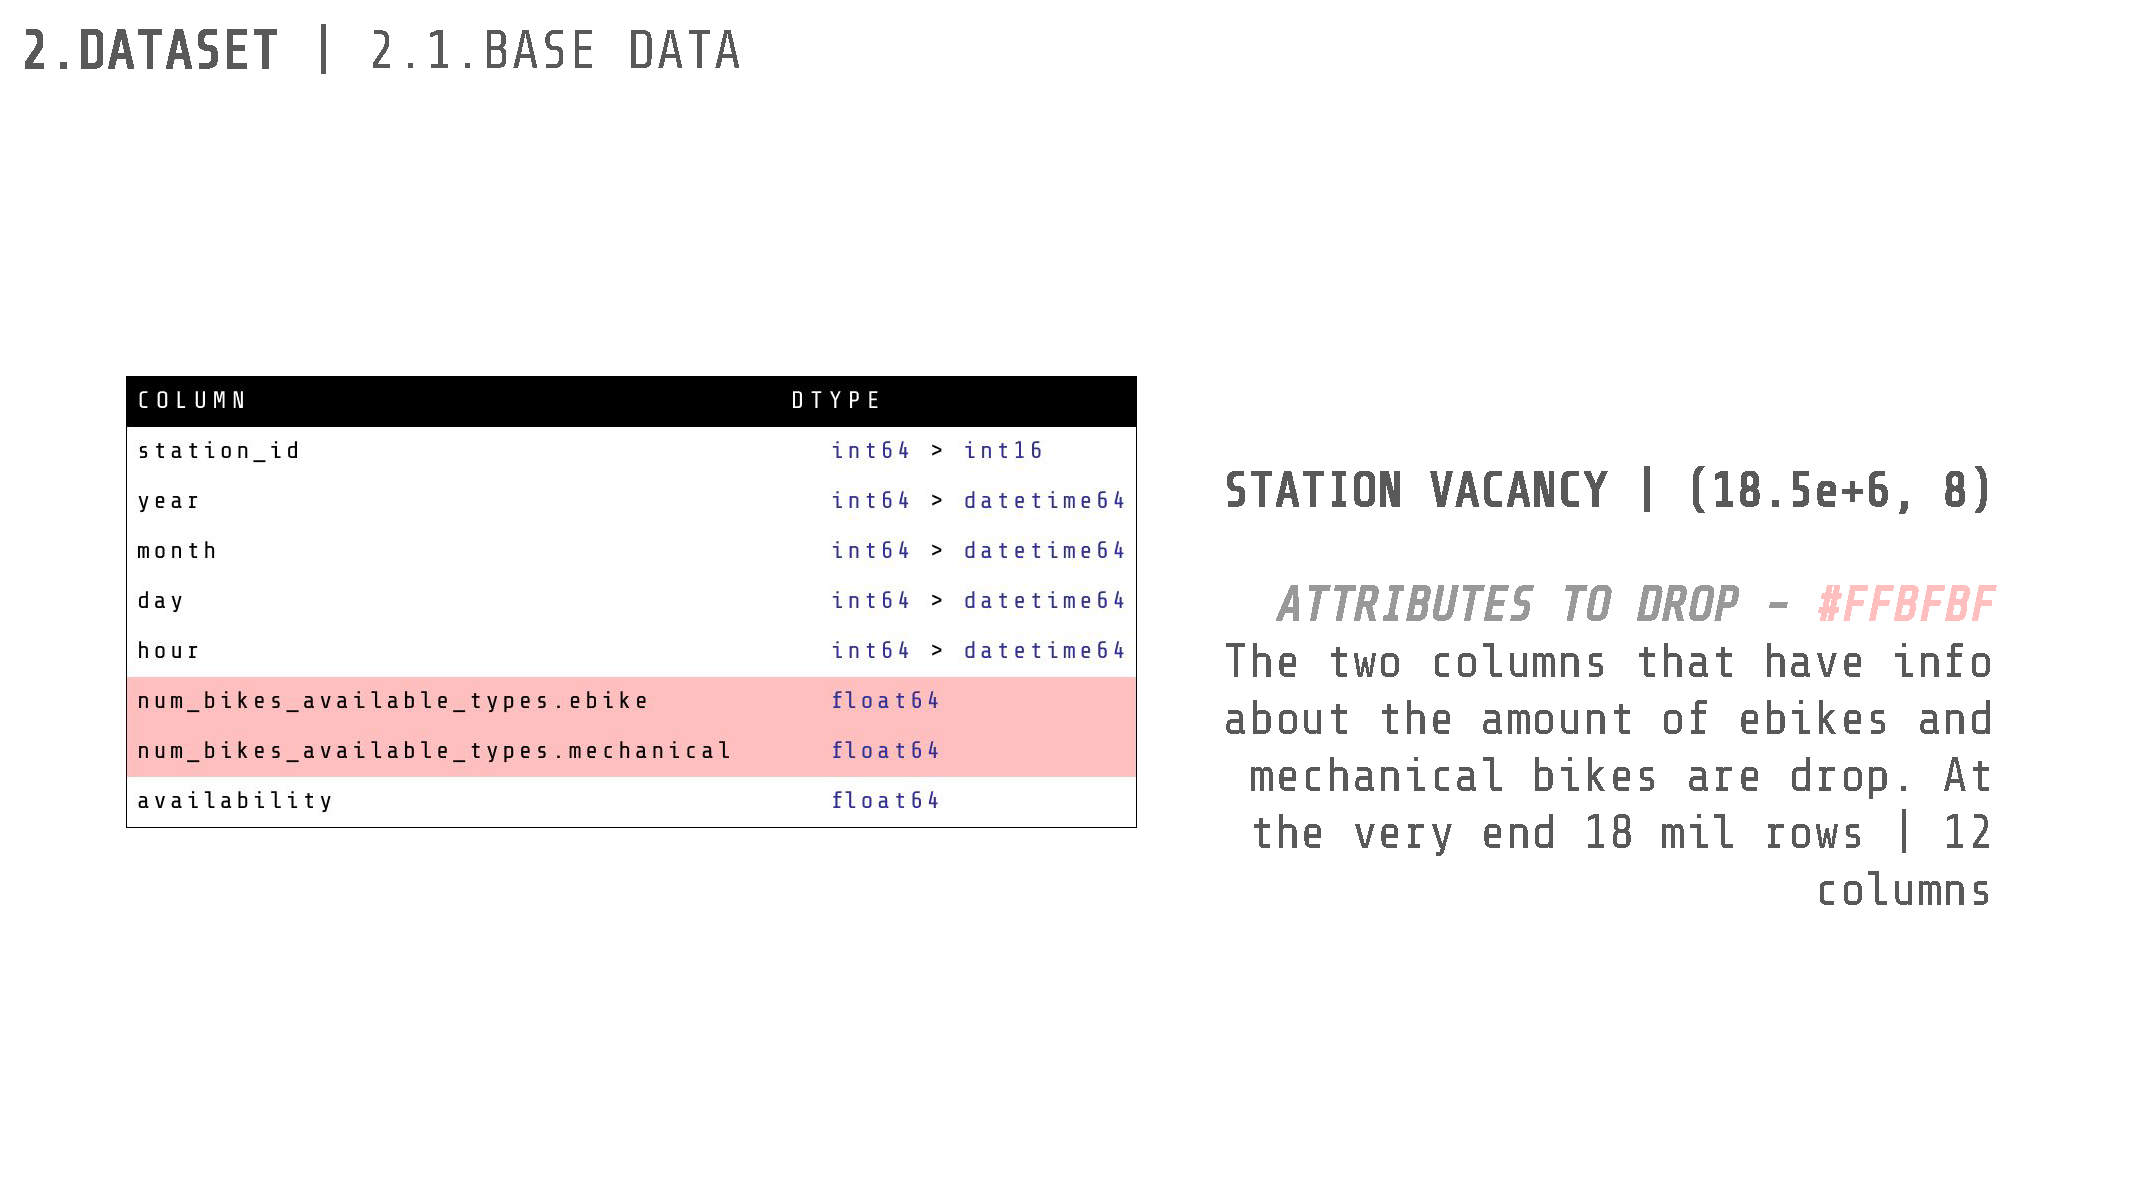
We began by cleaning the data. Multiple columns were filled entirely with NaN values and were therefore removed. Some columns were not useful as they only contained a single value (e.g., “nearby_distance” which was always 1000.0). Other columns had a single different value related to a test/debug datapoint. Consequently, most columns were dropped as they were either empty or not extremely relevant to the decision of a user to ride a bike.
Feature Engineering
To enhance our dataset, and in hopes to make the models that we train better at predicting the availability, we searched for extra information that is pertinent to the use of bikes in barcelona. This new added information can be categorized into temporal information, or information that is given in relation to the current time, and geographical information, or information that depends on the surroundings of the Bicing stations.
The temporal data that was gathered and added as new features for the prediction is:
- Day of the Week.
- Holidays.
- Weather Data
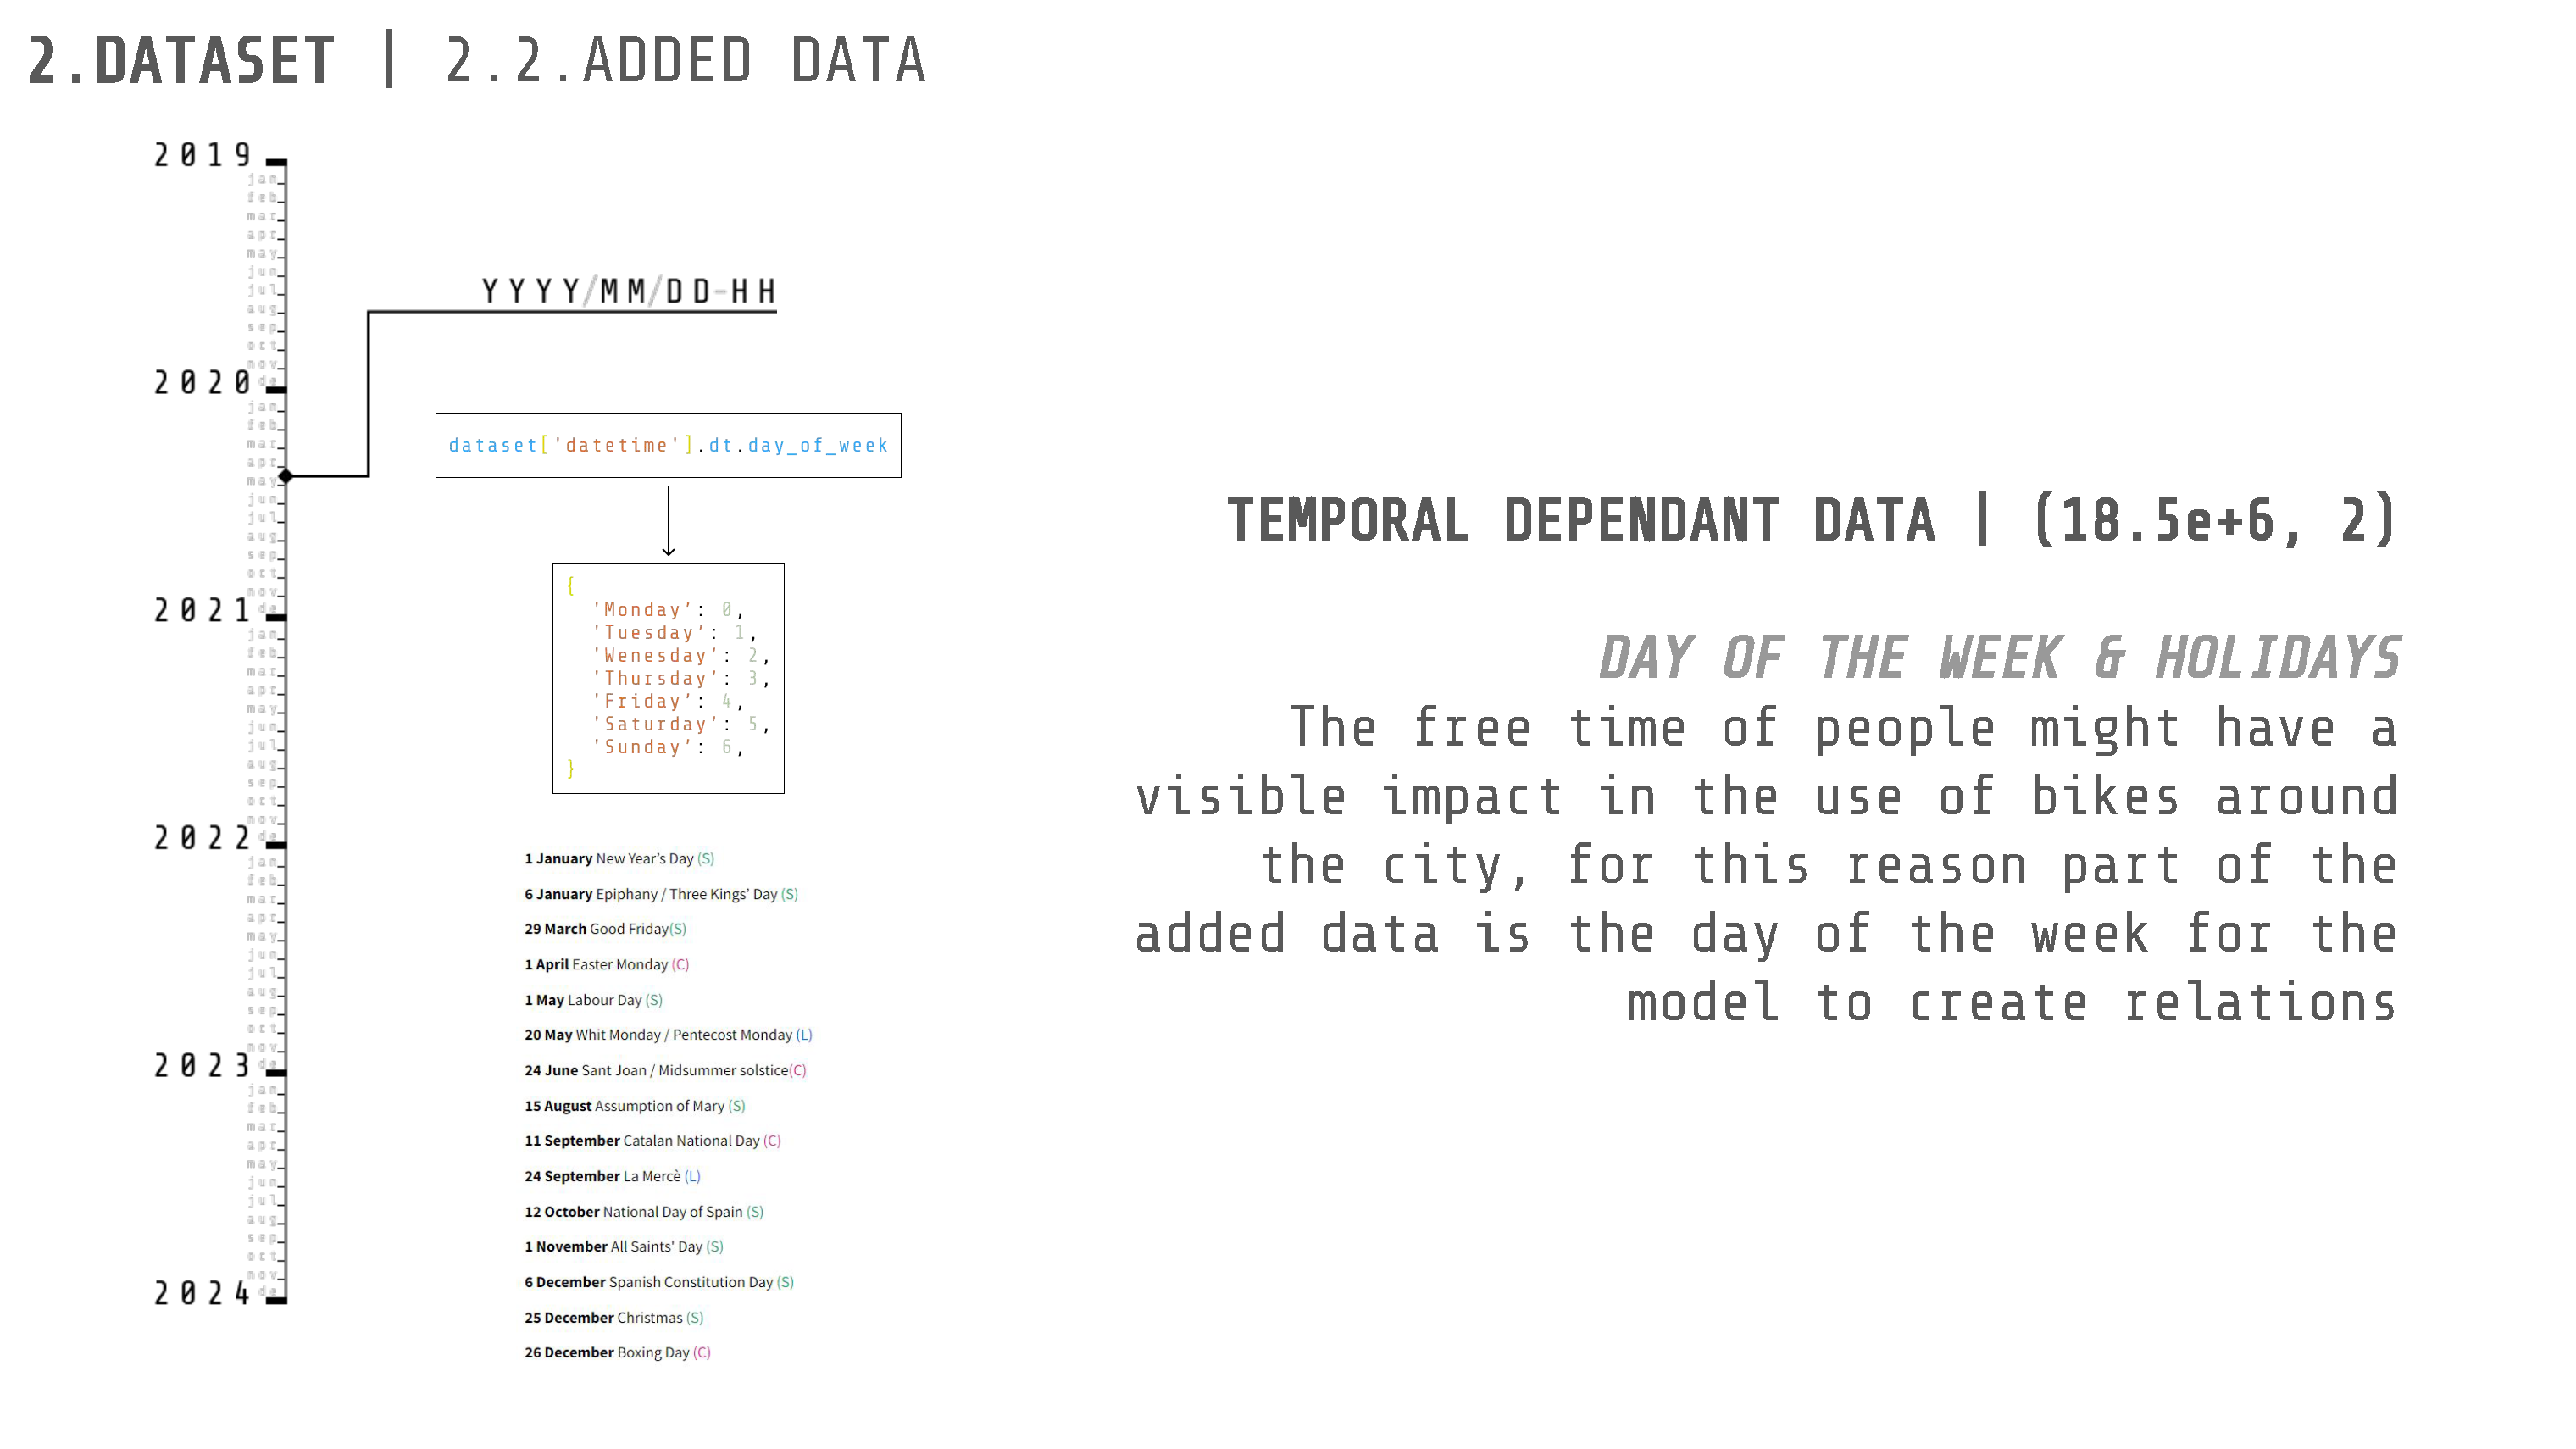
To get the information about the day of the week, the built-in methods that python has for dealing with dates & times, allowed us to convert a date into a named date of the week. Meanwhile for the holidays each date was checked against a non-working days & holidays csv provided by the government of catalunya.
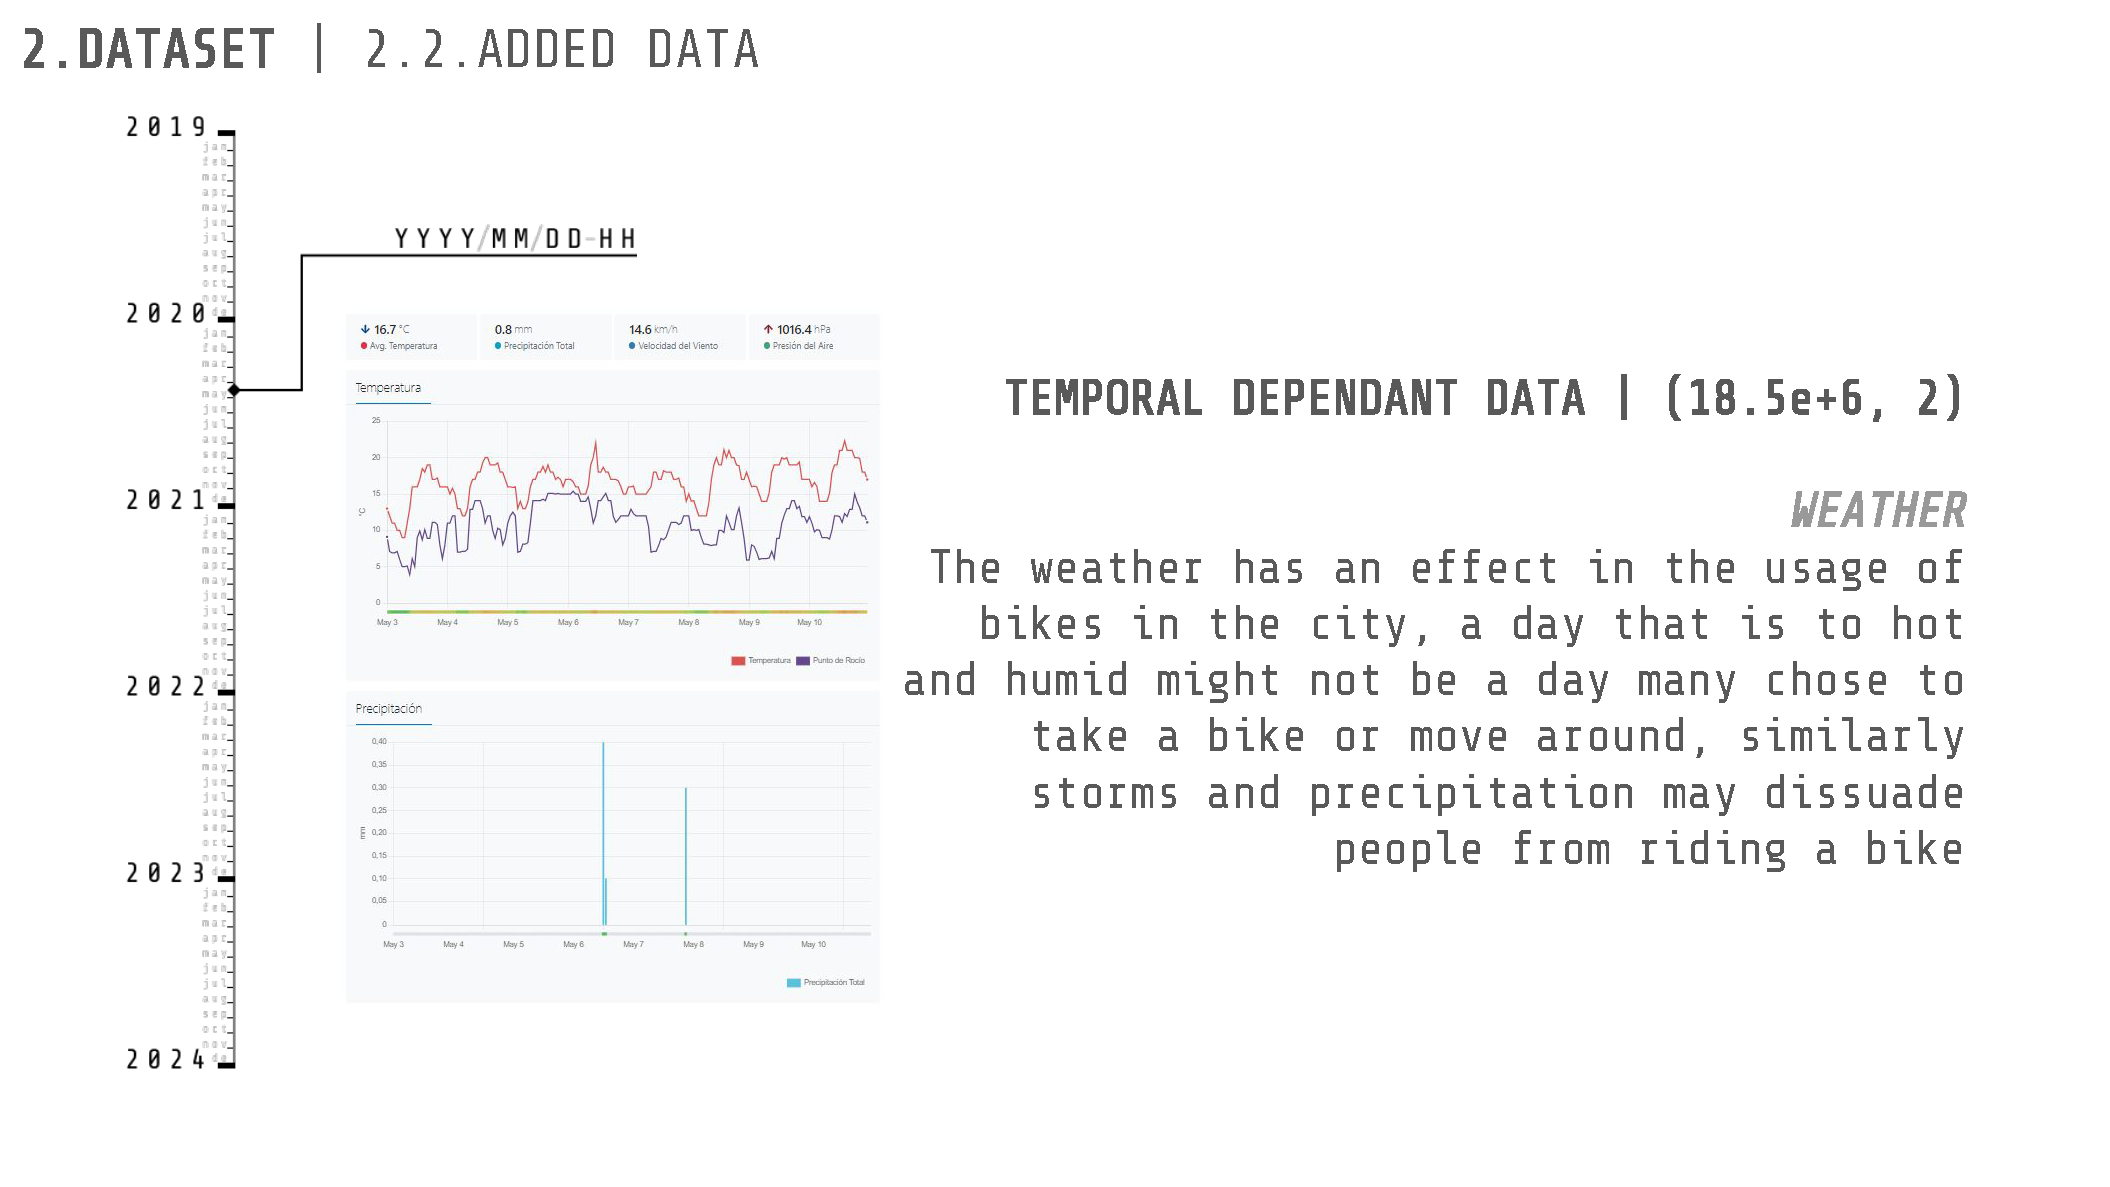
In the case of the weather data, specifically the temperature, humidity and precipitation information, the Metoestat API was consulted to get the climate for each of the datapoints on the dataset.
On the other hand the geographical data that was added as independent variables for the prediction area:
- Slope.
- Population & Average Age.
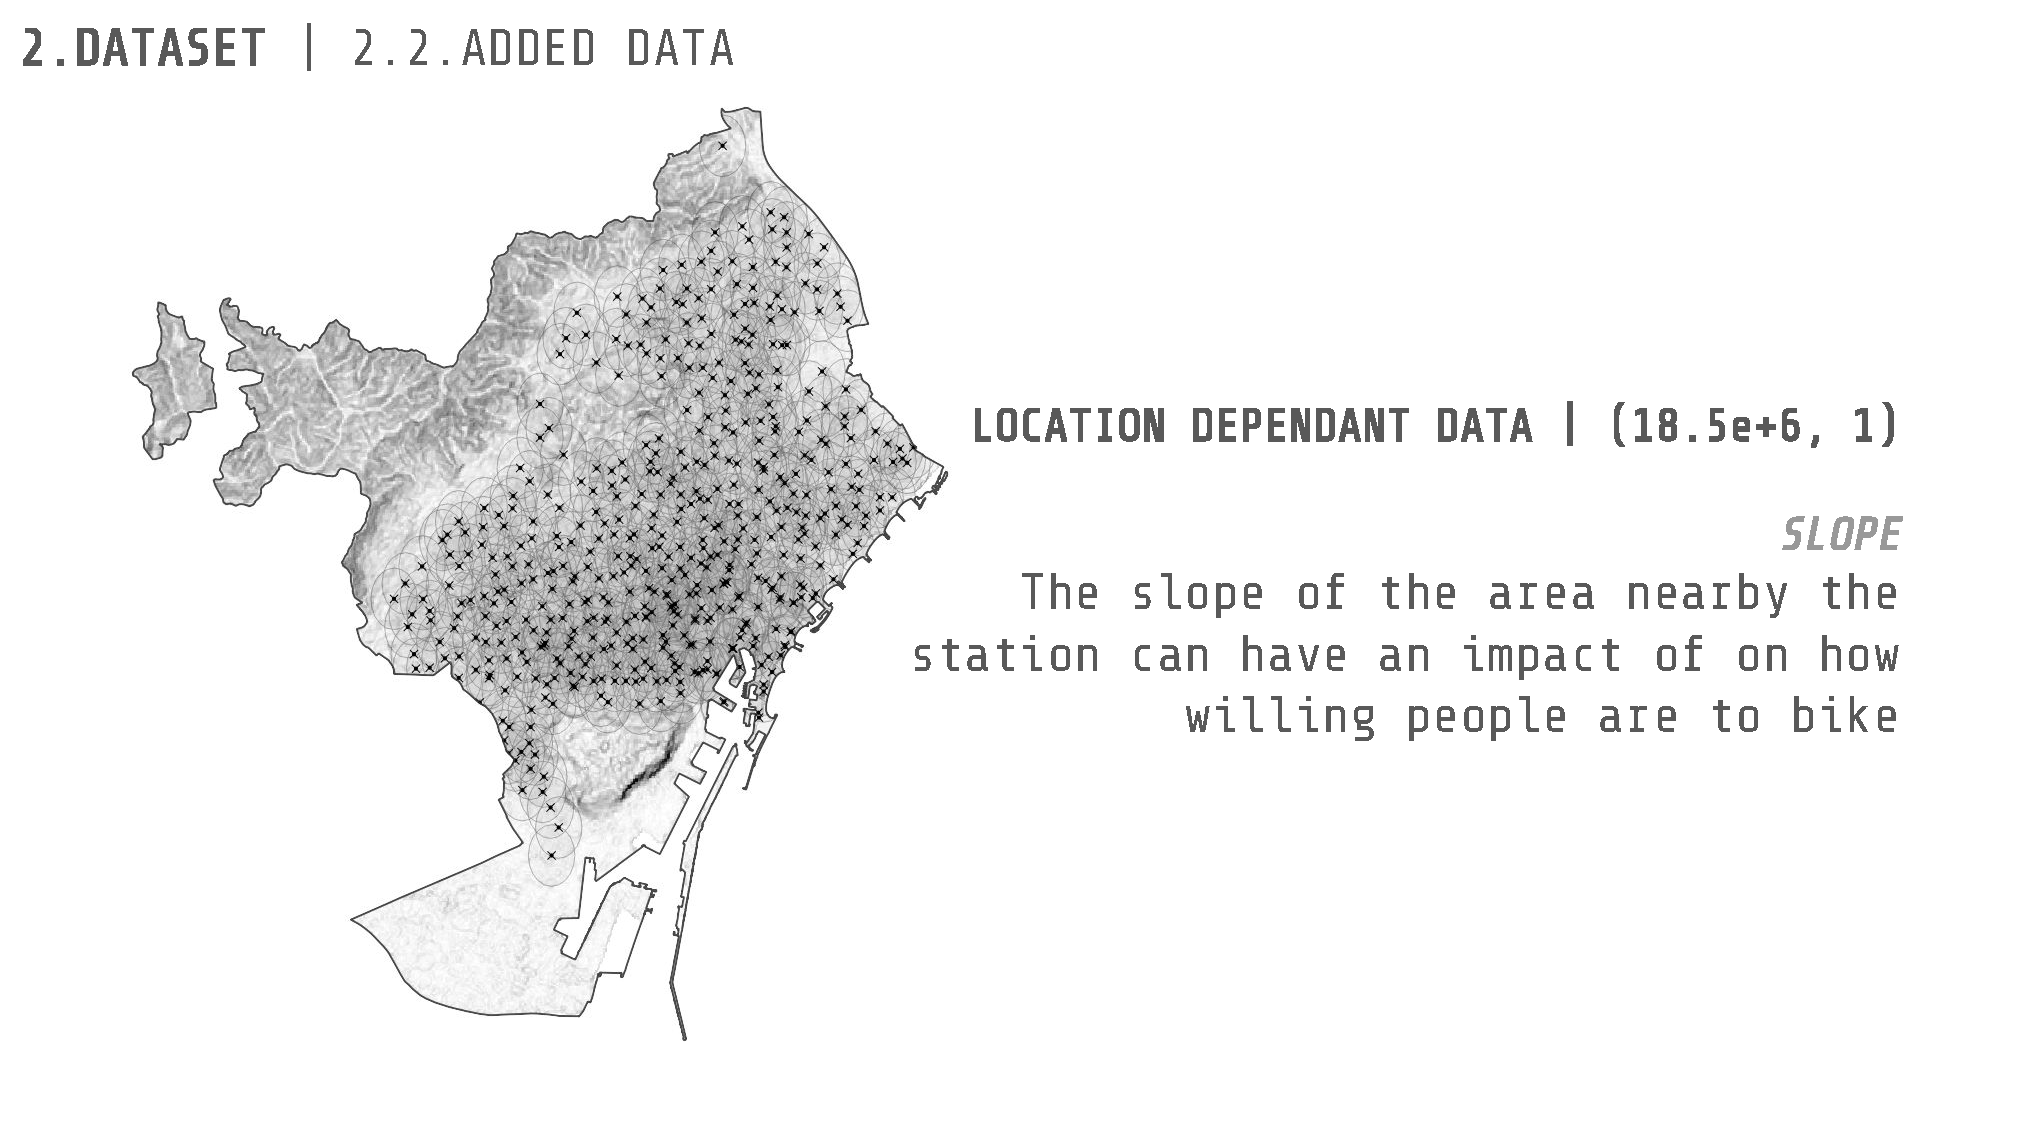
To get the slope for each of the stations in the dataset, the python libraries of rasterio & rasterstats were used. With them it was possible to open a DEM model with the slope information of Barcelona and then get the average values of the slope within a buffer of each station.
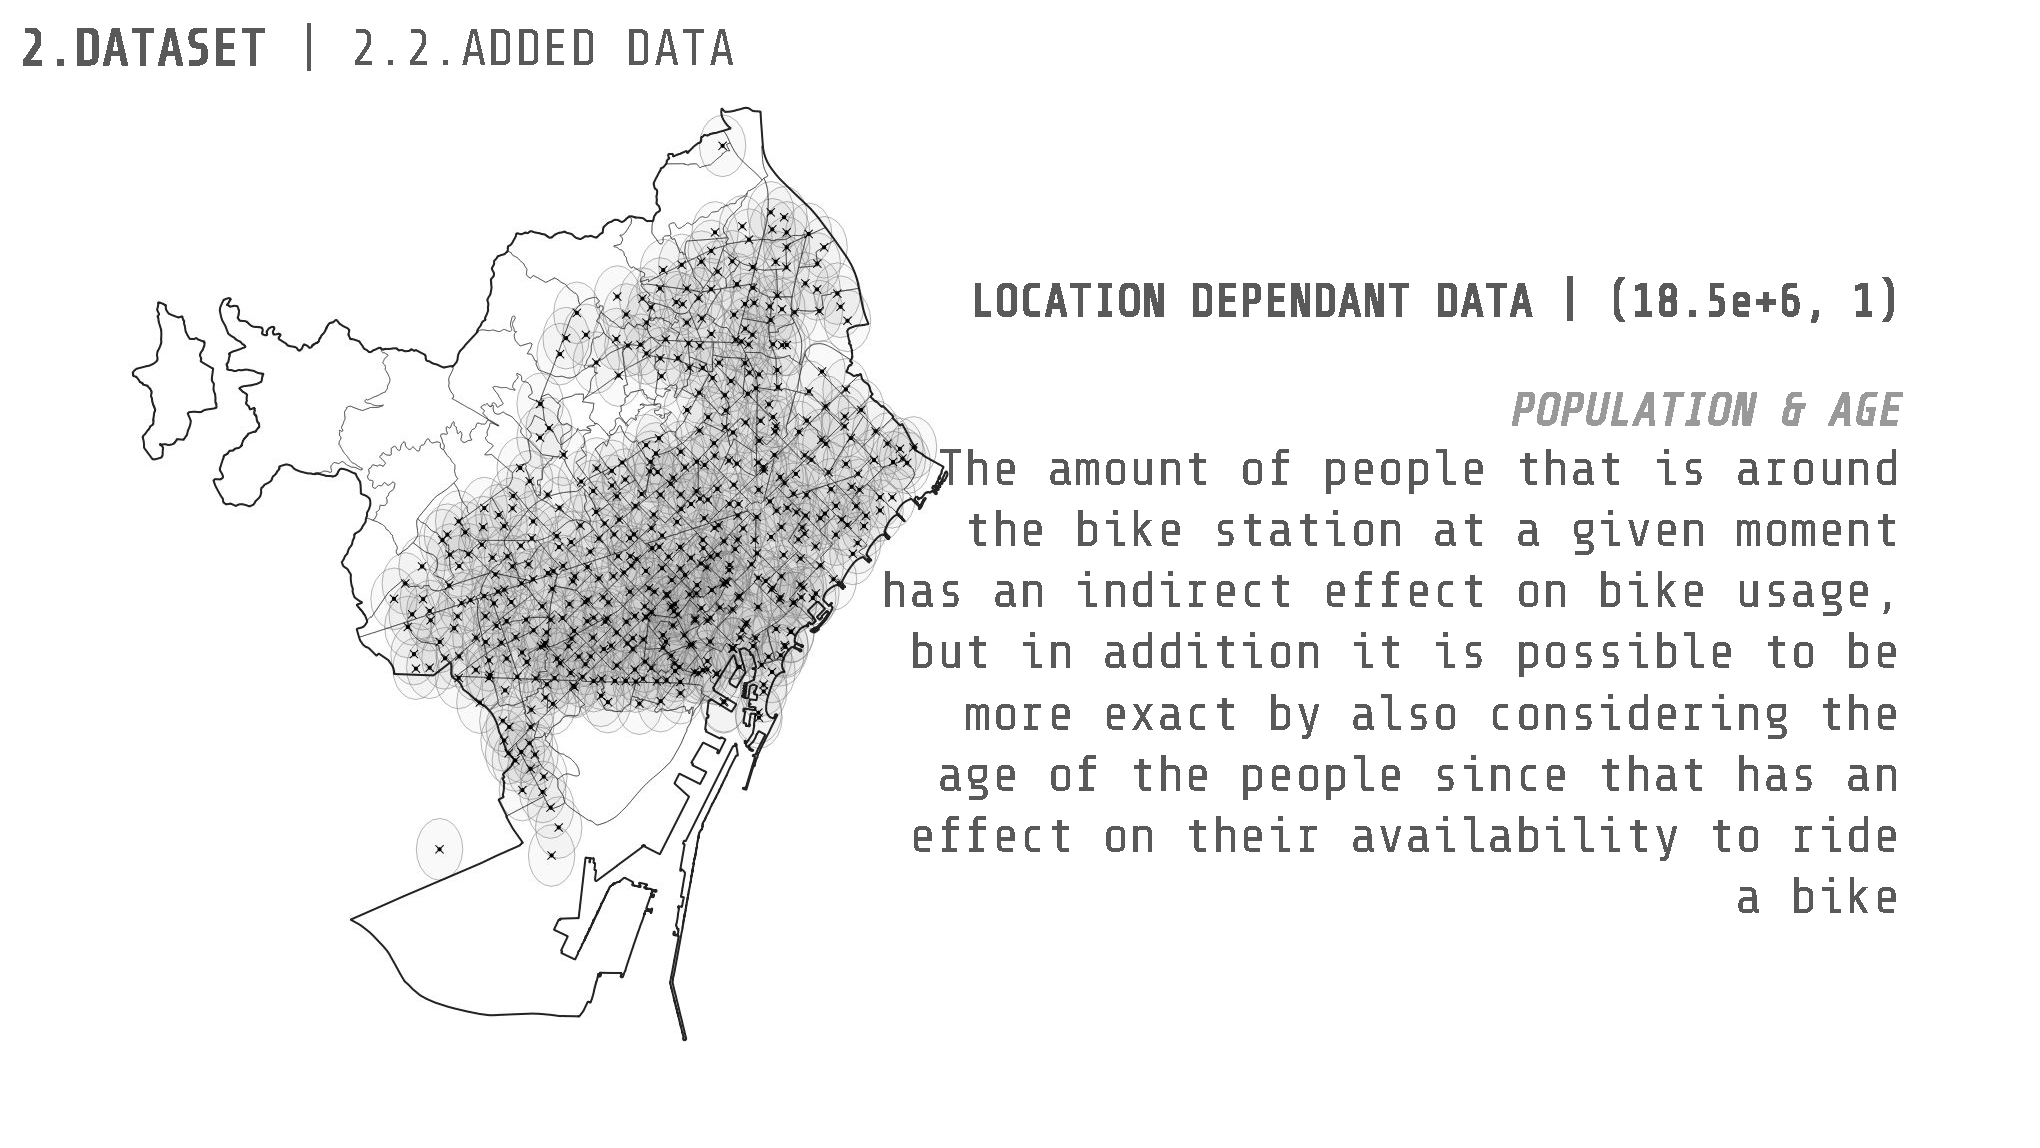
To get the information about the population and its average age, we approximated the value by overlying buffers of each of the Bicing stations with the censal sections and later used the overlay area to estimated the population in that circle and the most common age for those people.
Model development
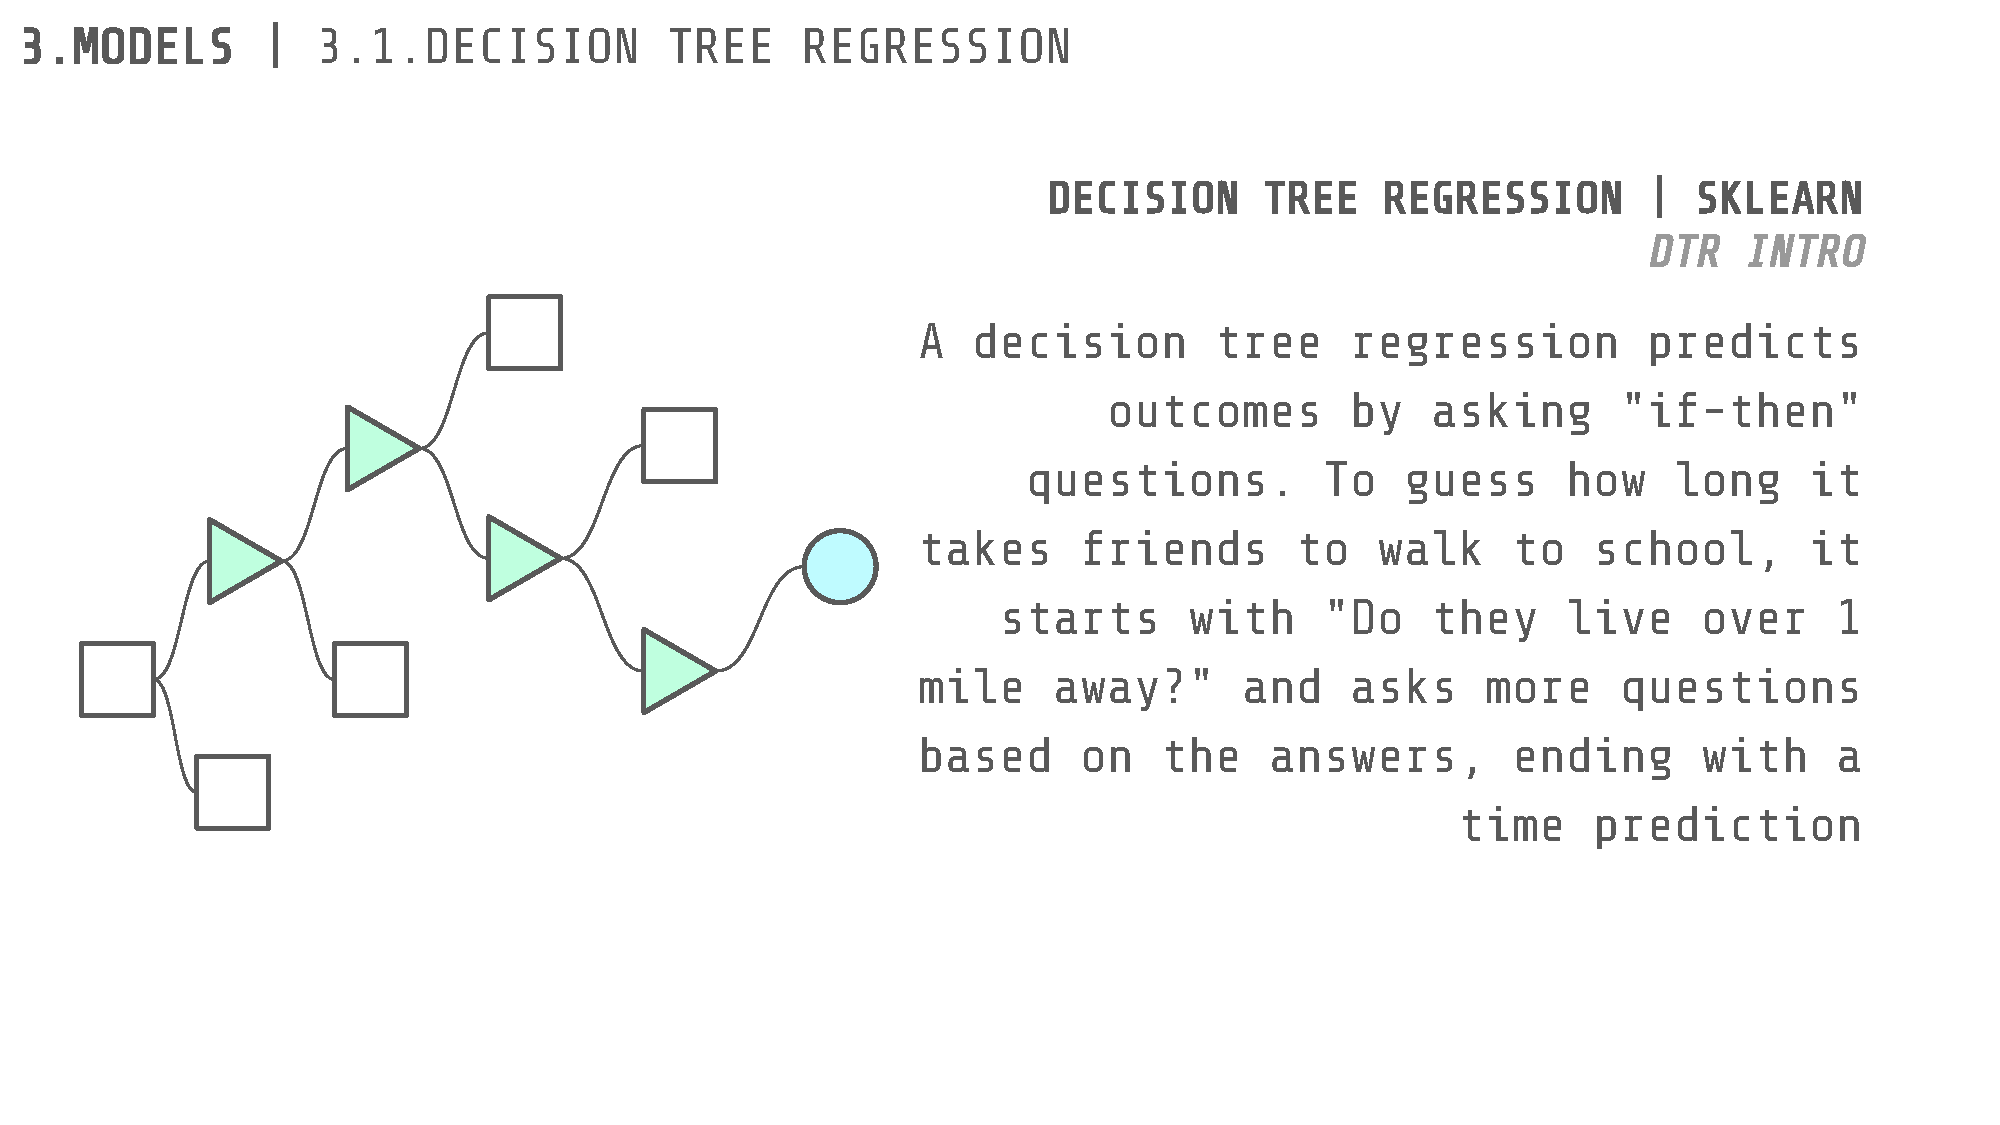
We explored several machine learning models to predict bike availability like: MultiLinear Regression, Polynomial regression or Support Vector Regression. But in the end given the complexity of the prediction and the amount of independent variables used to predict the availability, the two best performing models were:
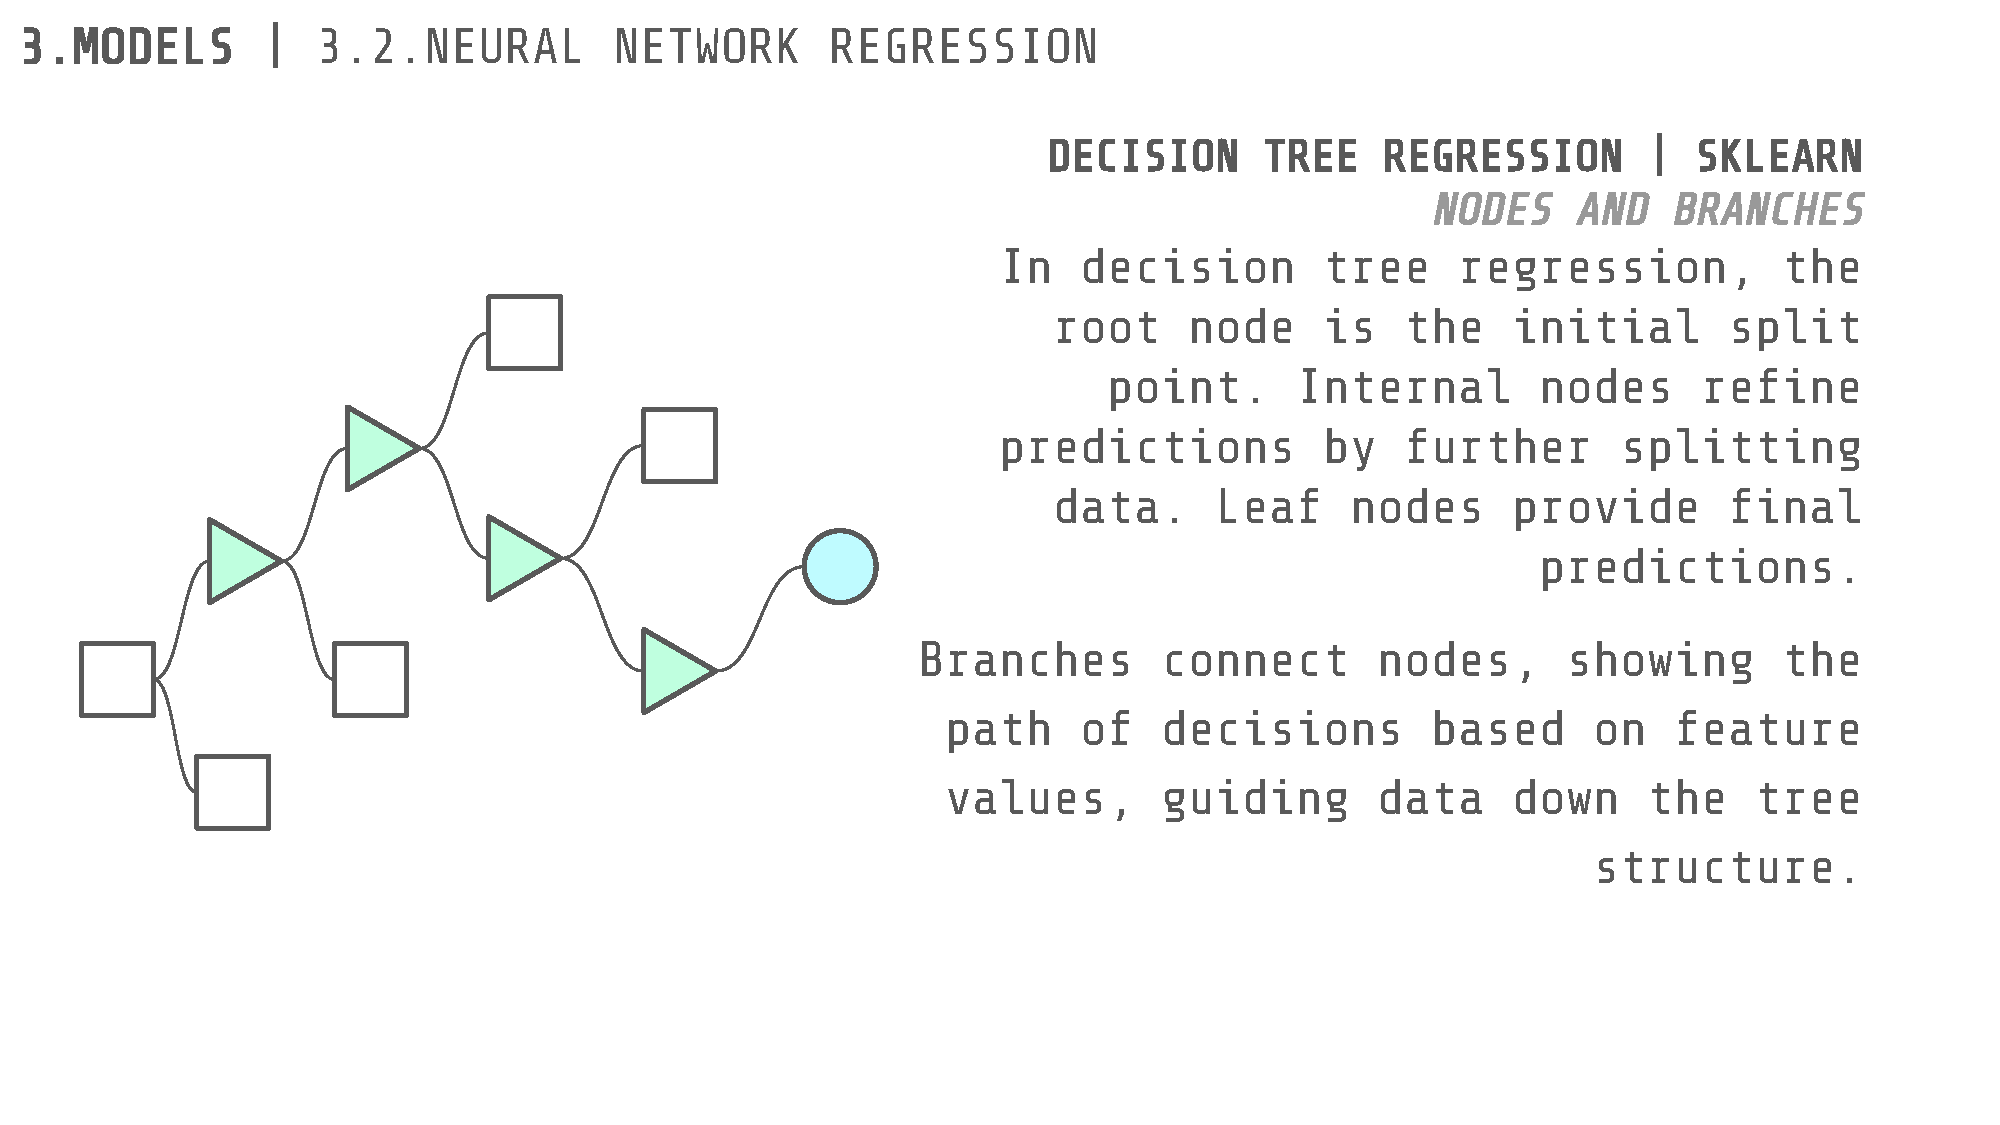
Decision Tree Regression & Random Forest
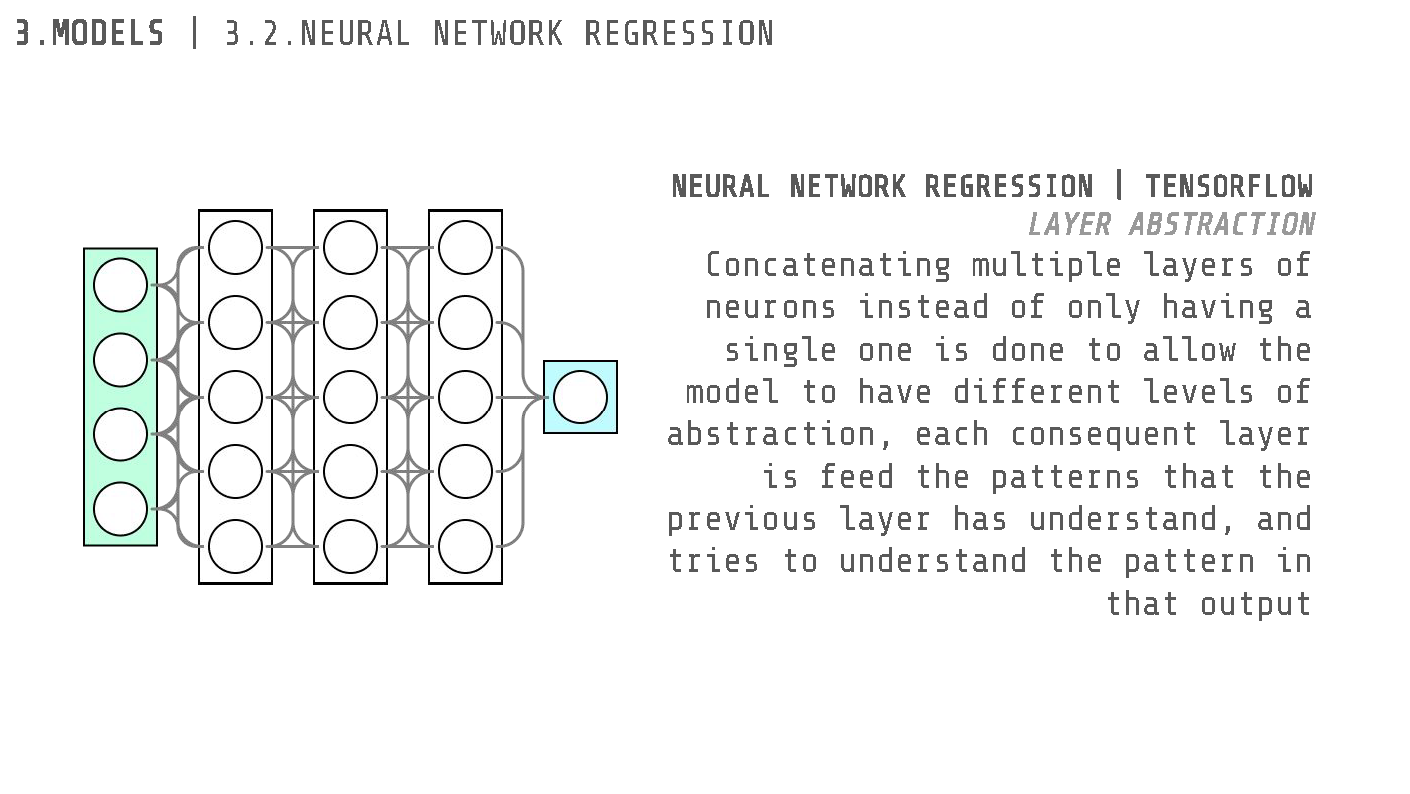
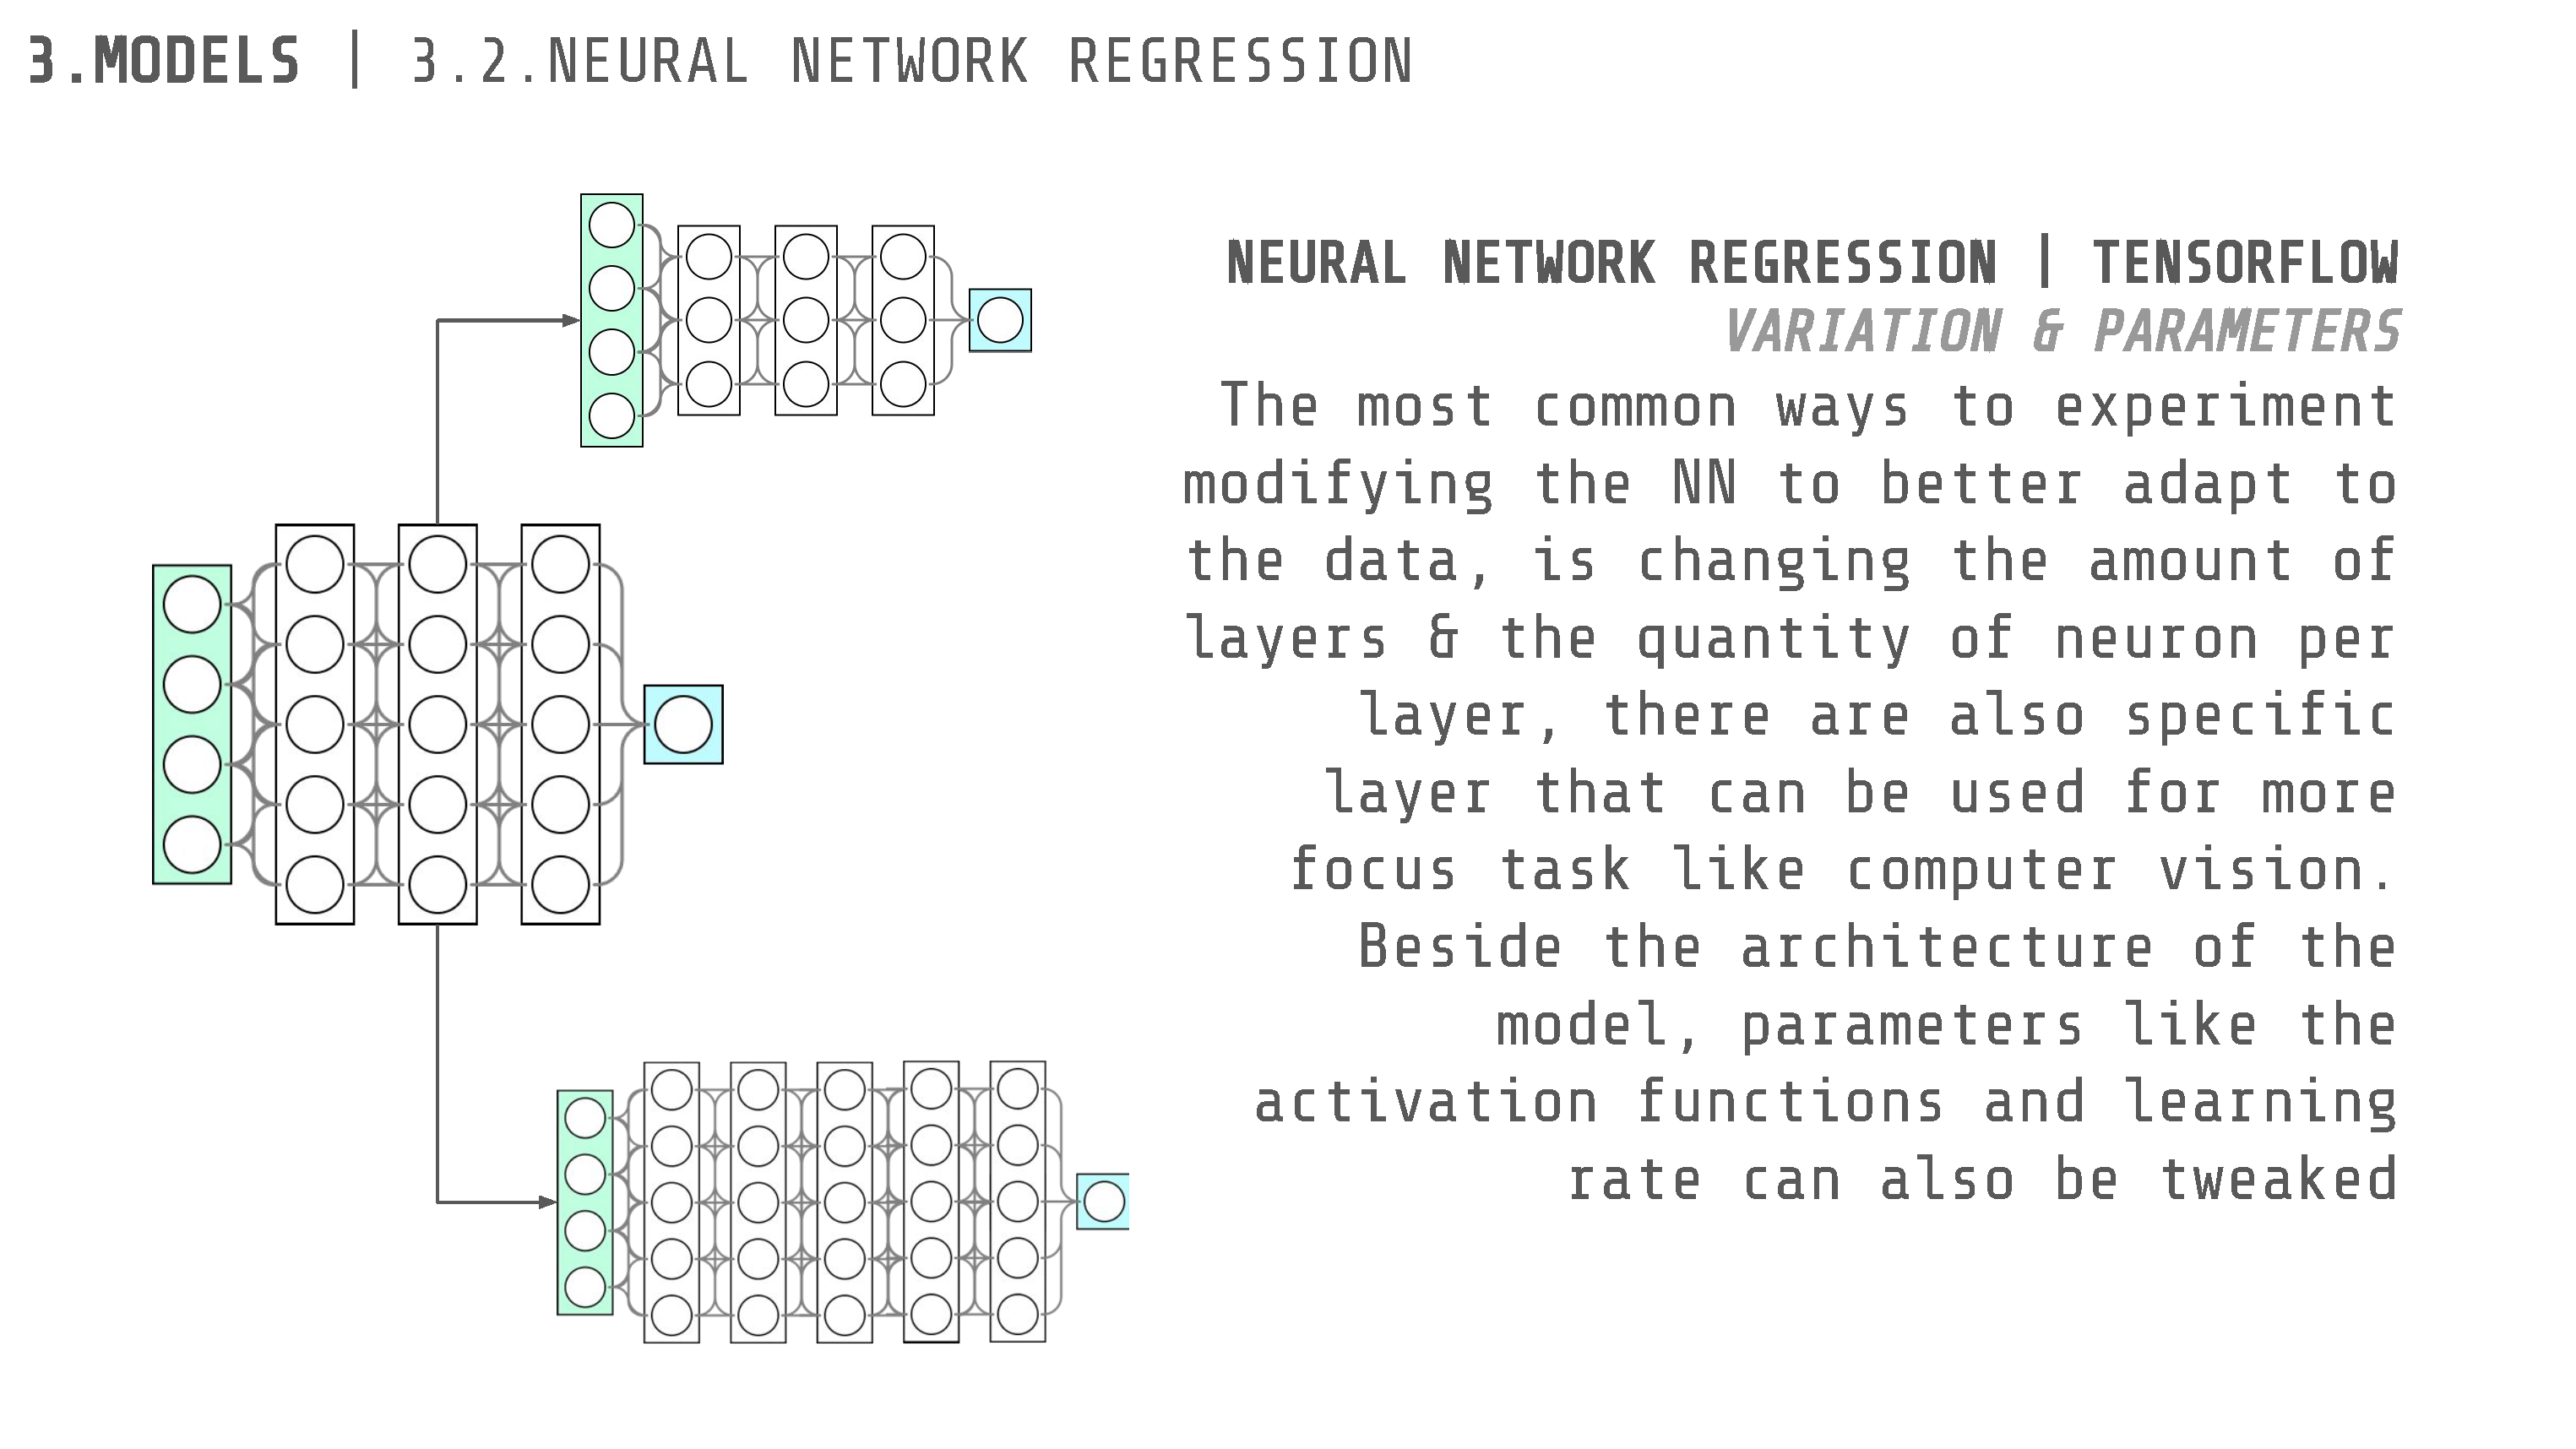
Neural Network Regression


Evaluation and results
The models were evaluated based on their ability to predict bike availability at different stations and times both during training and after training. In practice this was done by shuffling the datapoints in the dataset, and dividing them into a training batch (75% of the data) and a test batch (The remaining 25% of the data). Metrics such as Mean Absolute Error (MAE) and Root Mean Squared Error (RMSE) quantified the accuracy of predictions, both of which output numeric values that show better performance the smaller they are. These metrics were performed by asking the machine to predict the values on the test batch and comparing it with the real result. We also assessed the models’ performance during peak hours and special events to understand their limitations and strengths better. Both models had an average performance, the best being 0.104 Mse for the Neural Network and 0.110 for the Random Forest.
Applications and Future Work
The predictive insights from our model can be integrated into a real-time dashboard for Bicing operators, enabling proactive redistribution of bikes and improving overall system efficiency. For users, an app feature providing availability forecasts can enhance trip planning. Future work involves incorporating real-time data feeds and exploring advanced techniques like deep learning and reinforcement learning to further refine predictions.
Conclusion
By predicting Bicing station availability, we take a significant step towards making Barcelona’s bike-sharing system more reliable and user-friendly. This project not only showcases the power of machine learning in solving real-world problems but also highlights the potential of data-driven approaches in promoting sustainable urban mobility.
Join us on this journey as we blend technology and sustainability to enhance the Bicing experience in Barcelona, ensuring that bikes are always available when and where you need them.
