Morphology_Designer is a research project that demonstrates a data-driven approach to offer valuable insights for architects, urban designers, and planners by emphasizing the significance of morphological analysis, through building footprint data, and in understanding the spatial characteristics and composition of residential buildings within cities. The derived typologies offer a systematic framework for evaluating the diverse building forms, sizes, and distributions. Finally, it proposes a design tool for remote analysts and individuals requiring comprehensive city and building information.
“Architecture and the city are mutually constitutive,
each influencing and shaping the other in a constant feedback loop.” (Koolhaas, 1995, p. 2)
Hypothesis:
We can use readily available tabular data to accurately classify residential typologies and gain valuable insights into the composition of our cities. By applying unsupervised machine learning techniques, we can discover similarities between buildings that may not be apparent to the human eye.
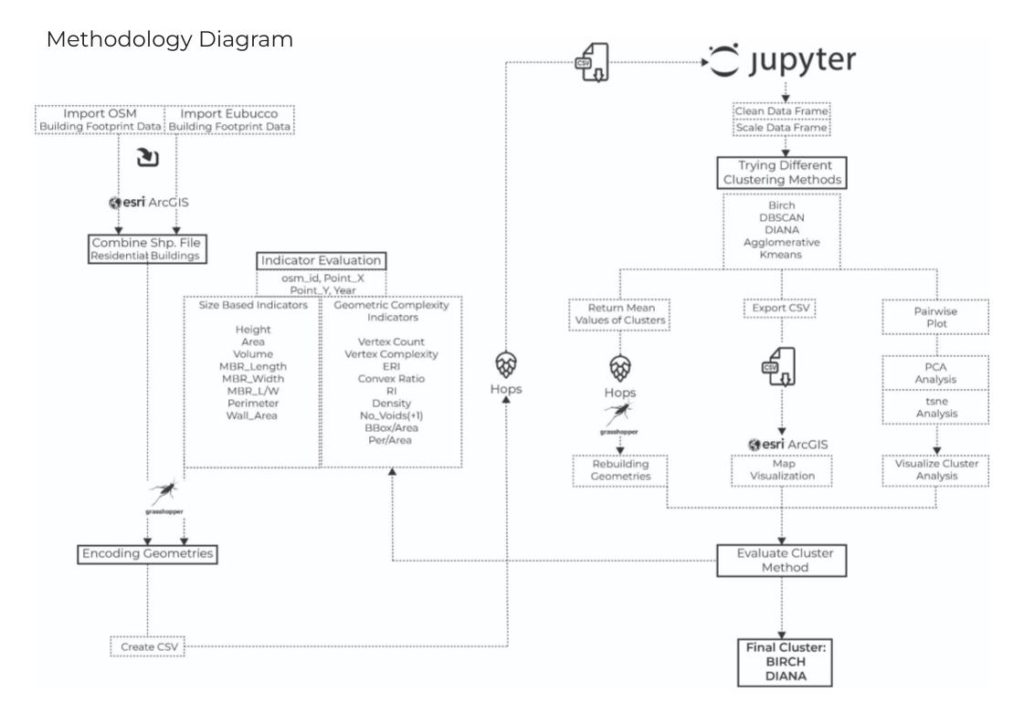
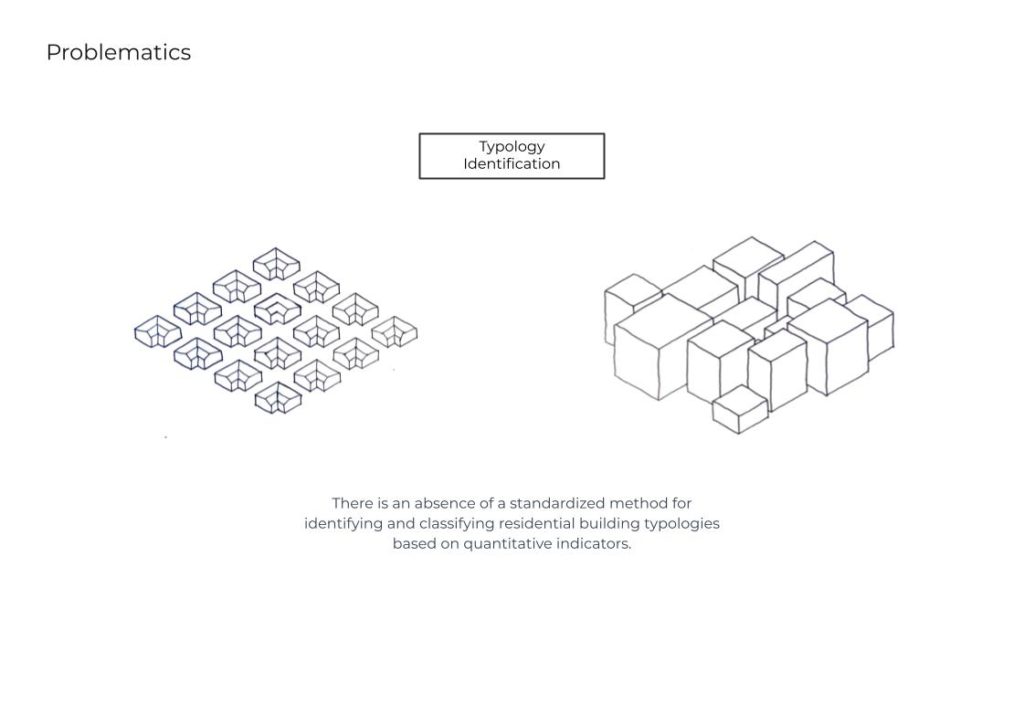
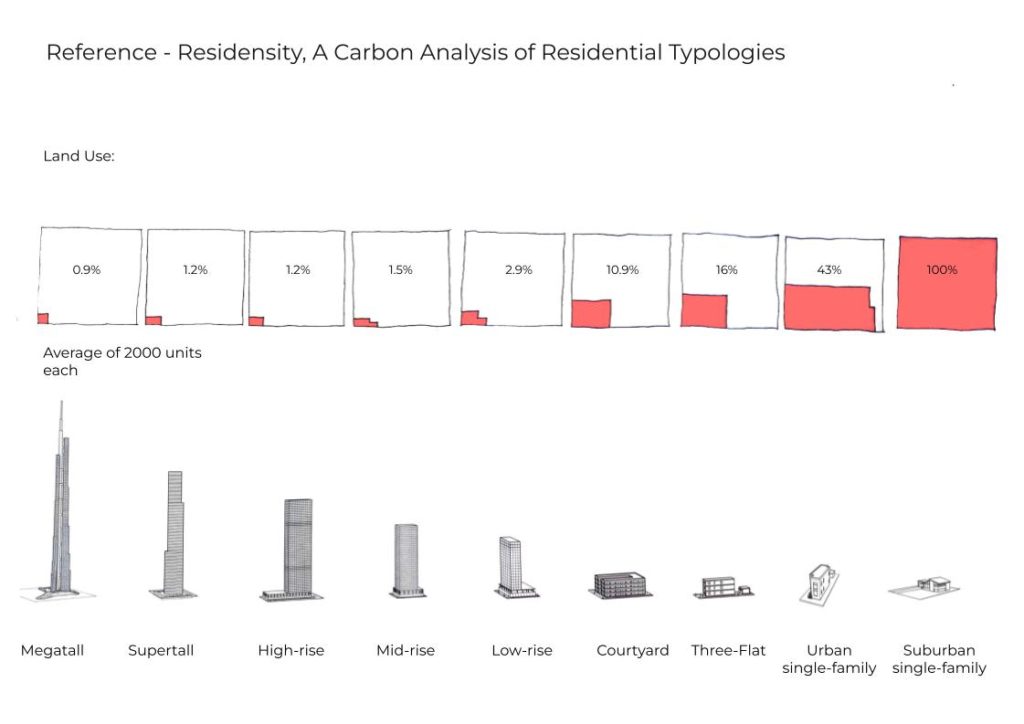
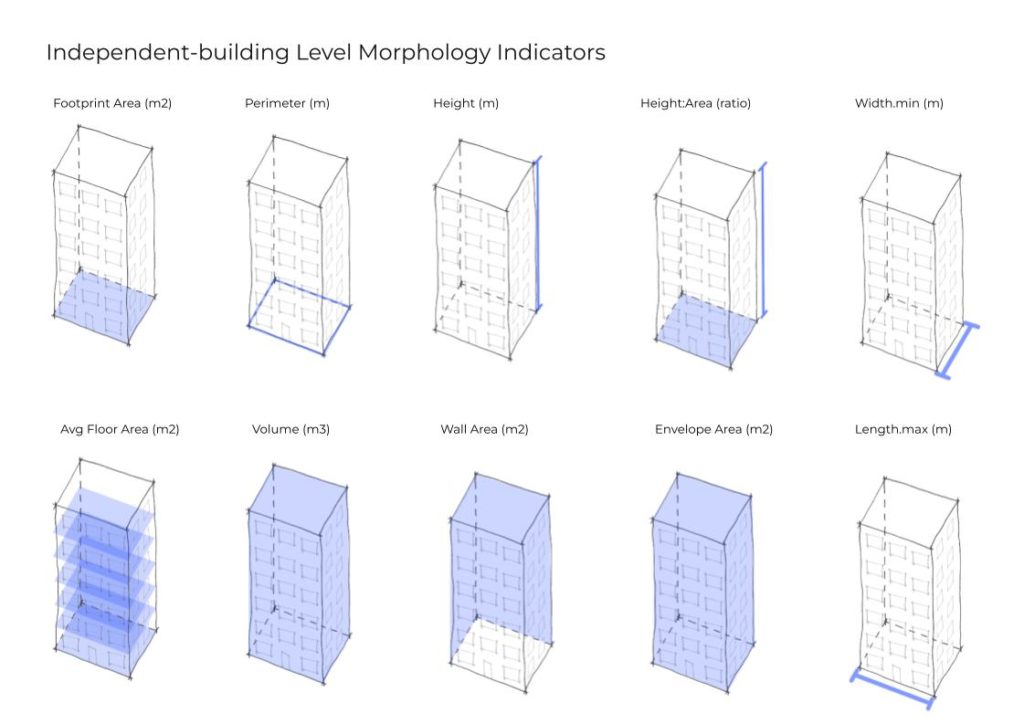
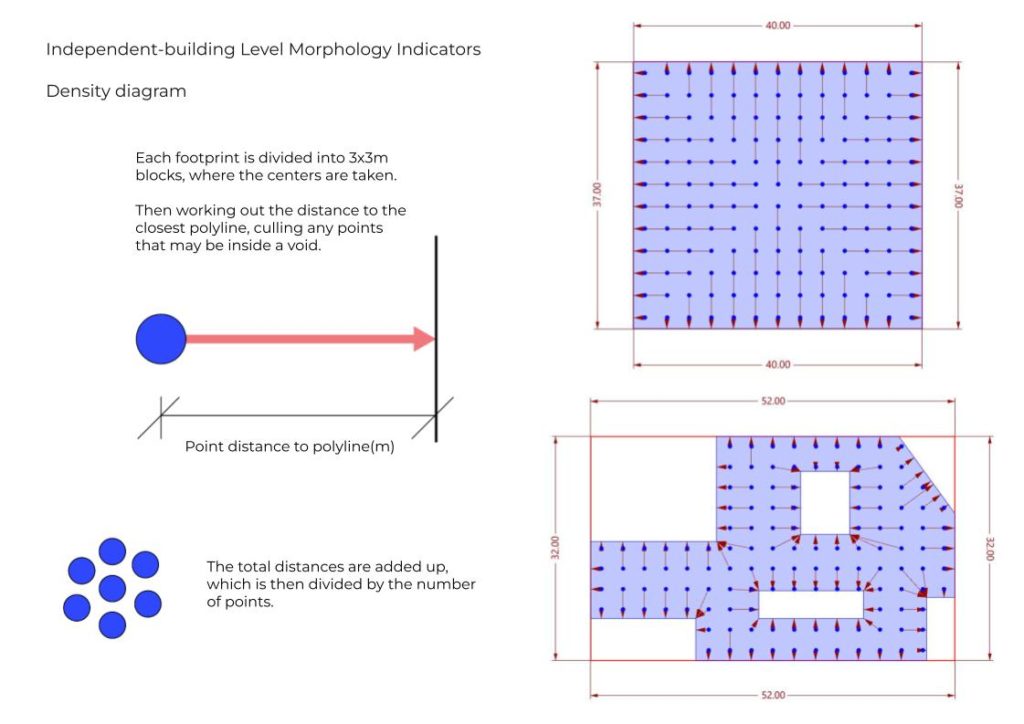
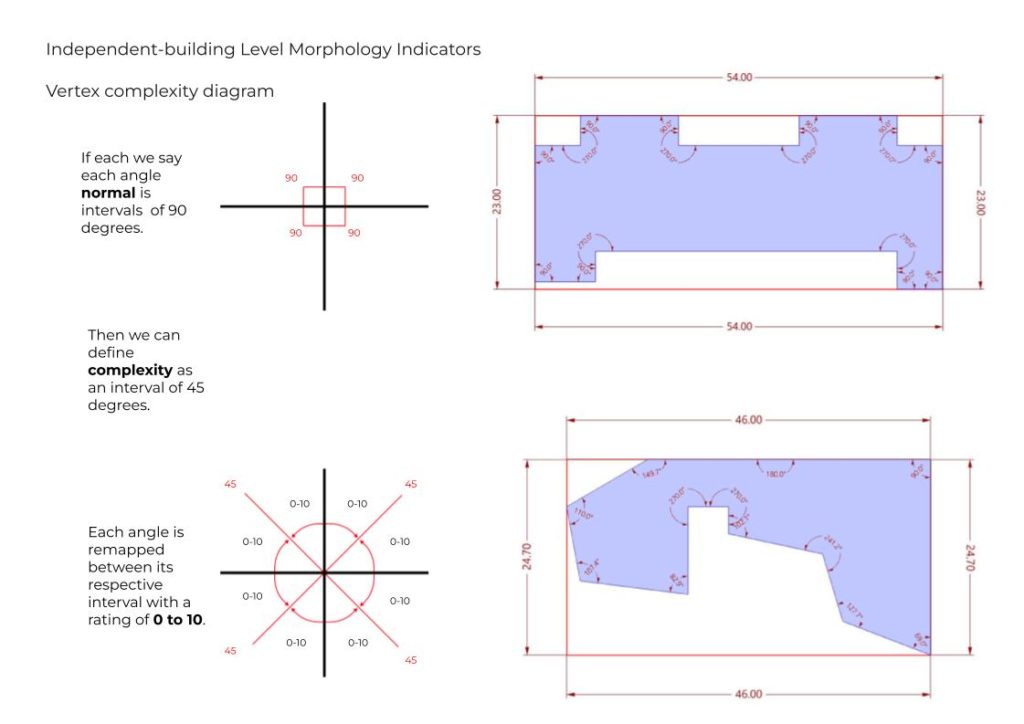
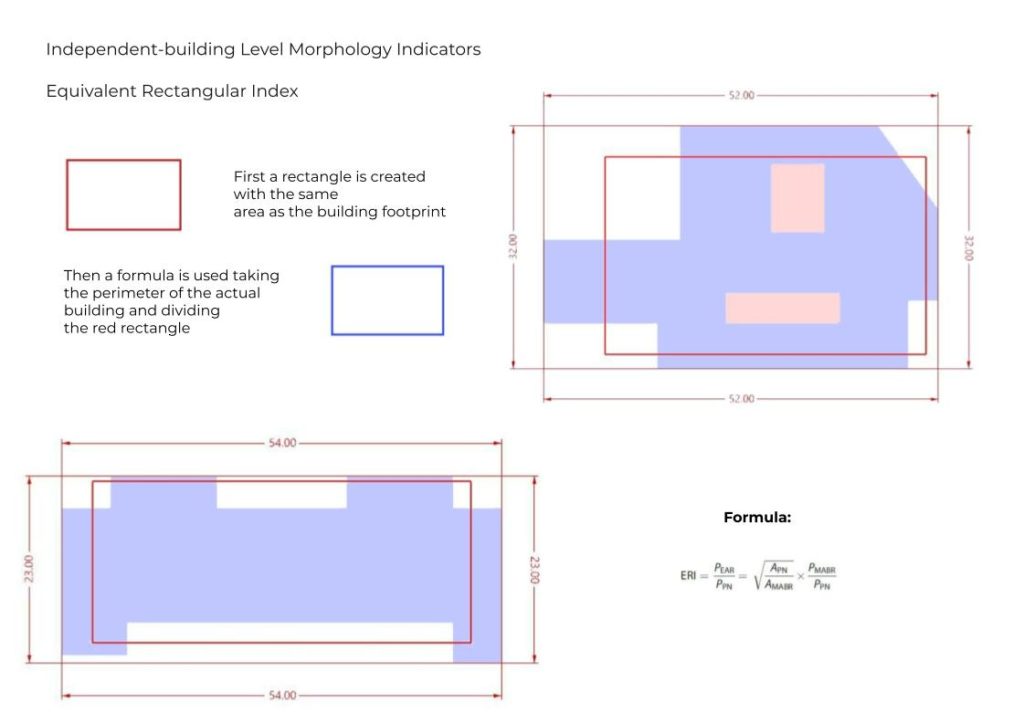
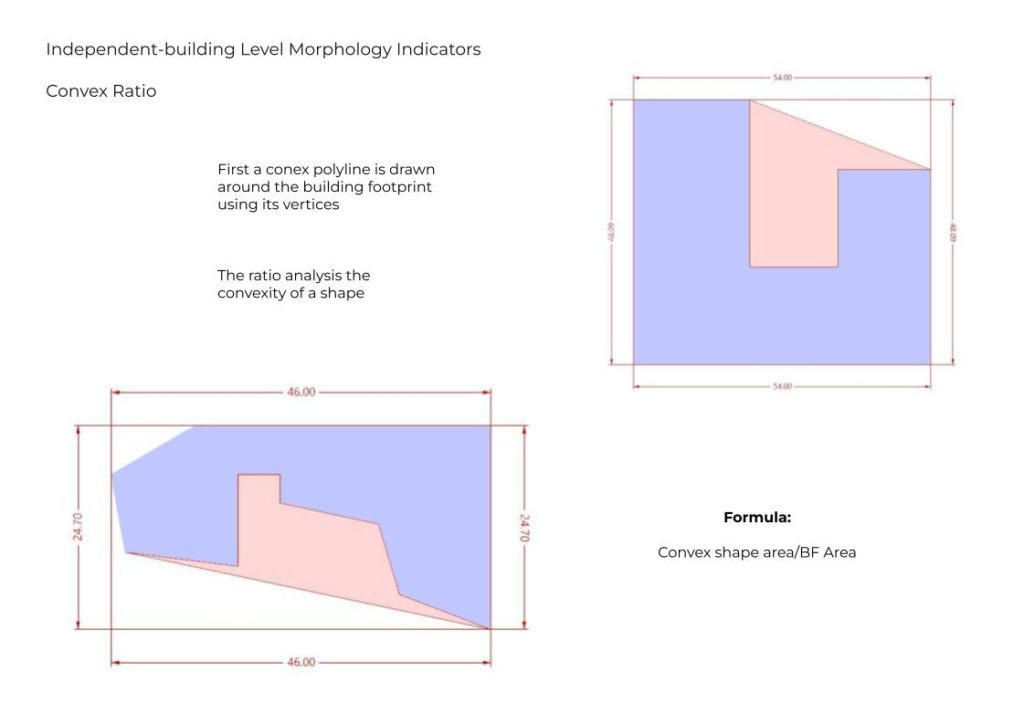
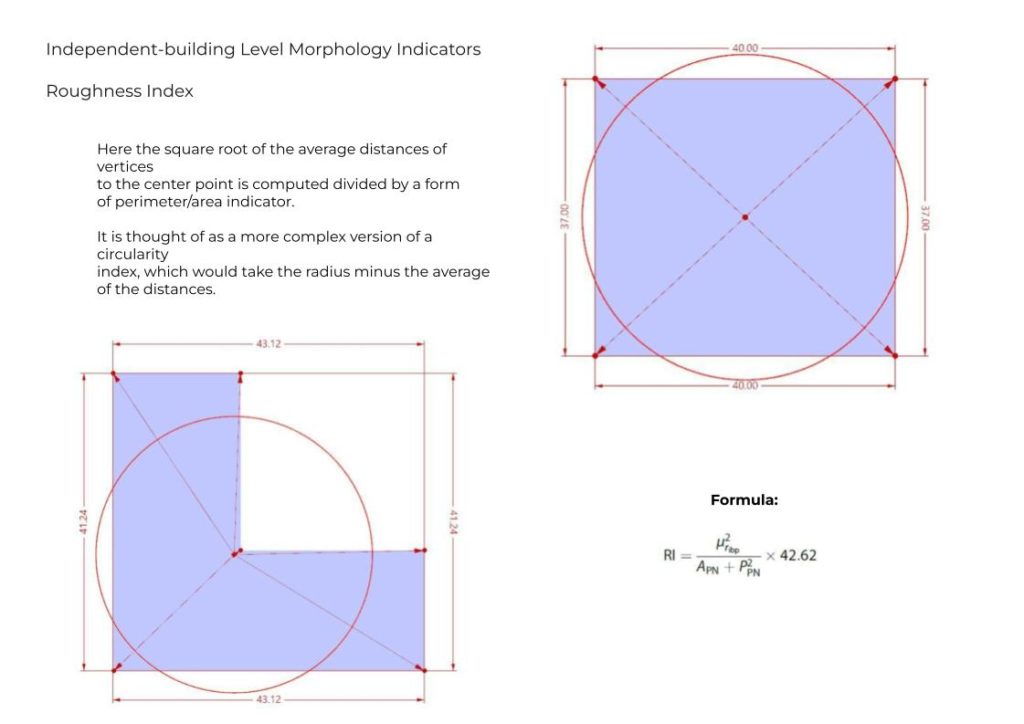
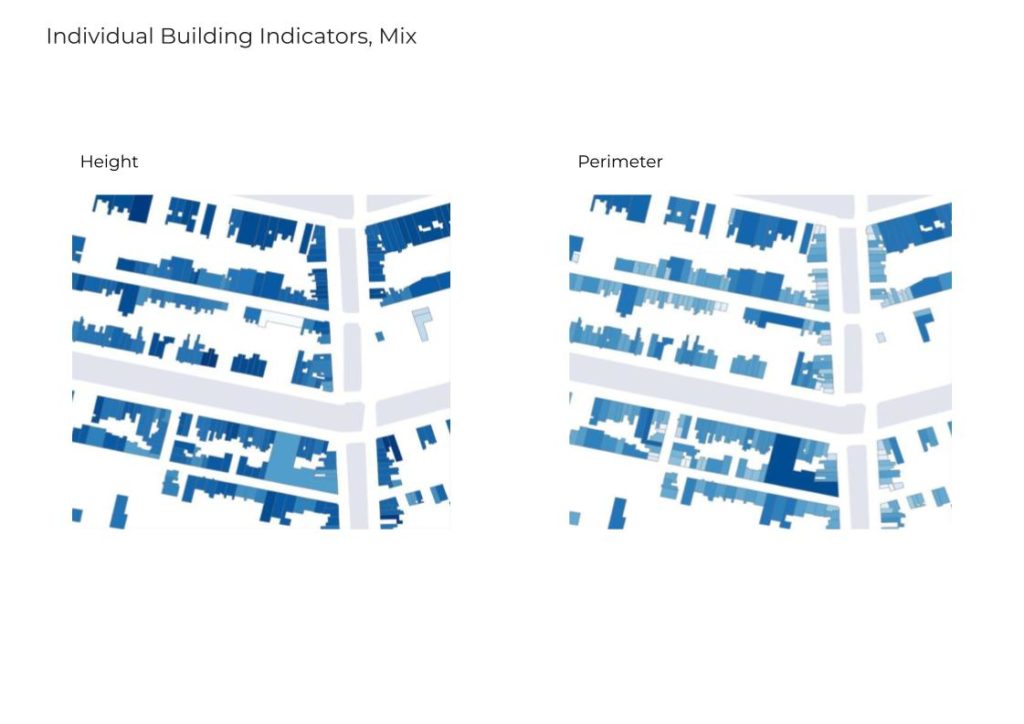
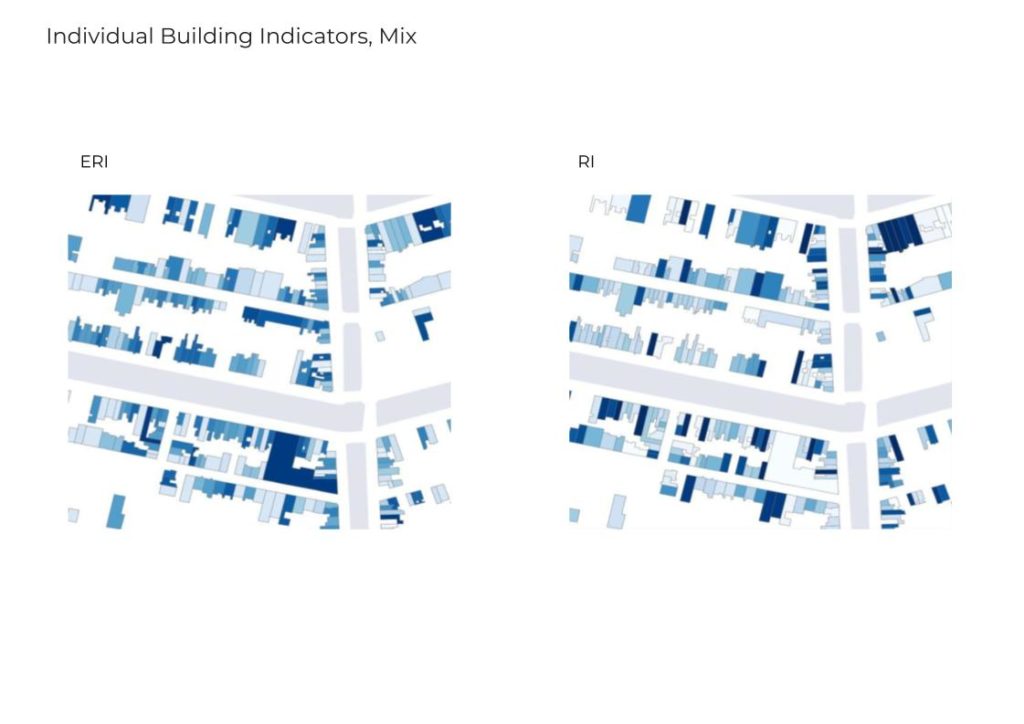
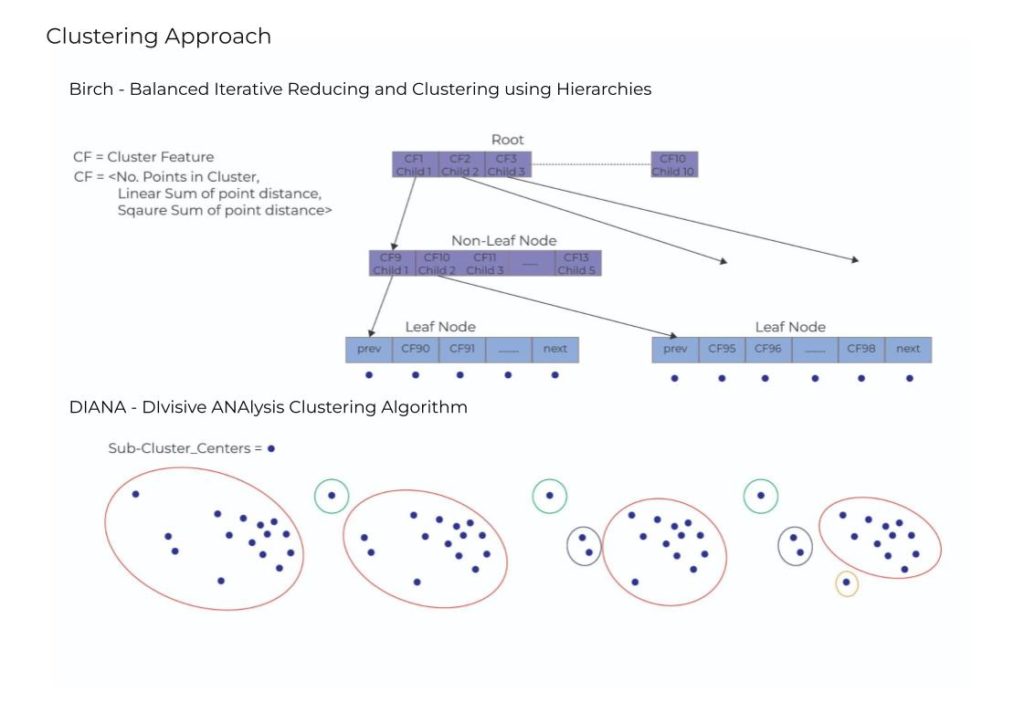
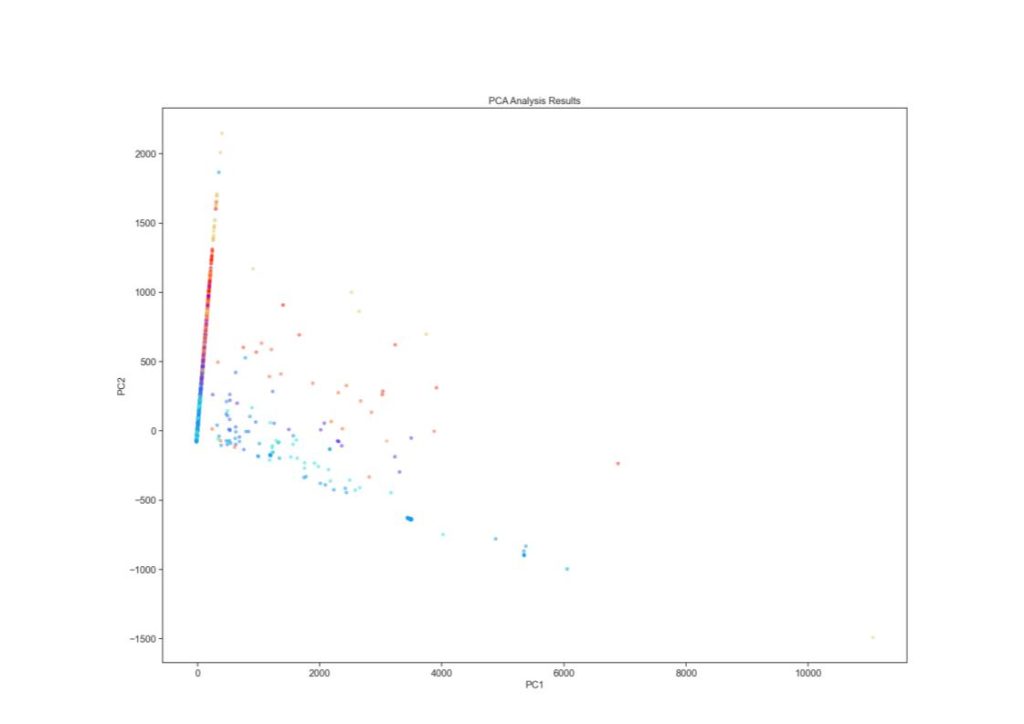
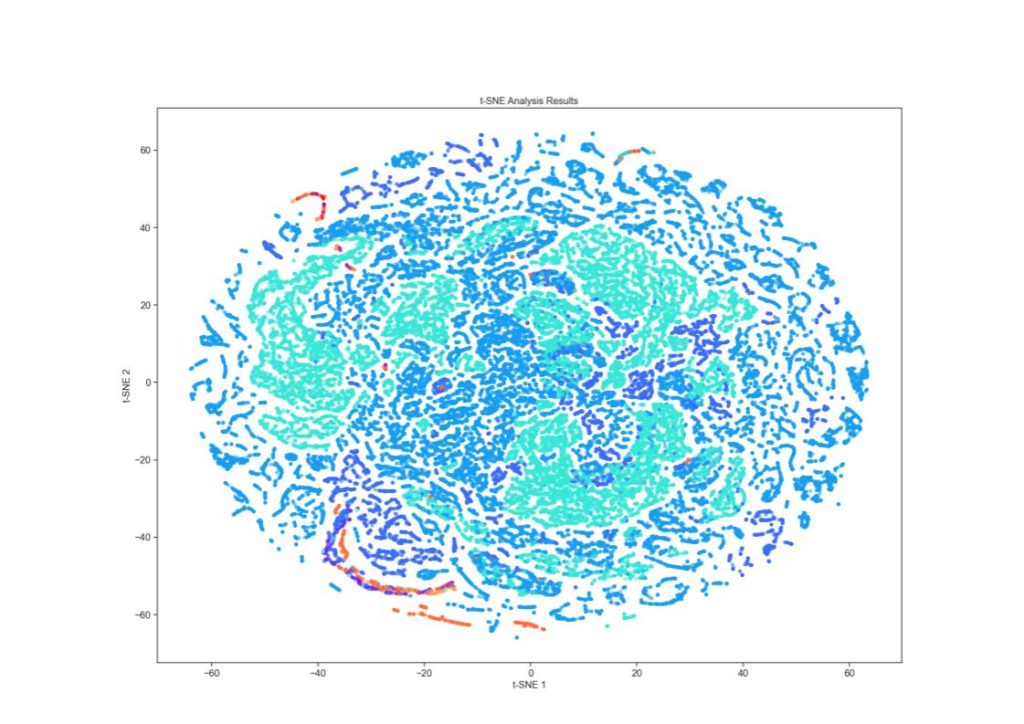
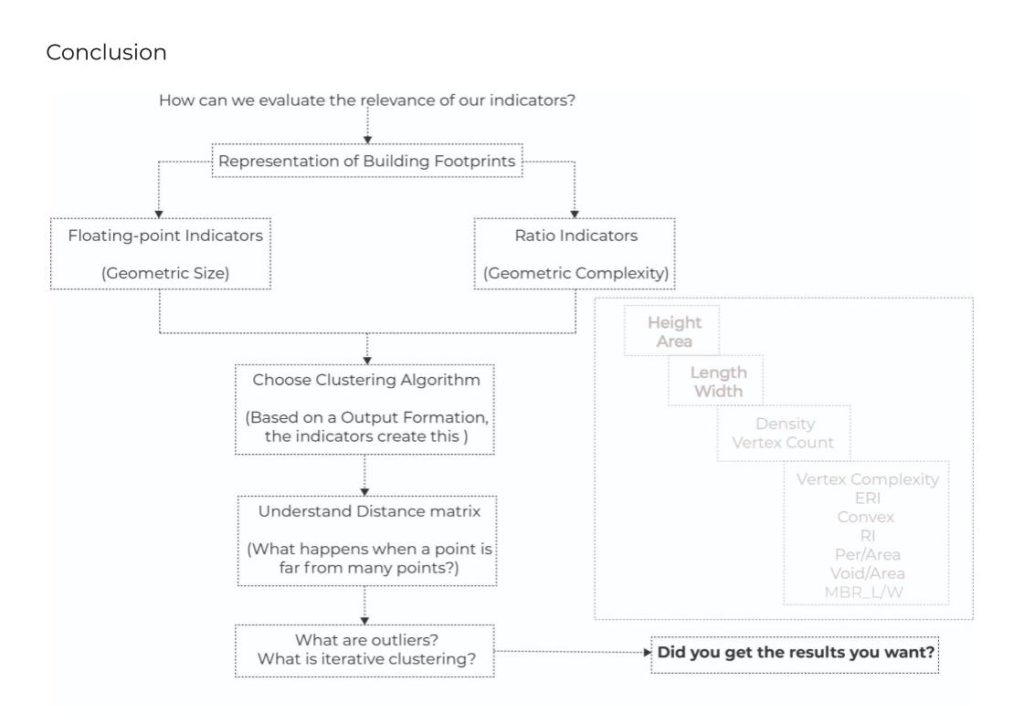
Encoding Geometries
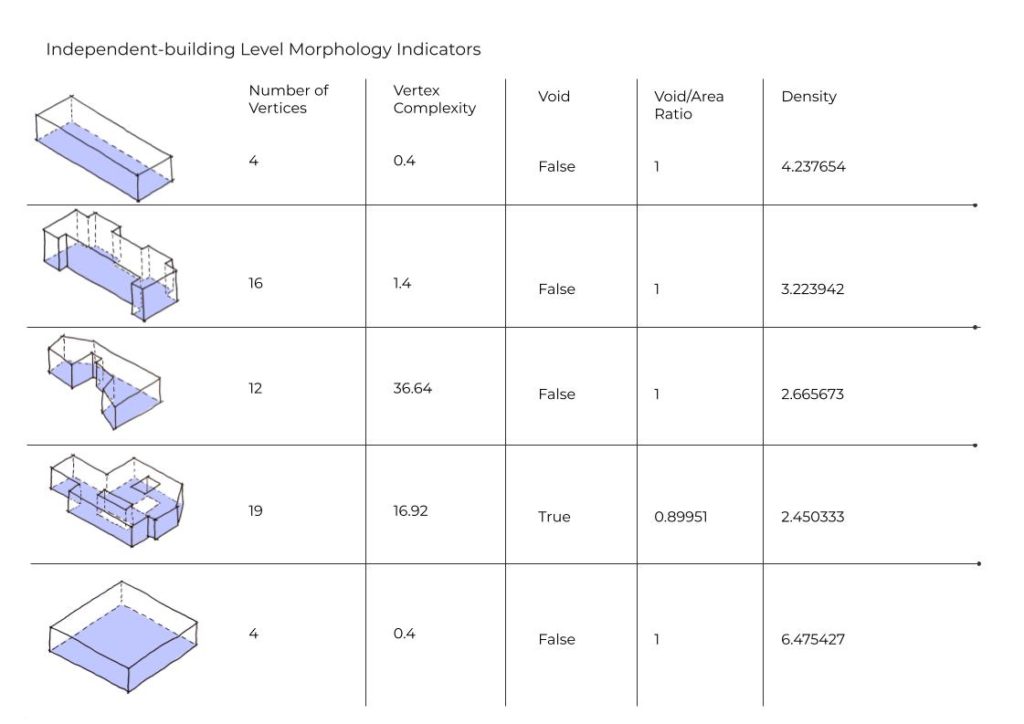
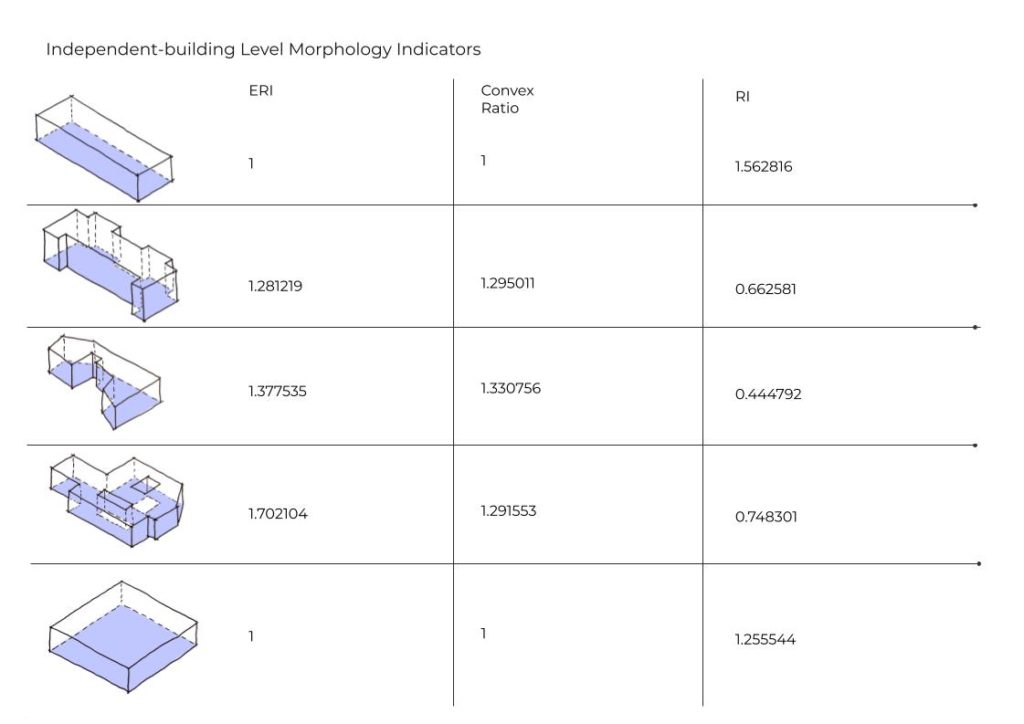
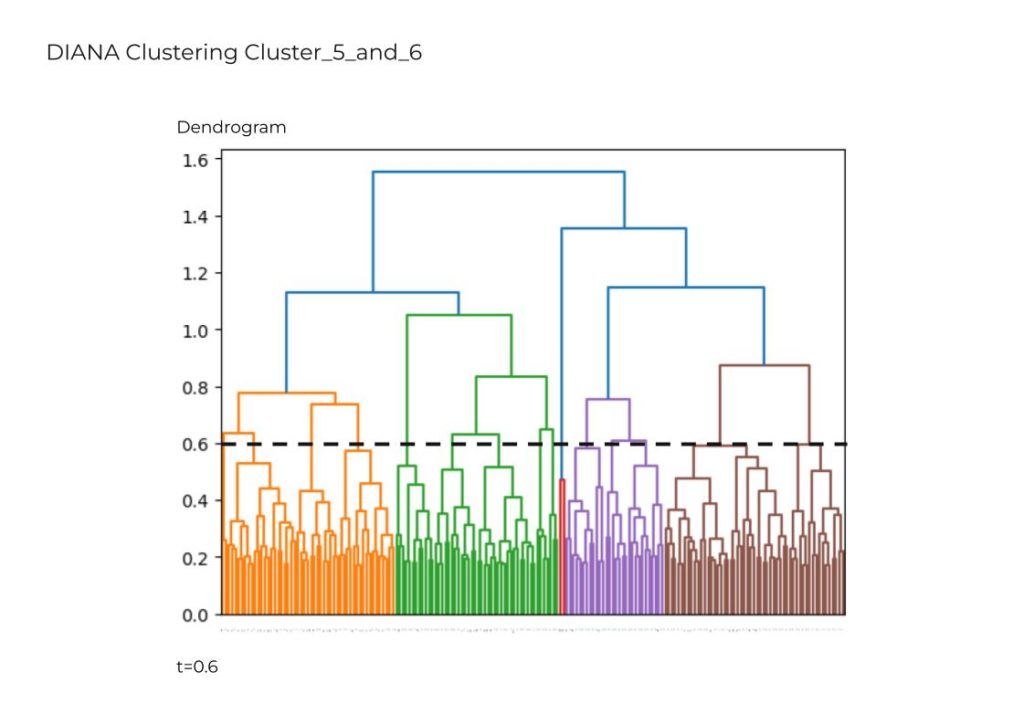
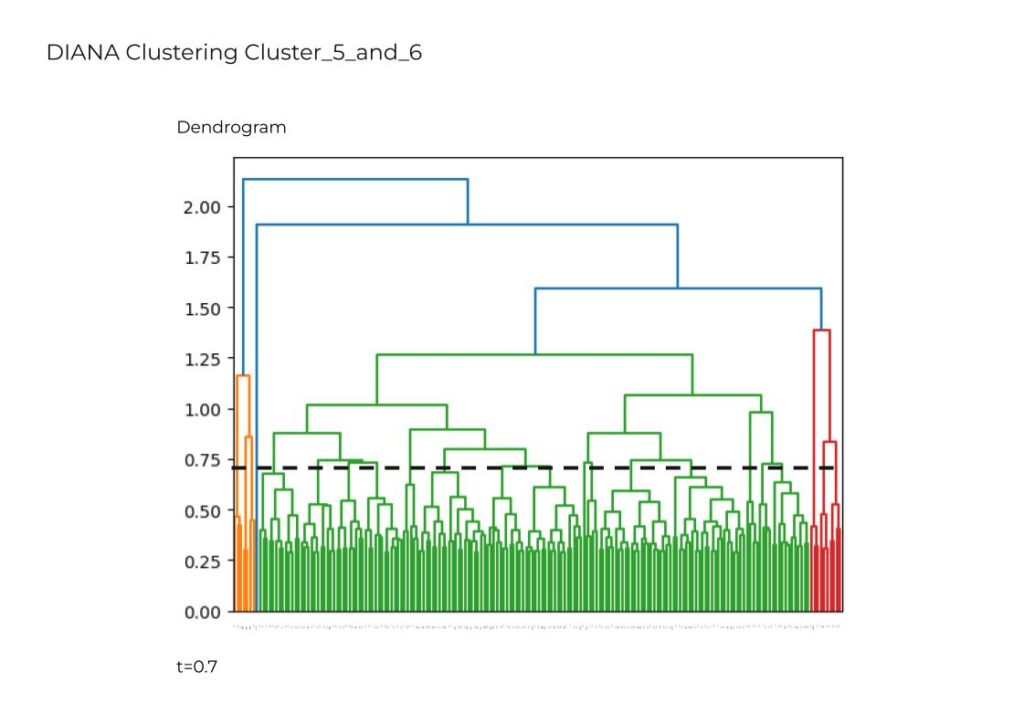
Identifying Typologies
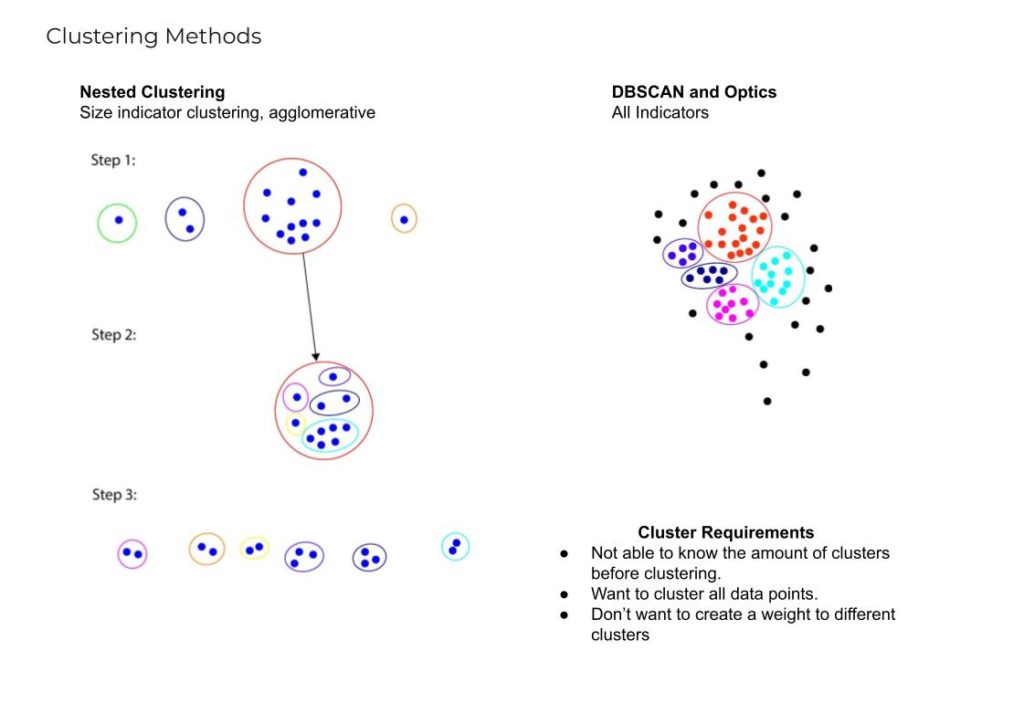
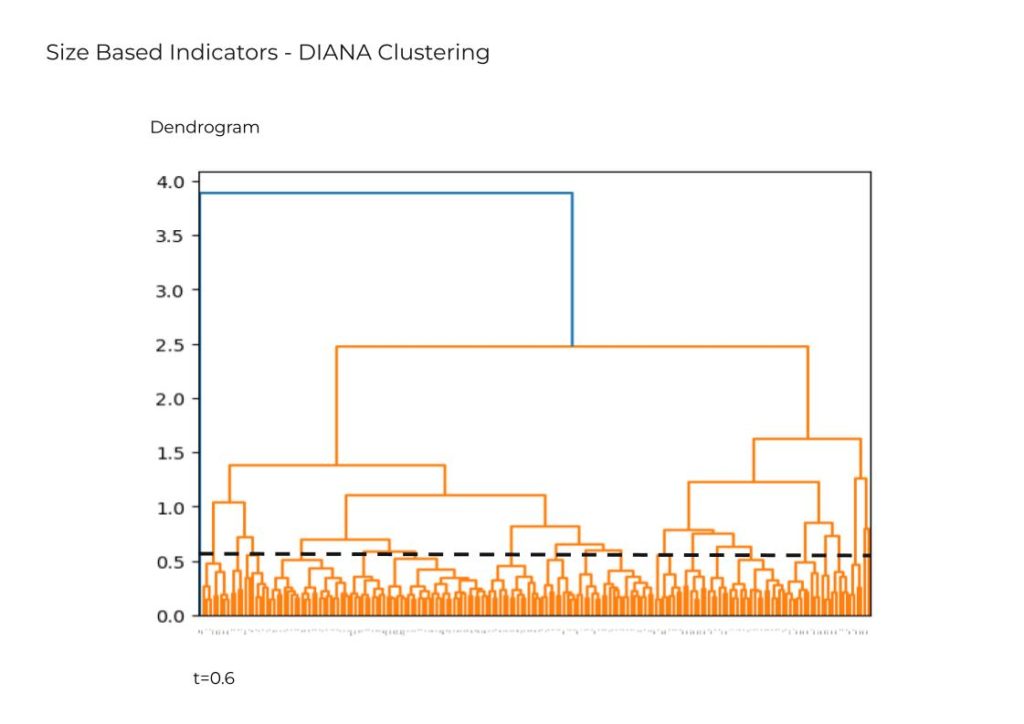
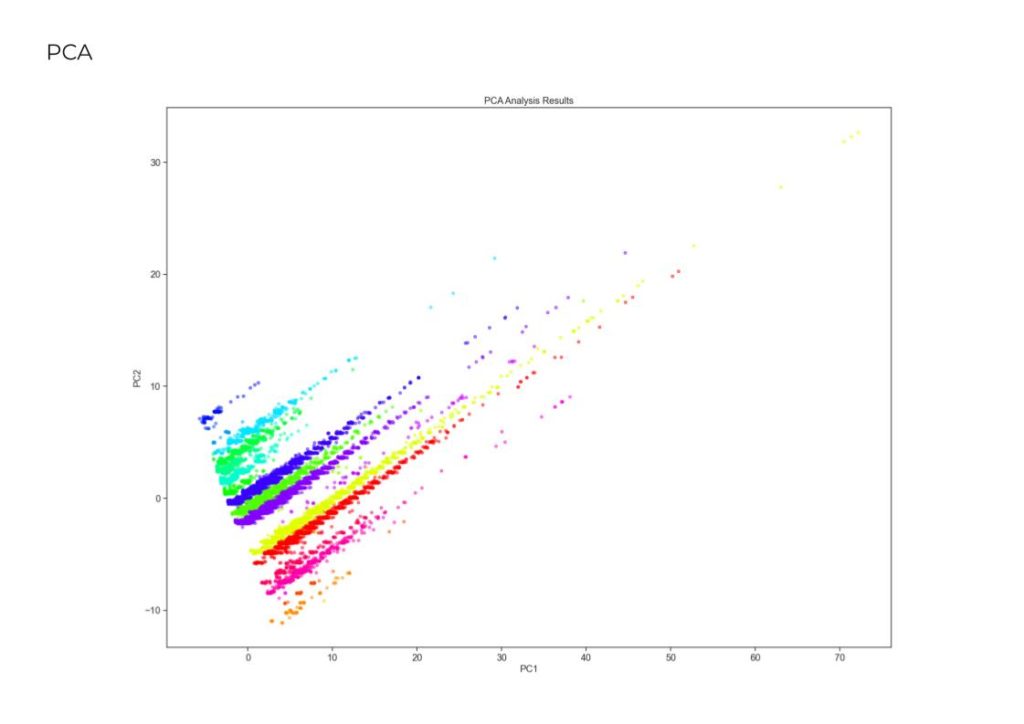
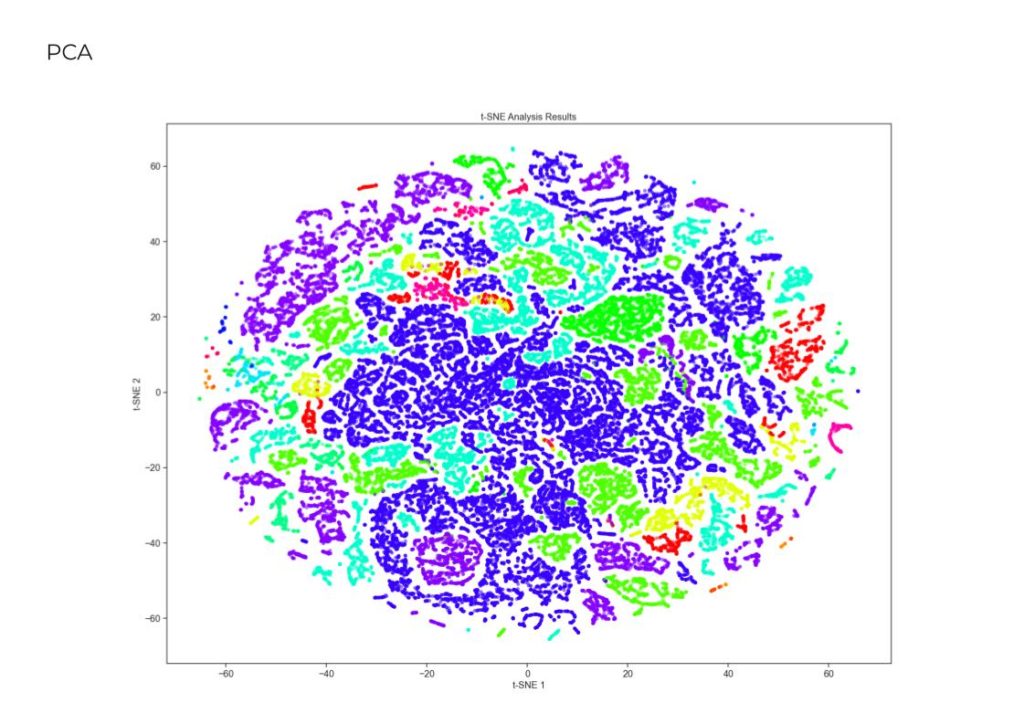
Unsupervised clustering is a machine learning technique that groups similar
data points together without using predefined labels.
It identifies patterns and structures in a dataset based on the similarity between data points.
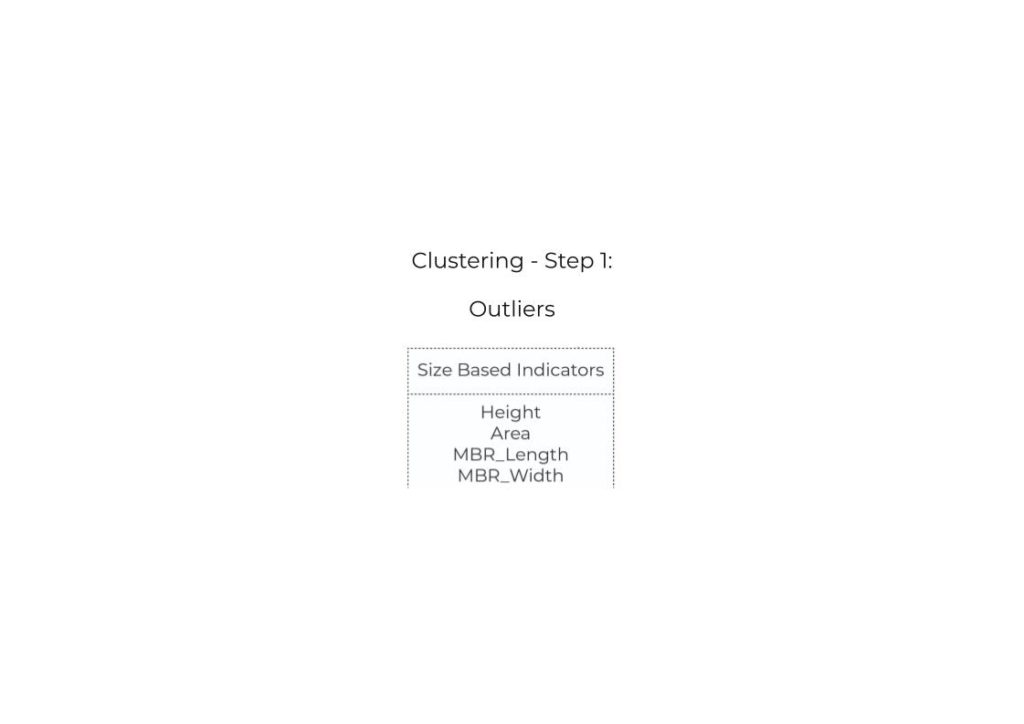

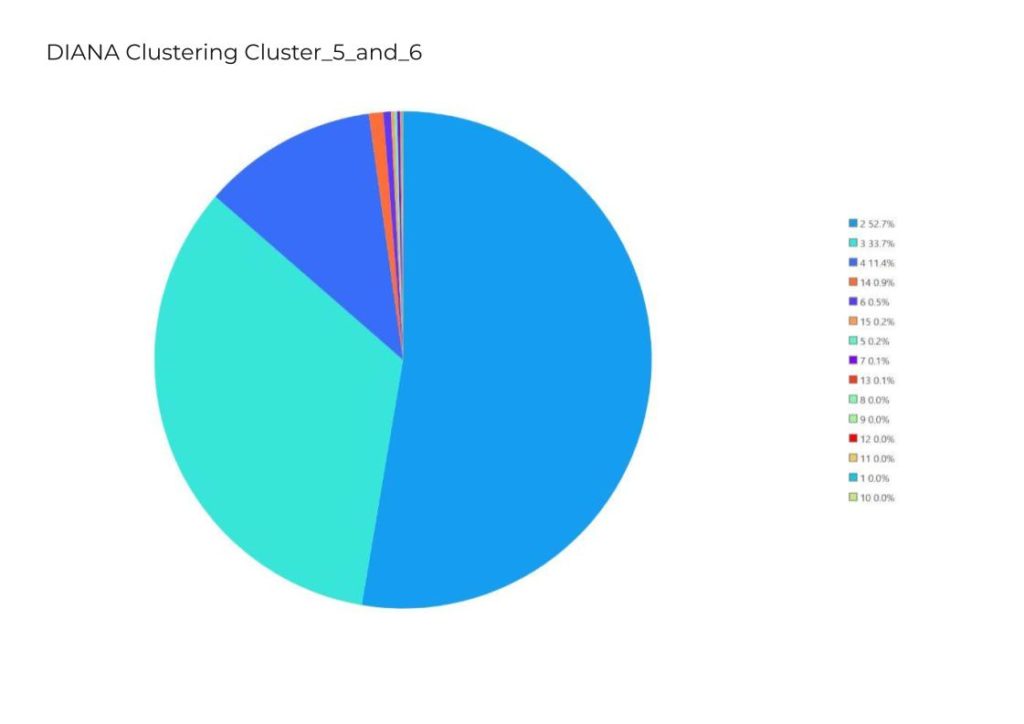
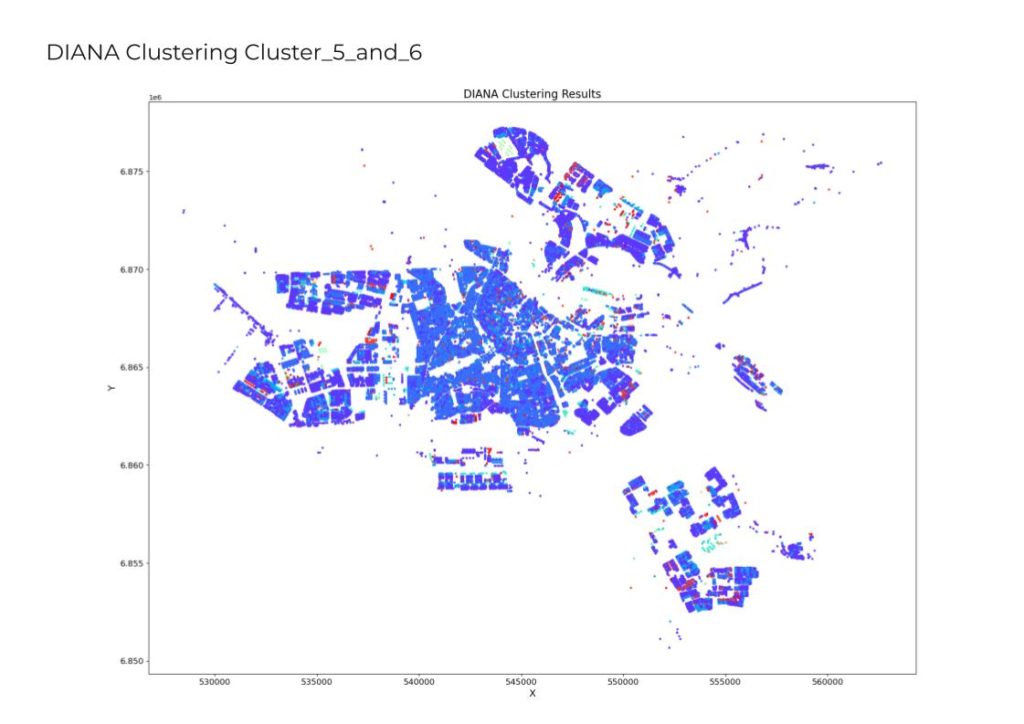
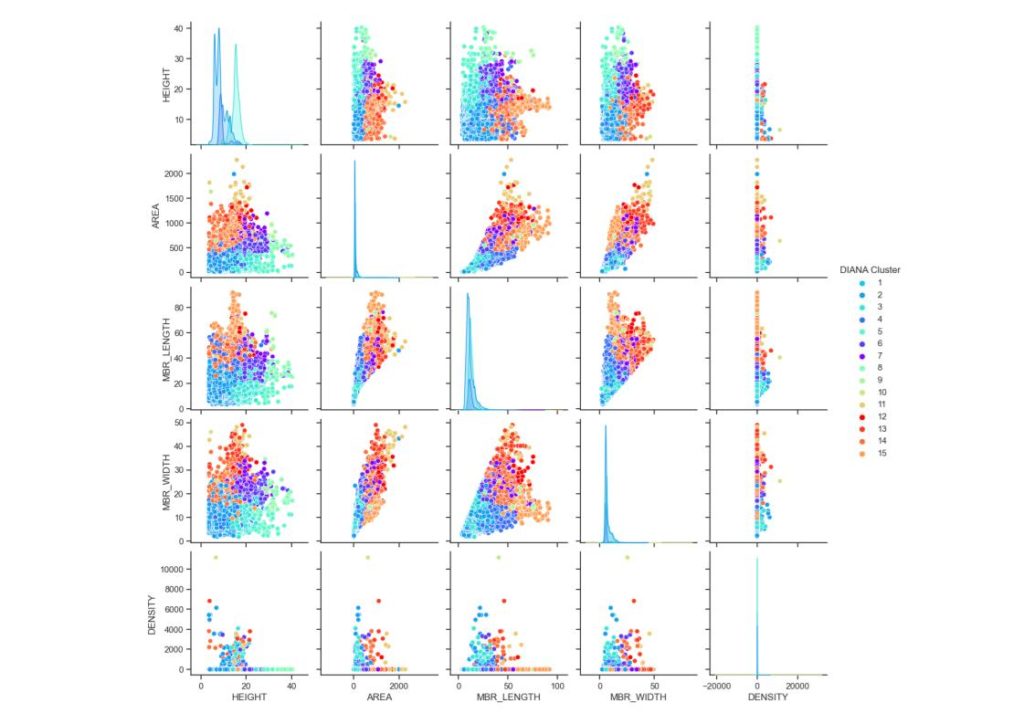
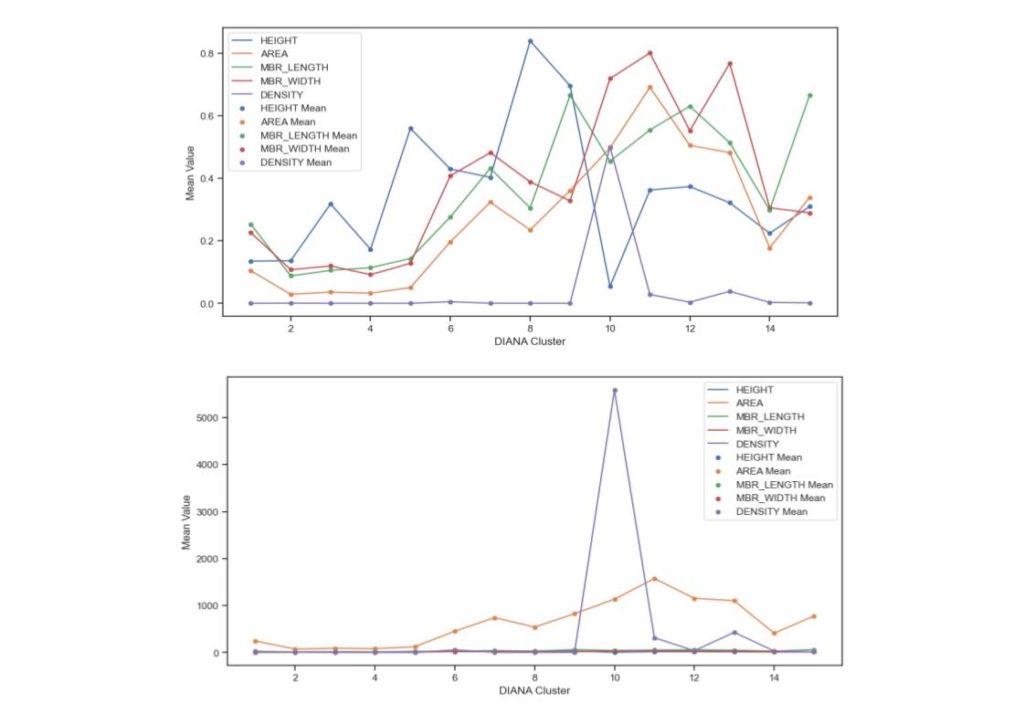
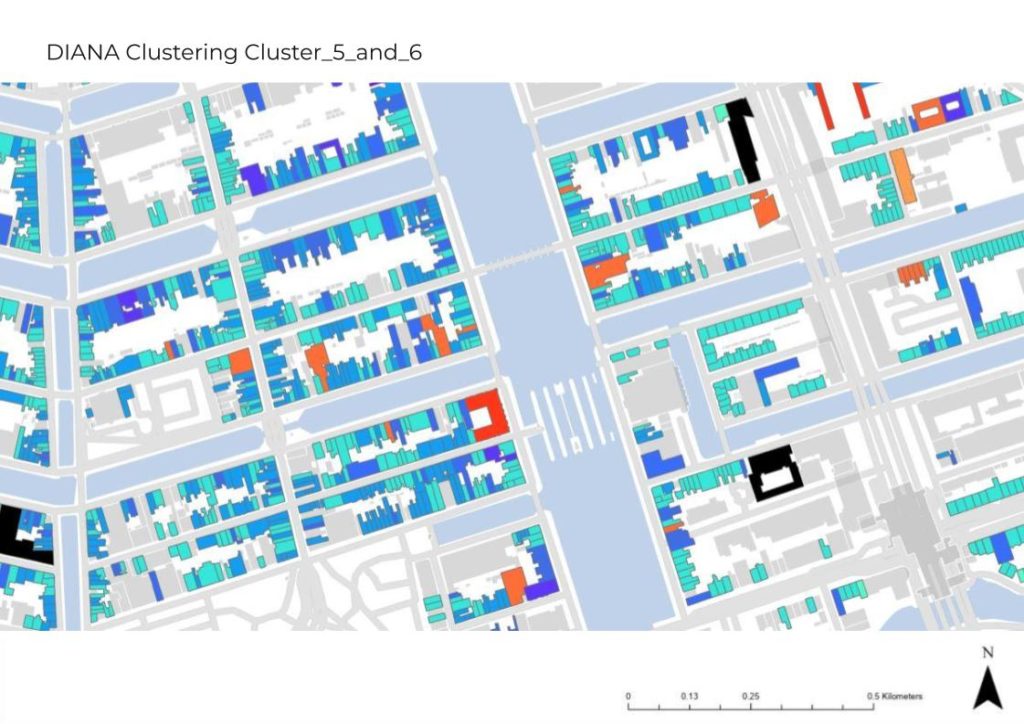
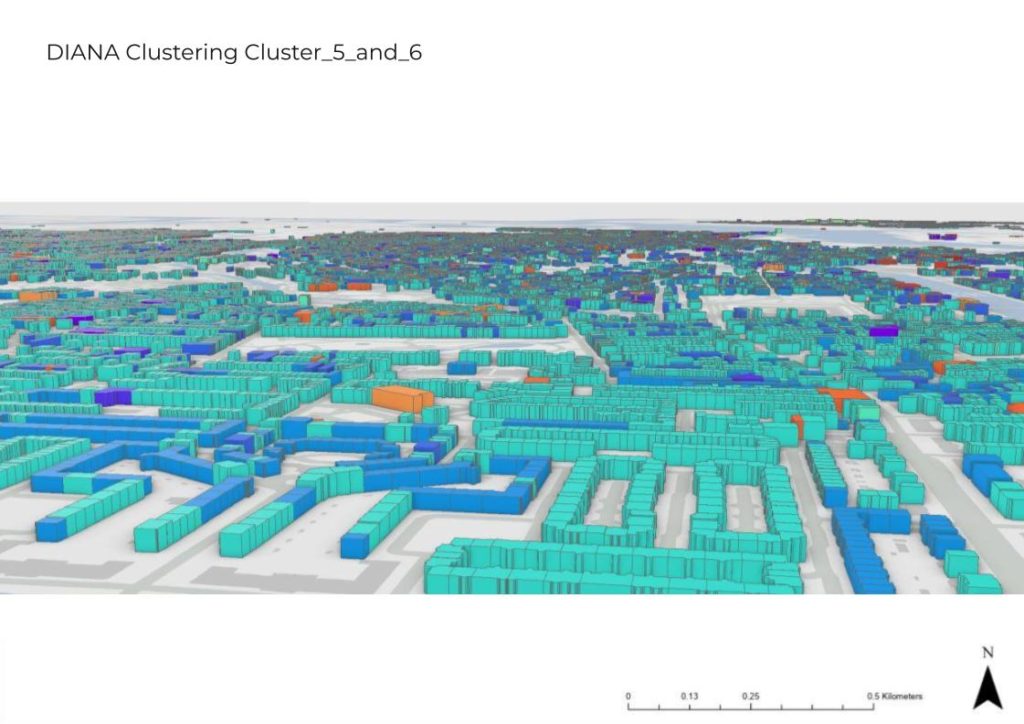
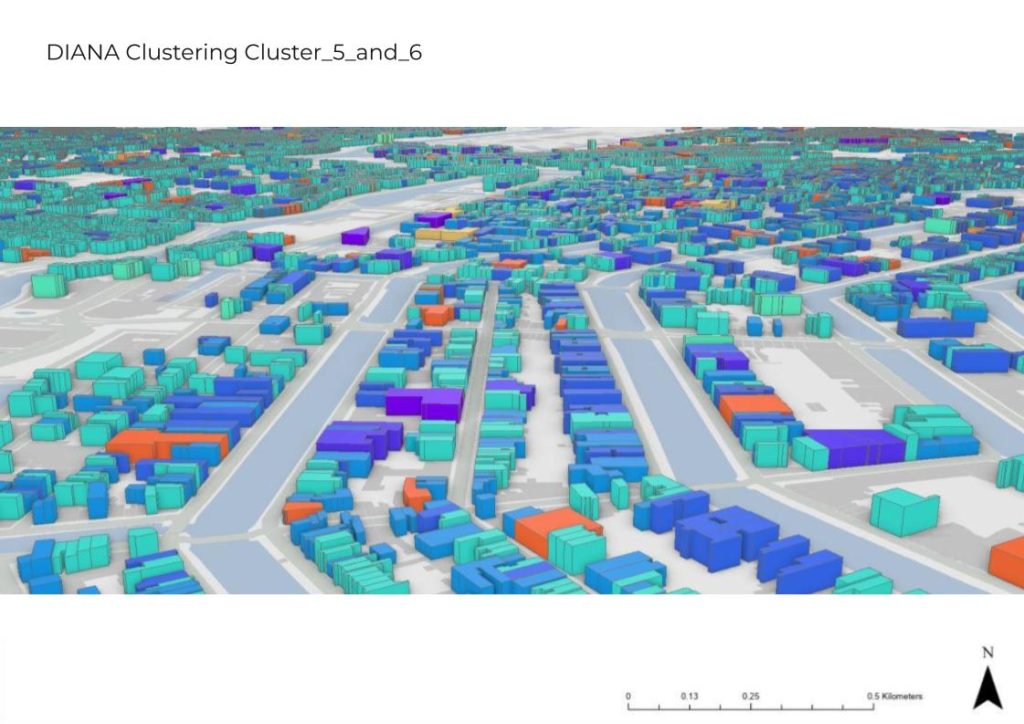

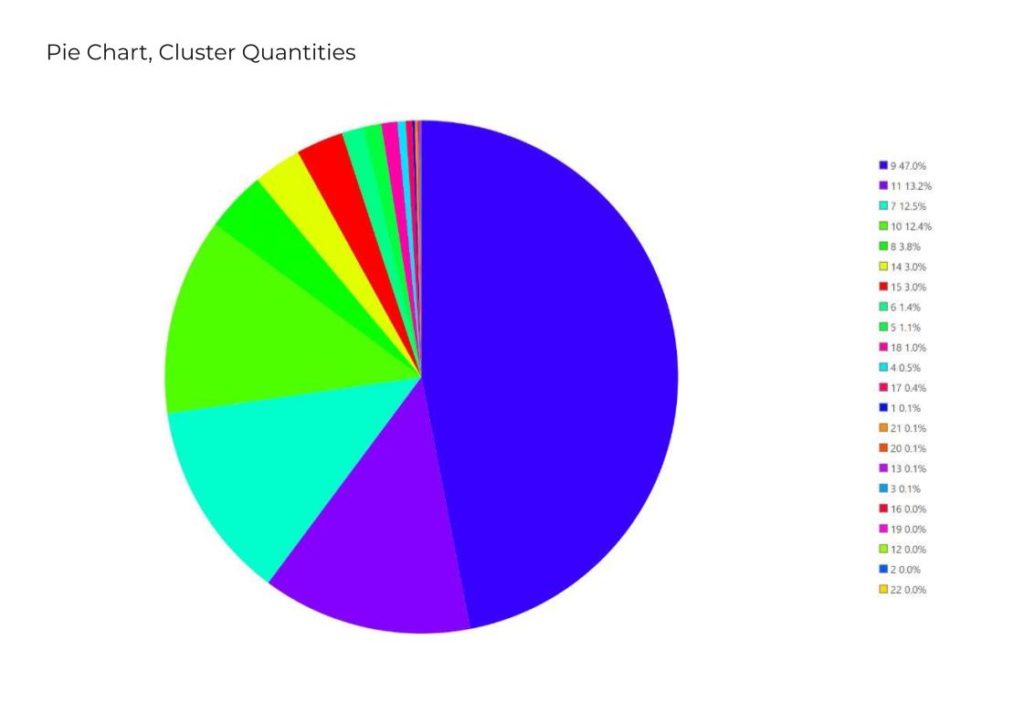
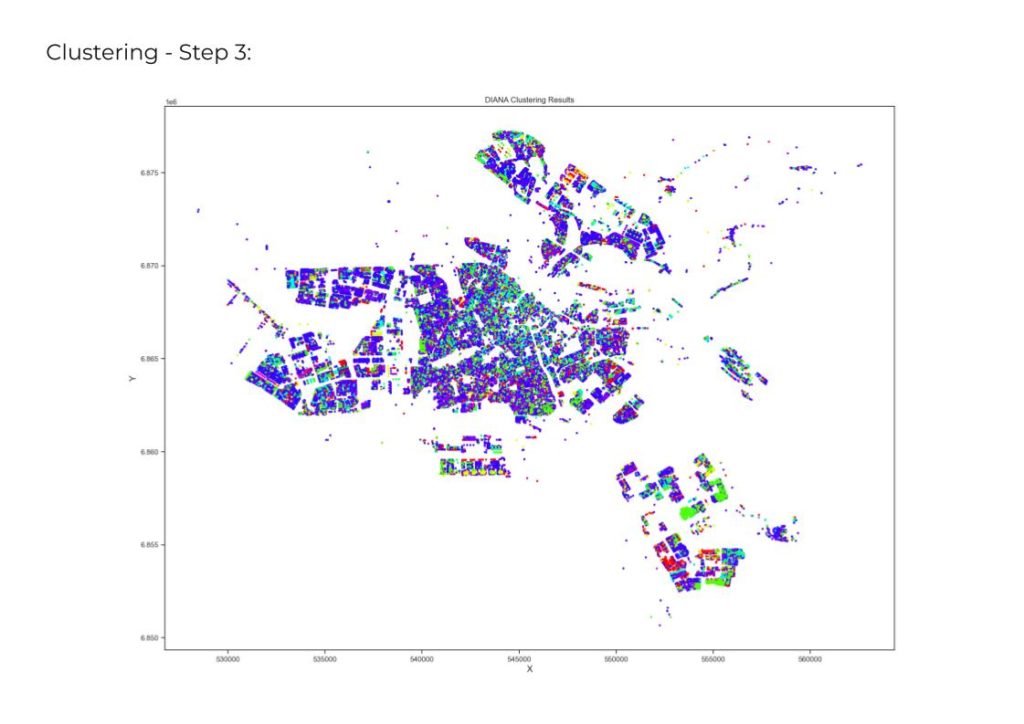

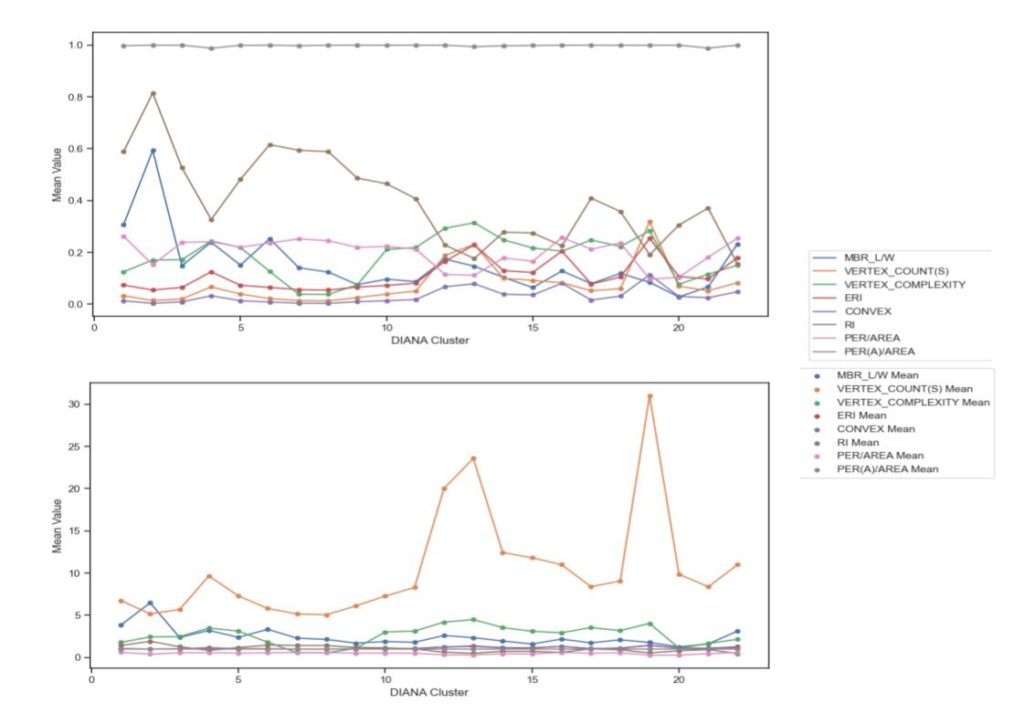
Results:
Clusters,
Geometric Size = 2
Geometric Complexity = 4
Clusters,
Geometric Size = 4
Geometric Complexity = 14
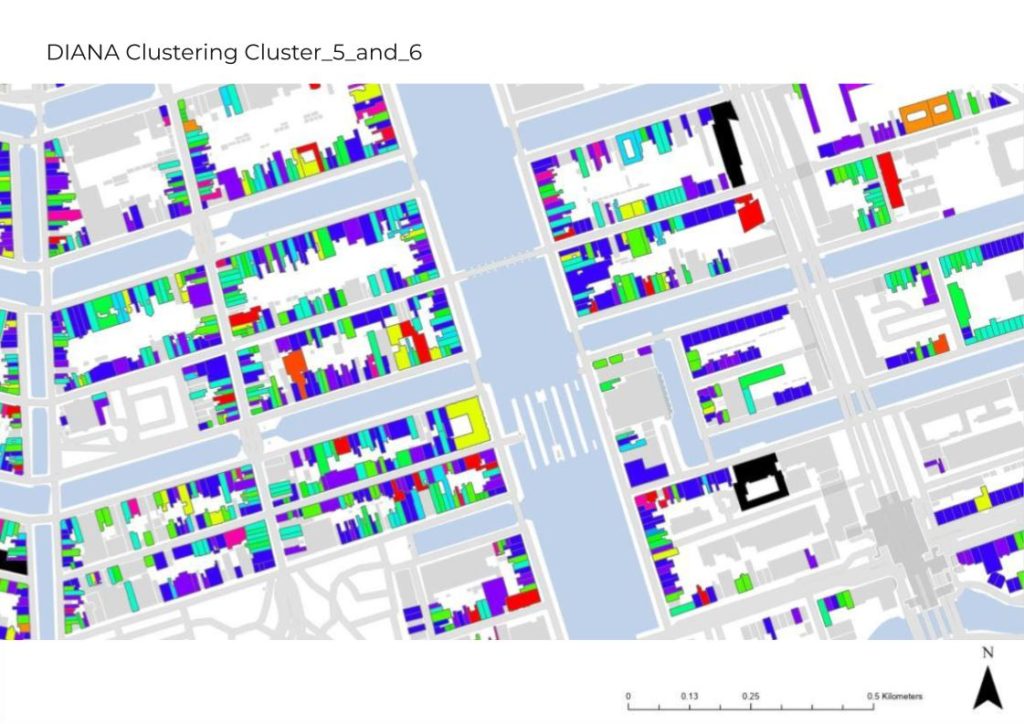
Clusters,
Geometric Size = 6
Geometric Complexity = 9
Clusters,
Geometric Size = 15
Geometric Complexity = 11
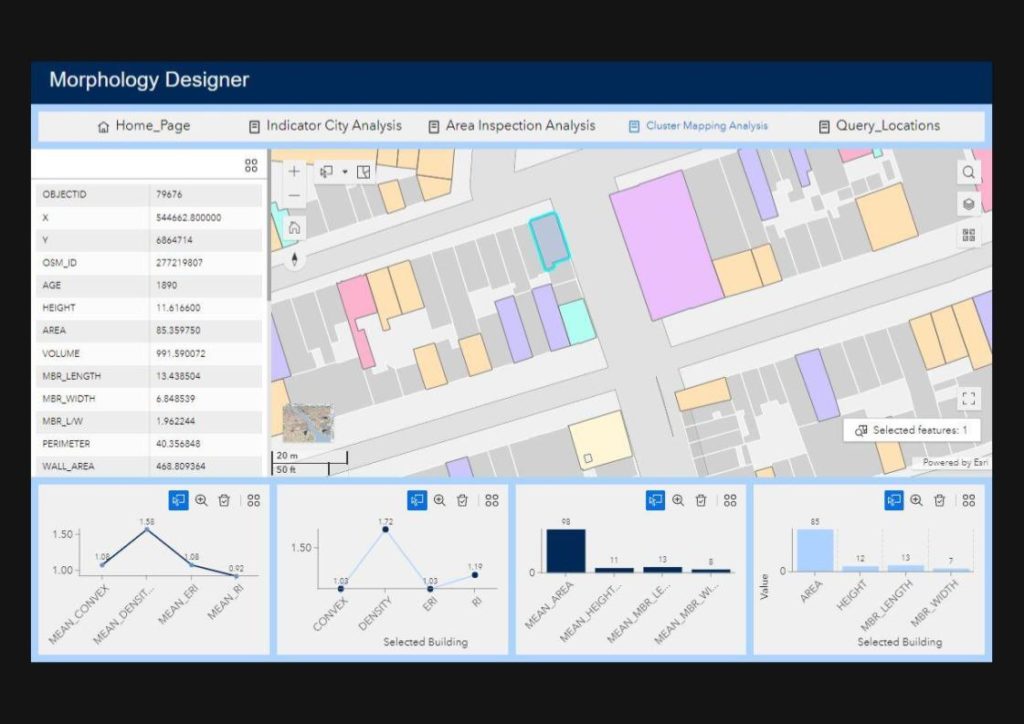
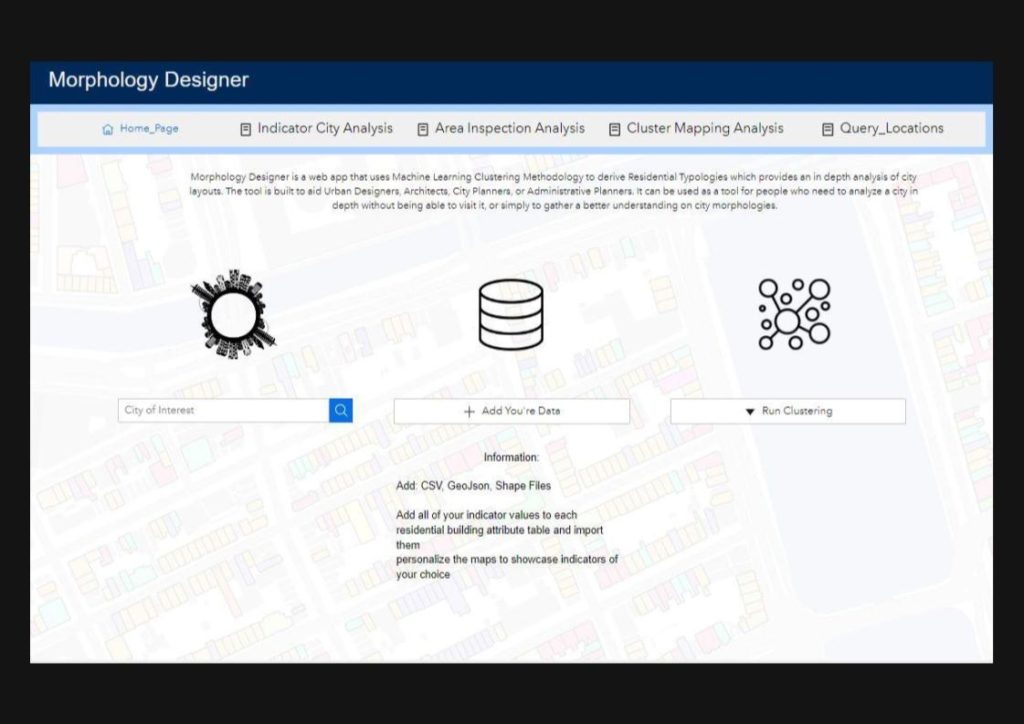
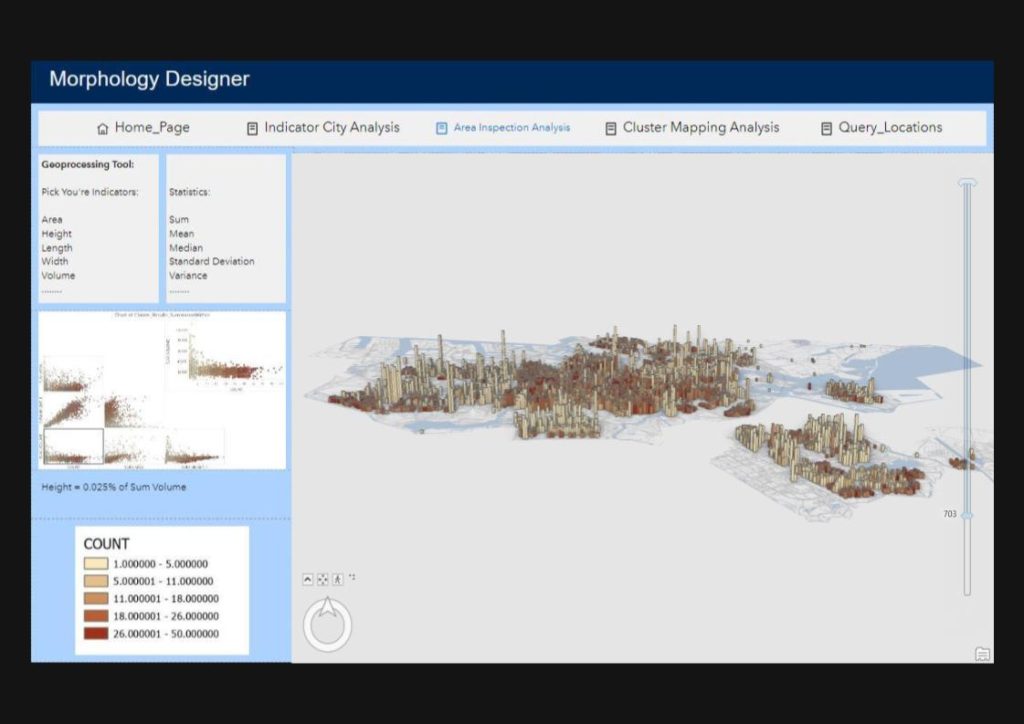
Web Application
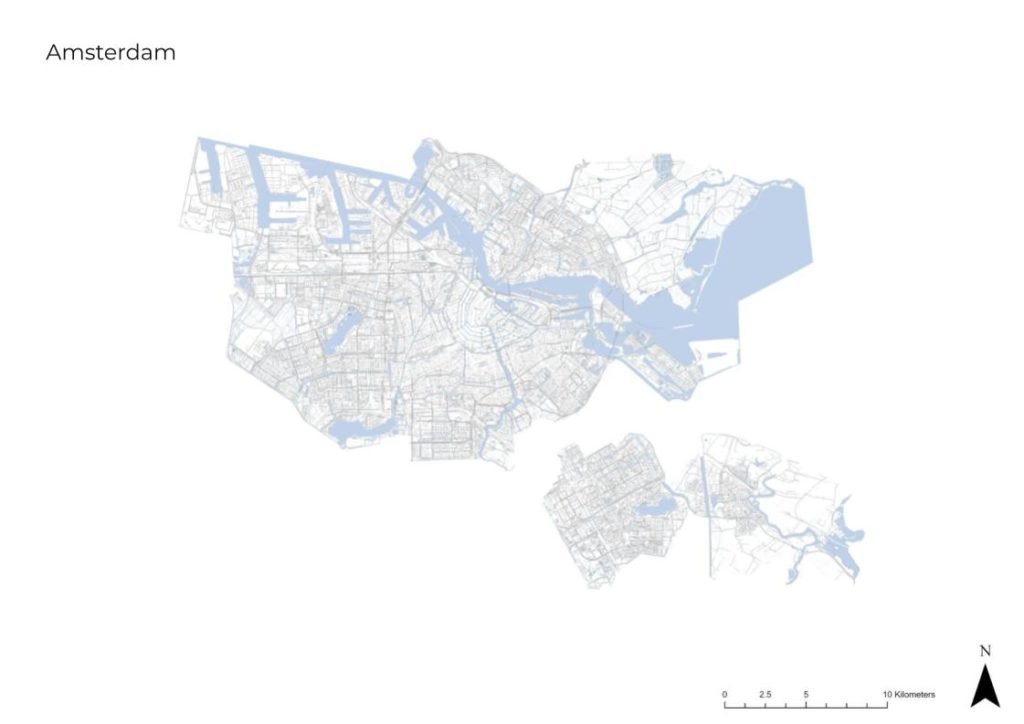
The thesis project is a study carried out regarding Amsterdam, with the aim to create a tool in which people can add their own data (and indicators) and run the clustering and geoprocessing in the web page.
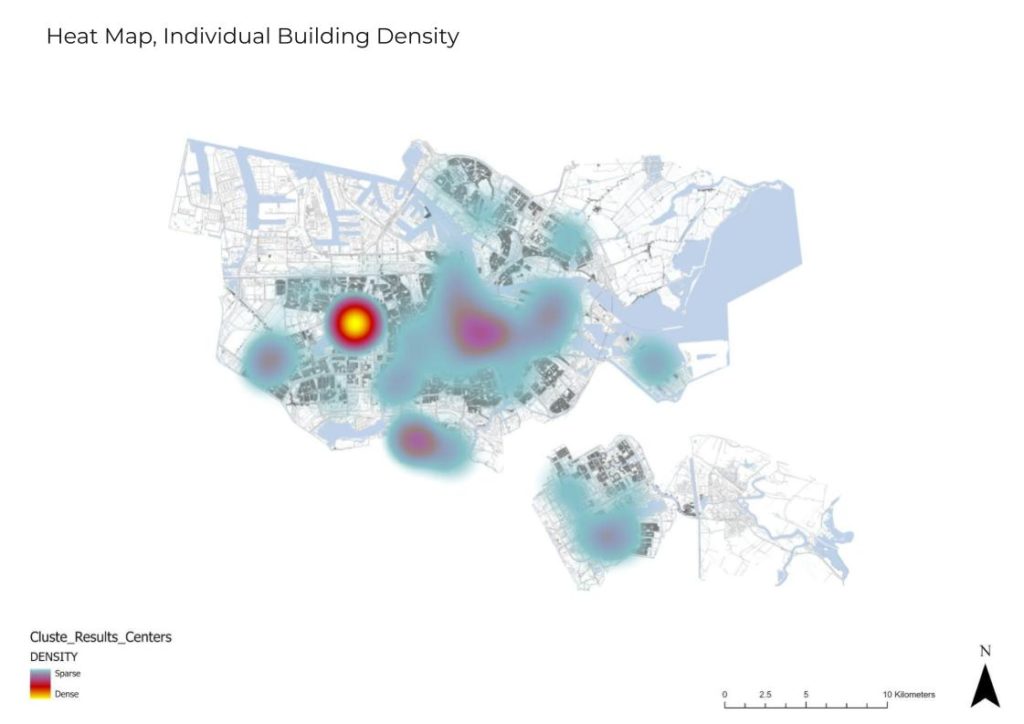
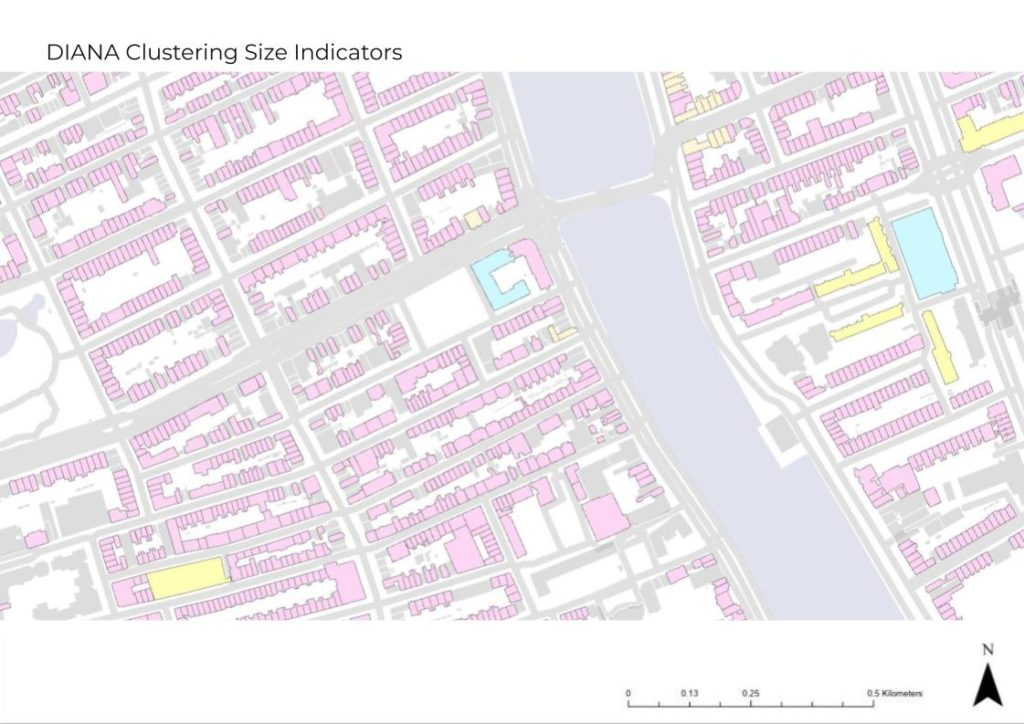
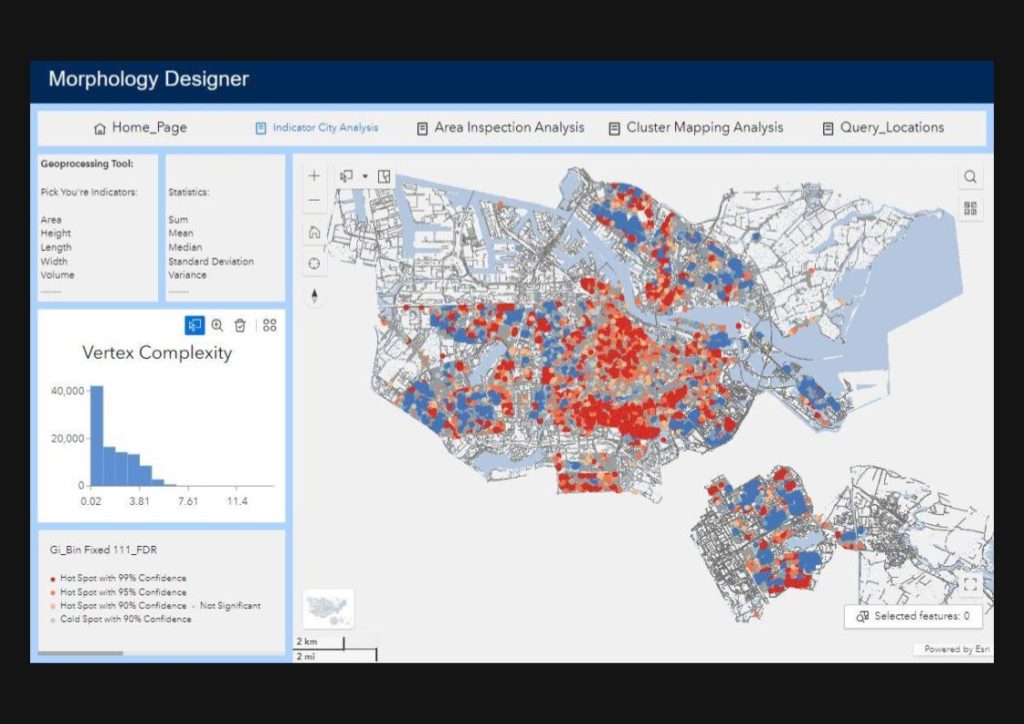
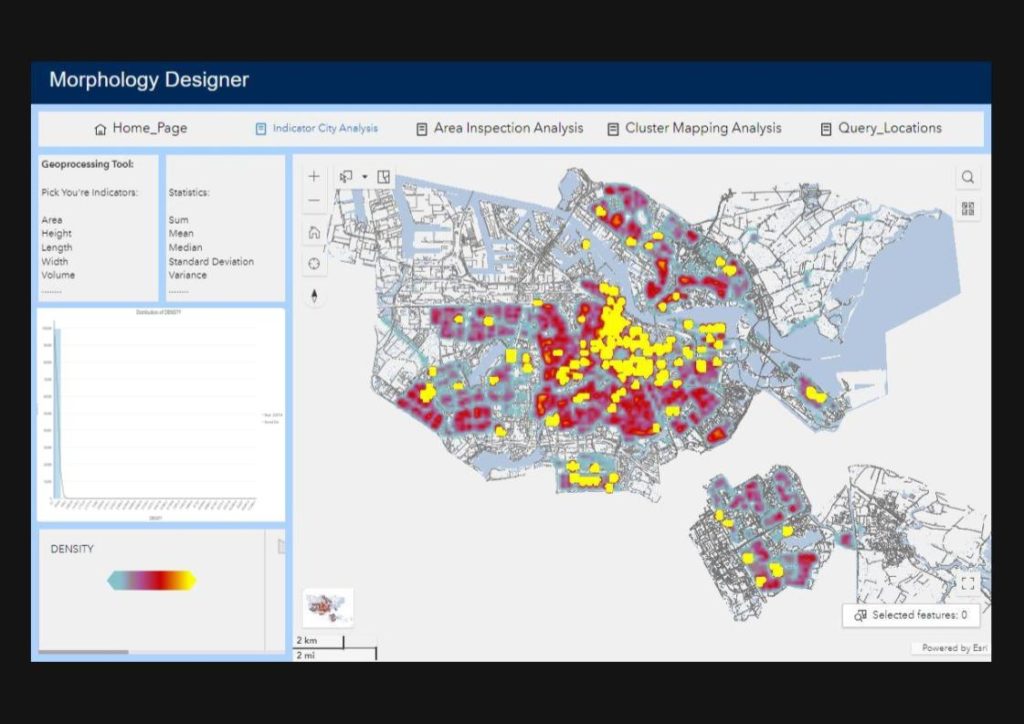
It begin by analyzing the city an discovering the location of buildings with the highest values of chosen indicators.
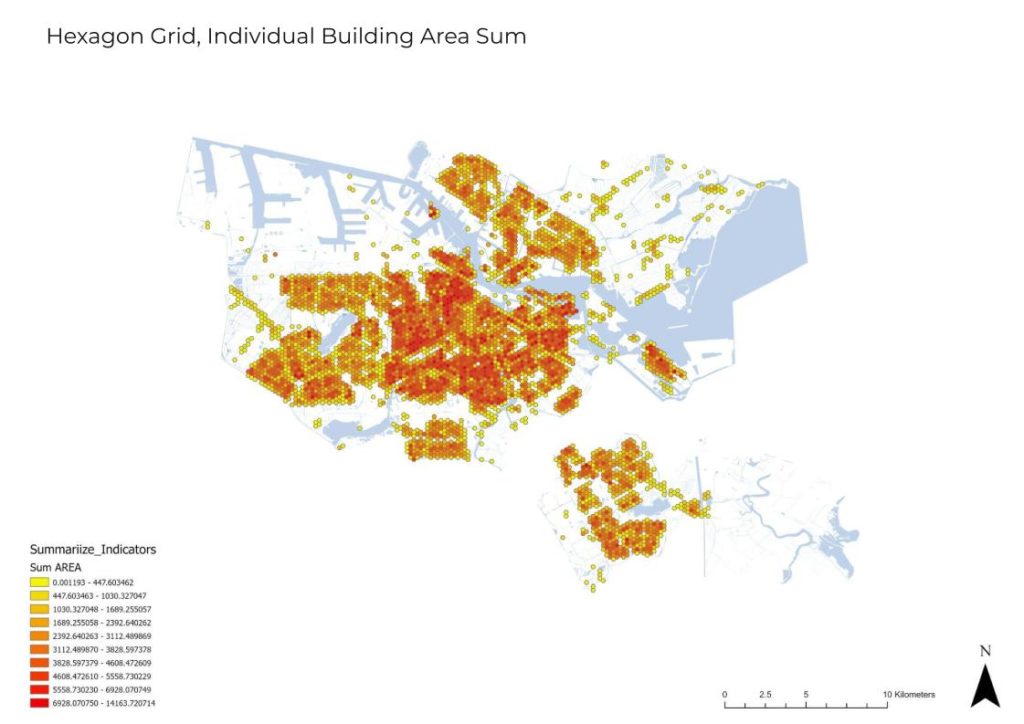
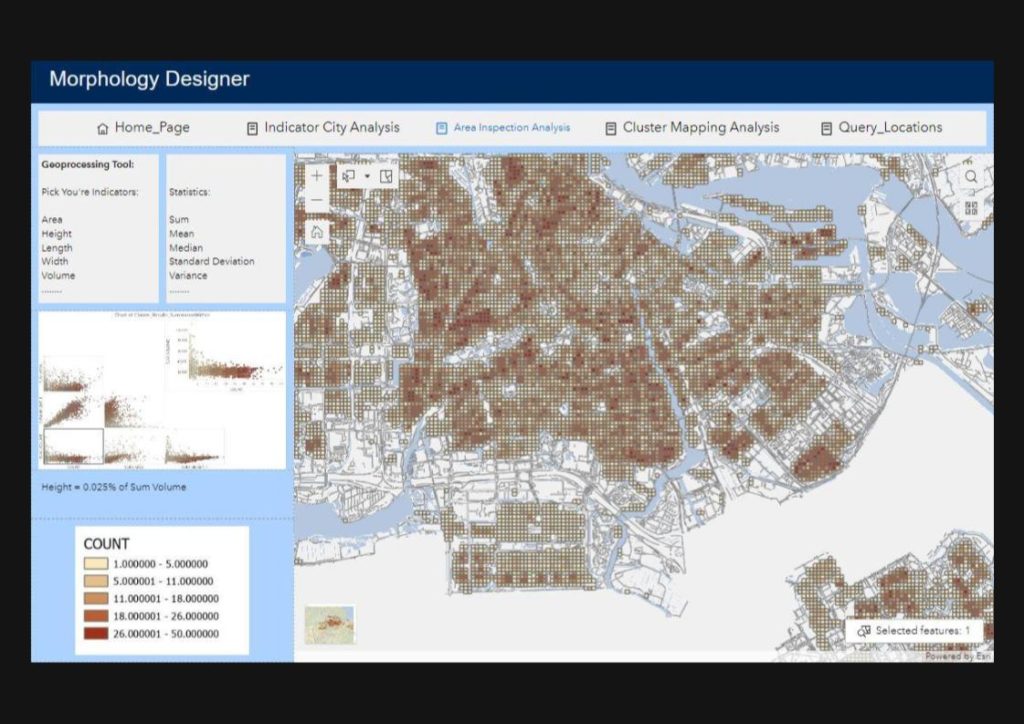
Analyze different areas based on a grid. In the example I created a comparative of 3 indicators:
The colors representing the count of buildings intersecting each square
The Z value represents the Sum volume in each square.
The range slider allows a filter based on the Sum Area within each square
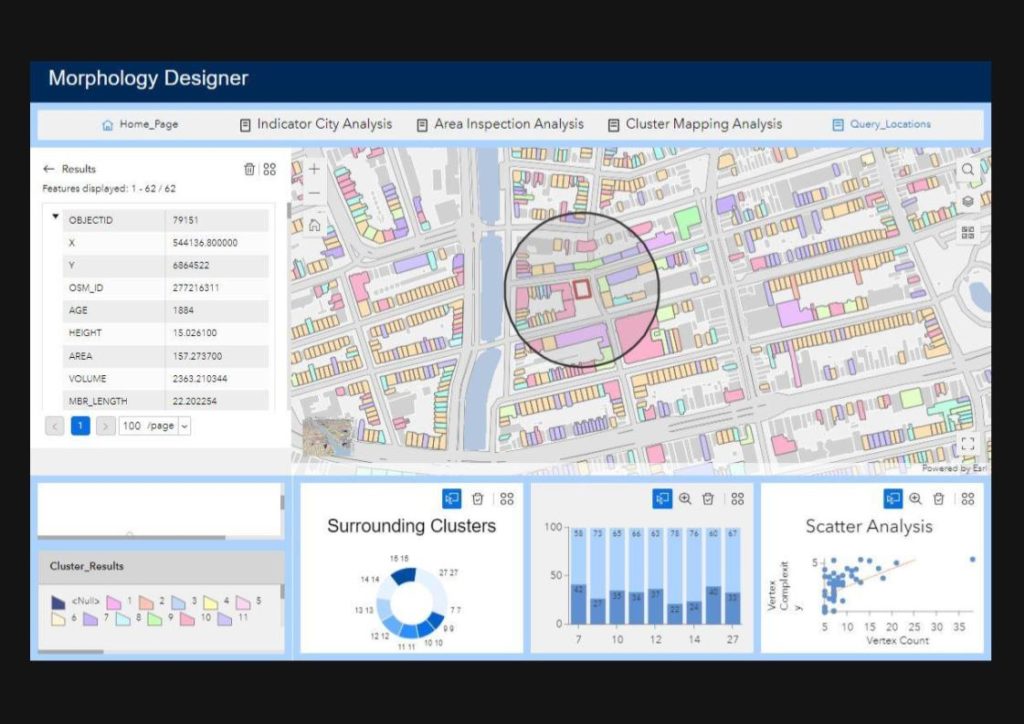
I want people to be able to visualize and compare the results of selected buildings indicators with the same cluster value indicators( the mean is used). This needs to be done in 2D and 3D
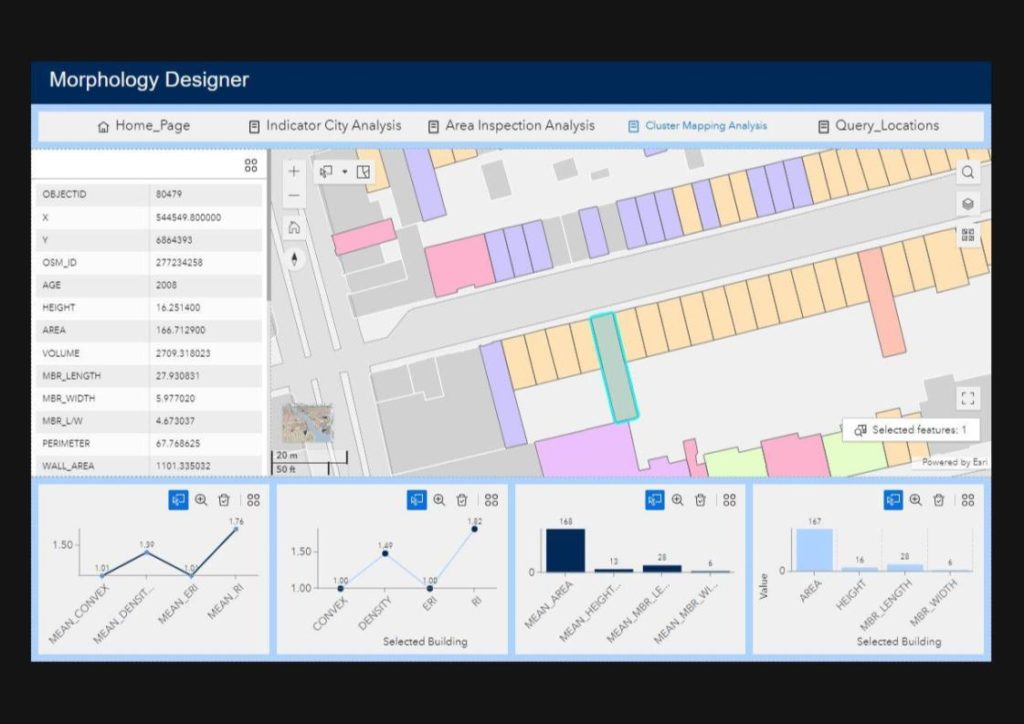

Finally, I want people to be able to analyze specified areas of their choosing, in this case below a site is added to the map and then a buffer is created surrounding it, analyzing the cluster values within the chosen area, and some related indicators.