
Exploring future cities through balancing global & local agendas

Located on what’s called the ‘Coromandel Coast’ of South East India, Chennai is home to a population of over 10 million people, approximately. Earlier known as Madras, Chennai is part of the top 5 populous cities of the country and is located within the second most industrious state, Tamil Nadu.
Chennai is a culturally rich and economically dynamic city with a diverse population, thriving industries, and a blend of traditional and modern influences. Its cultural heritage, economic opportunities, and quality of life contribute to its status as one of India’s most important metropolitan centers.
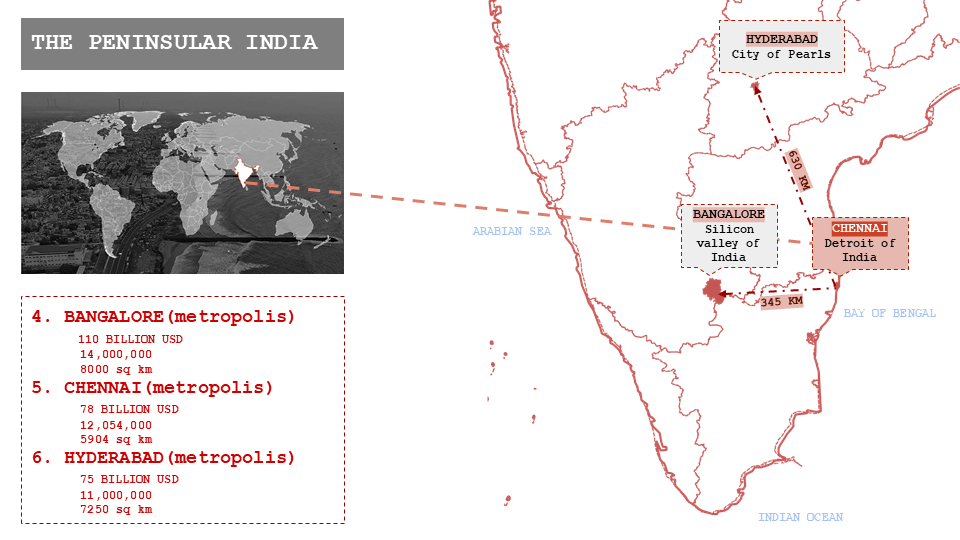
Chennai Metropolitan Area(CMA) is located in close proximity to other important metropolitan hubs, such as Bangalore and Hyderabad, creating smooth and easily accessible corridors of economic growth and trade. Chennai is also a major port city, and this contributes to a large part of its economic viability as a city.
ANALYSING CITY CONTEXT
DEMOGRAPHY
According to the 2011 census, Chennai had a population of approximately 7 million people. The city’s population has continued to grow steadily due to factors such as urbanization, migration, and economic opportunities.
ECONOMY
Chennai is a major economic hub in India, with a diverse economy spanning sectors such as manufacturing, information technology (IT), automobile manufacturing, healthcare, and education. The city is known as the “Detroit of India” due to its thriving automobile industry.
EDUCATION & HEALTHCARE
Chennai is home to several prestigious educational institutions, including the Indian Institute of Technology Madras (IIT Madras), Anna University, and Madras Medical College. The city also has numerous hospitals and healthcare facilities, making it a healthcare destination in South India.
INFRASTRUCTURE & TRANSPORTATION
Chennai has well-developed infrastructure, including roads, railways, ports, and airports. The city is served by Chennai International Airport, Chennai Central railway station, and Chennai Port, facilitating domestic and international trade and travel.
QUALITY OF LIFE
Chennai offers a relatively high quality of life, with access to amenities such as parks, beaches, shopping malls, restaurants, and cultural venues. The city’s pleasant climate, lower cost of living compared to other major Indian cities, and cosmopolitan atmosphere make it an attractive place to live and work.
DEVELOPMENT HISTORY
CHENNAI OVER TIME
The urban extents of Chennai grew from 50sqkm in 1980’s to 5904sqkm in 2020, where Chennai got segregated into the Chennai City and Chennai Metropolitan Area over a span of 40 years. The primary reason for the expansion was due to the need to accommodate the population growing at an average of 2.3% every year. In doing so, the city’s boundaries expanded mostly to the south and west of Chennai city and away from the Bay of Bengal, but also including the smaller wards on the perimeter of the entire city.
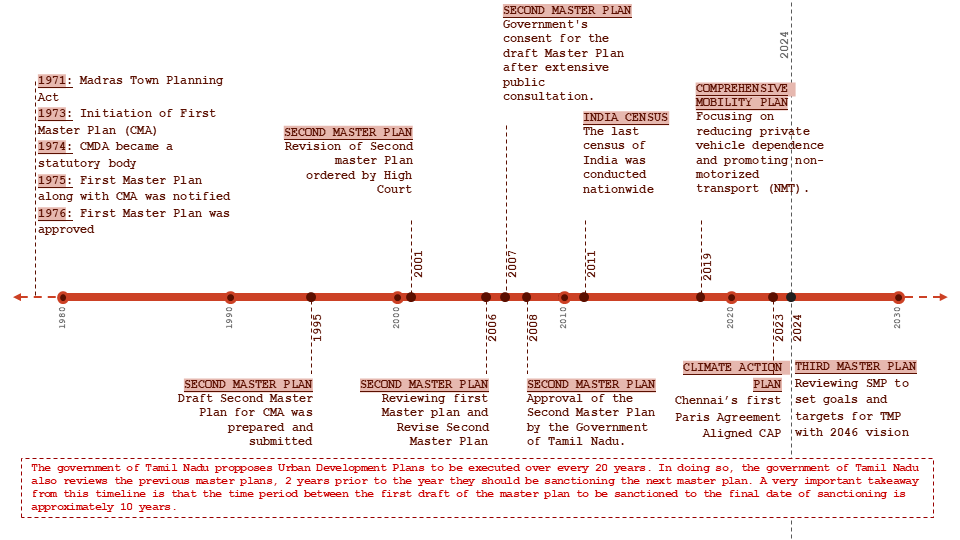
A TIMLEINE OF EVENTS ALONG THE PLANNING & DEVELOPMENT OF CHENNAI METROPOLITAN AREA (CMA)
After India gained her independence, city planning of all the major cities of India became a major process. Amongst those cities, Chennai was the fifth metropolitan that saw shifting patterns of urbanisation. In 1976 the first masterplan was approved for Chennai Metropolitan Area with a vision of major urban expansion until 2006, i.e. within a time span of 30 years. However, after the first masterplan was implemented the draft for second masterplan by the Chennai Metropolitan Development Authority was begun within 20 years from the approval of first masterplan. However the approval for the second masterplan took about 10 years and was finally sanctioned in 2008.
UNDERSTANDING HIERARCHY AND THE CENTERS OF DECISION MAKING

FIRST MASTER PLAN : 1976 – 2006
After the independence of India, the first masterplan that was drawn and approved for Chennai was in 1976. This masterplan was drawn with the vision to address issues like traffic congestion, environmental degradation and infrastructural need to cater to the growing population of the city in the next 30 years from 1976 until 2006. The masterplan also focused on the conservation of water bodies and heritage sites, improving urban amenities and expanding city’s boundary to the Chennai Metropolitan Area, to accommodate the growing population.
Since the First Master Plan, Chennai’s population growth has aligned closely with projections, reaching 7.1 million by 2001. The plan that needed to be proposed in 2008 closely aimed to manage this growth through decentralization and infrastructural expansion.

SECOND MASTER PLAN : 2006-2026
While strategizing the second masterplan that was sanctioned in 2008 with a vision until 2026, the Chennai Metropolitan Development Authority(CMDA) took into account the population and settlement growth outside CMA, especially along the main corridors of transport as well as economy. The CMDA along with GCC(Greater Chennai Corporation) demarcated areas of significant ecological and water resource values for preservation and conservation within the second masterplan. The second masterplan, however, was drawn taking into consideration the UN Sustainable Development Goals for 2030(SDG’s).
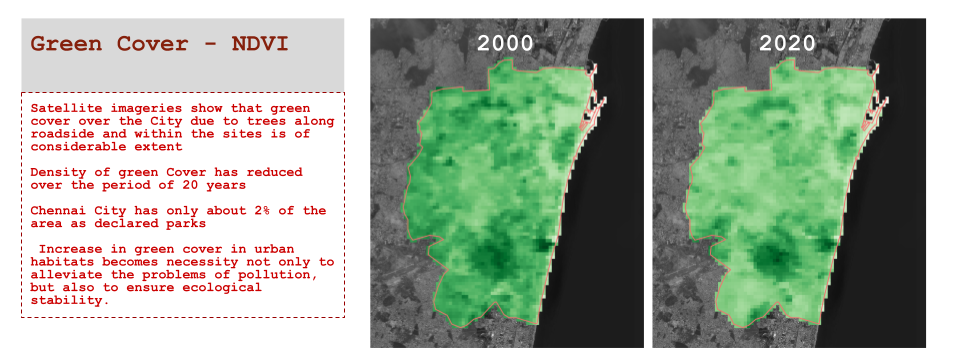
The revised masterplan for 2026 aims at significantly increasing green spaces within the city and the metropolitan area, but specially along the 2 main river. The importance of increasing green spaces along the rivers is because of the threat of flooding that these rivers pose to Chennai city during peak monsoon season, but also to maintain the ecological sanctity of the area. Significantly, the second masterplan aimed at increasing the green and open spaces in Chennai city from 2% in 2006 to 5.7% in 2026.
A major shift that was imposed in the second masterplan was the implementation of the mixed residential land use. The mixed residential areas are the commercial zones from the first masterplan on top of which housing units have been built. This was primarily done so that the land could be used more effectively and to prevent it from lying underutilized or frozen in time.

AN AUDIT THROUGH THE LENS OF UN SDG’s
The United Nations Sustainable Development Goals (SDGs) serve as a universal call to action to end poverty, protect the planet, and ensure prosperity for all. These goals provide a comprehensive framework for countries to address the most pressing social, economic, and environmental challenges facing humanity.
For comparative and statistical analysis, the SDGs offer a common language and set of indicators that enable countries to assess their progress in achieving sustainable development. By cross-referencing metrics related to each goal, countries can identify areas of success and areas needing improvement.
The Second Master Plan (2008) had various targets within 3 major SDG’s, that are;
- SDG 3: Ensure availability and sustainable management of water and sanitation for all
- SDG 9: Build resilient infrastructure, promote inclusive and sustainable industrialization and foster innovation
- SDG 11: Make cities and human settlements inclusive, safe, resilient and sustainable
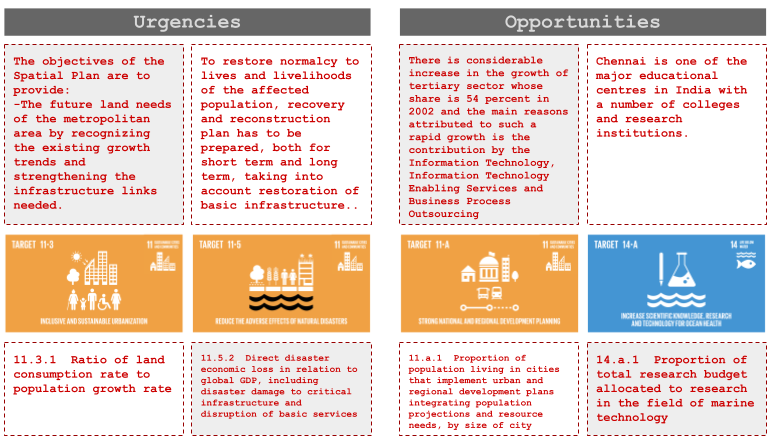
HOWEVER AFTER A TENDER ANALYSIS AND FROM CMDA DOCUMENTS 2 URGENCIES AND 2 OPPORTUNITIES WERE HIGHLIGHTED
Building upon the city’s strengths, amidst the multiple opportunities, we identified 2 areas of interest should the need arise to explore further, metrics based on the considerable increase in the growth of tertiary sector whose share is 54 percent in 2002 and the main reasons attributed to such a rapid growth is the contribution by the Information Technology, Information Technology Enabling Services and Business Process Outsourcing; as well as considering that Chennai is one of the major educational centres in India with a number of colleges and research institutions.
11.3.1 Ratio of land consumption rate to population growth rate
Impermeable surface mapping crucially informs urban expansion by highlighting disproportionate land use compared to population growth, aiding in sustainable planning and ensuring efficient, resilient urban environments.
35% GROWTH IN BUILT UP DENSTY
18% GROWTH IN POPULATION DENSITY WITHIN THE CITY

11.b.1 – Proportion of local governments that adopt and implement local disaster risk reduction strategies in line with national disaster risk reduction strategies.
11.5.2 Direct disaster economic loss in relation to global GDP, including disaster damage to critical infrastructure and disruption of basic services
In Chennai, flooding disproportionately affects informal settlements situated near flood-prone areas, exacerbating vulnerabilities among these communities. The dense, often unplanned nature of these settlements intensifies the impact of flood damage, highlighting an urgent need for integrated urban planning and enhanced disaster risk reduction strategies to safeguard and empower the most at-risk populations.
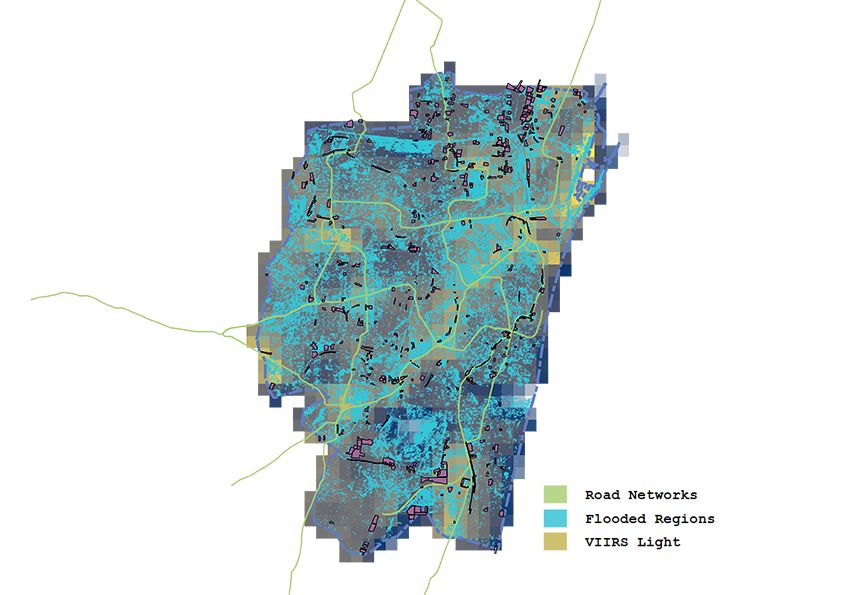
The maps adjacent depict the stagnated water around the period of November – December, which happens to be the peak rainfall season for the city.
One can notice that the city is completely covered with pockets on stagnated water. Although this dataset was recorded along a bout of record breaking rainfall, it serves as an indicator to the extent across which the city is affected. Slums tend to be the worst affect as can be seen on the map
It was important to consider the impact that these floods would have of the economy, given that this was a metric that was listed amongst the UN SDG Metrics; although at a national scale. We identified based on spatial analysis of that city that a large portion of the water stagnation areas coincided with key economical corridors, as highlighted in the map showing the city night lights.
We iterated an approximation of a figure that would indicate the productivity loss the city faced from a 10 day disruption to routine life in the city, caused by the stagnation of flood water and the city’s incapability to drain/remove said water. Keep in mind that within the City limits, most of productive activity comes from the tertiary/service sectors, we calculated a productivity loss to the city and state amounting to $500 Million over the course of 10 days. This is 0.6% loss of annual GDP for the city of Chennai.
A CITY IN PICTURES

LESSONS LEARNT
The tools helped us understand that population growth could be clearly demarcated through the analysis of the expansion in Built Up Density of a particular location. Auditing economical impact along the guide lines of the UN SDG’s isn’t possible on a smaller/local context, as the indicators were designed as a medium for international comparison and addressed the quantitatives of a nation as a whole; however proxy indicators and calculation allow us to make reading along similar lines and can be helpful to a municipality or city corporation.
atellite images are more and more used to identify the areas to be considered. Governments, especially in developing nations need to support remote sensing derived products , as they serve as a multi use case tool for quick and effective analysis. This argument holds even more weightage when the country in question is lacking up to date, thereby, relevant, census data from their population.
There is a pattern of compounding on lessons learnt given that Chennai is now in the process of drafting a 3rd master plan. There are visions adn lessons learnt from previous master plans, which begs the question on whether it is indeed a fruitful process to reevaluate/redraw a fresh master plan every 20 years as cities are able to learn from mistakes during periods of audit such as when developing master plans.
The spatial plans are developed according to spatial strategies and findings from previous master plans and ground realities in the moment. The flaw in that sense is not making the resources and knowledge more open source, as this can lead to old ideas being rehashed and prevention of innovation. The Government/Coorporation web interface and UI is clunky and makes it difficult to extract relevant information,
Another major flaw in the entire system is the amount of time the entire process of approvals take, having to go from city to state to national levels for approval. There is a lot of scope for streamlining within this particular avenue, and could potentially save the government a lot of time and money, along with the fact that processes could be more speedily developed.
