INTRODUCTION
The competition is based on the 2016 NYC Yellow Cab trip record dataset. The challenge is to build a model that predicts trip duration for New York City taxis using machine learning. The dataset includes pickup time, geo-coordinates, number of passengers, and several other variables. Based on individual trip attributes, a code was written to predict the duration of each trip in the test set.
steps used in the approach
Data exploration: Understanding the data and identifying any patterns or anomalies that can be useful for the modelling stage. Explore the different features, their distributions, and their correlations with the target variable (trip_duration).
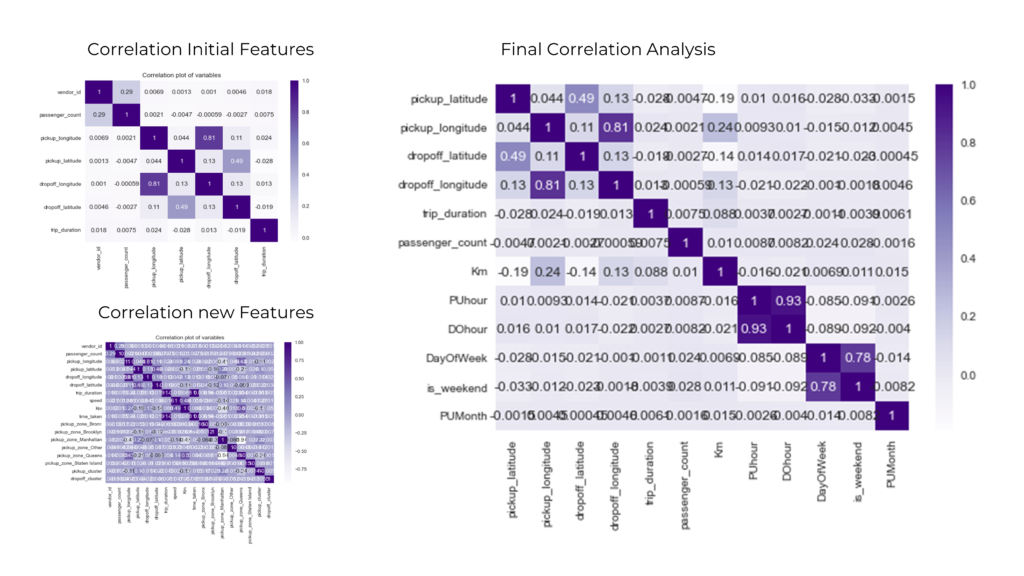
Correlation Analysis
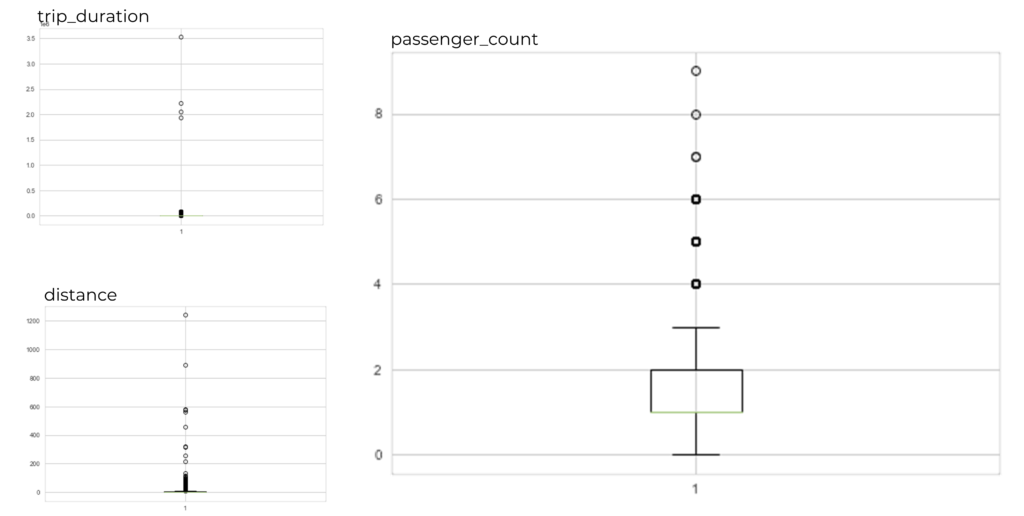
Removing outliers
Removing outliers: Outliers are extreme values that are far away from the majority of the data, and they can distort the model and lead to inaccurate predictions.
Preparing the data: Checking for missing values, outliers, and anomalies. Identify potential problems with the data, and determine what cleaning and preprocessing steps need to be taken.
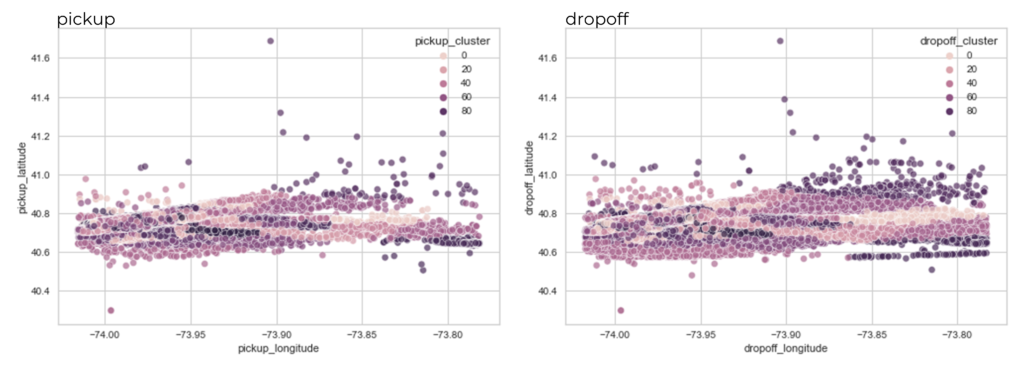
Feature engineering: Once the data was understood judiciously, new features were created that added additional information about the trip, such as the distance travelled, the time of day, the day of the week, and clusters of the pickup/dropoff locations.
Location clusters
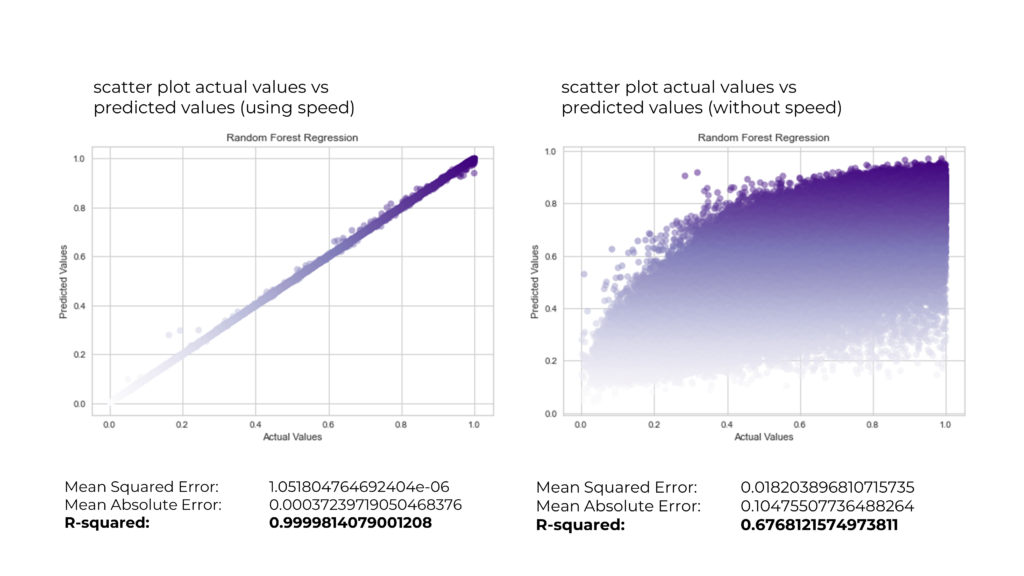
Model selection: Many machine learning algorithms can be used for the regression task. Experimentation with different models and hyperparameters was conducted to find the best one. The ones used in this analysis were:
- Simple Linear Regression
- Multiple Linear Regression
- Decision Tree Regression
- Random Forest Regression
- Polynomial Regression
- Polynomial Regression
- Adding L2 regularization to the model using the Ridge regression method
- Multiple Polynomial Regression