Introduction
In some cities one of the important issues that needs to be resolved is the accessibility to a medical center in a short period of time to save people’s lives. Furthermore, in an emergency situations the ambulance should be able to reach to the patient and hospital as fast as it can without any delays.

Problem Statement
North Shore area In Greater Vancouver including two cities, North Vancouver and West Vancouver. In this area there is only one Hospital, Lions Gate Hospital, than can support these two cities. And this hospital is located in North Vancouver.
Because of the lack of narrow Highways and streets in North Shore, if there is an emergency situation in West Vancouver, the ambulance takes at least 30 min to arrive at the hospital which can jeopardize people’s lives. Therefore, this major issue in this area needs to be resolved and help people.
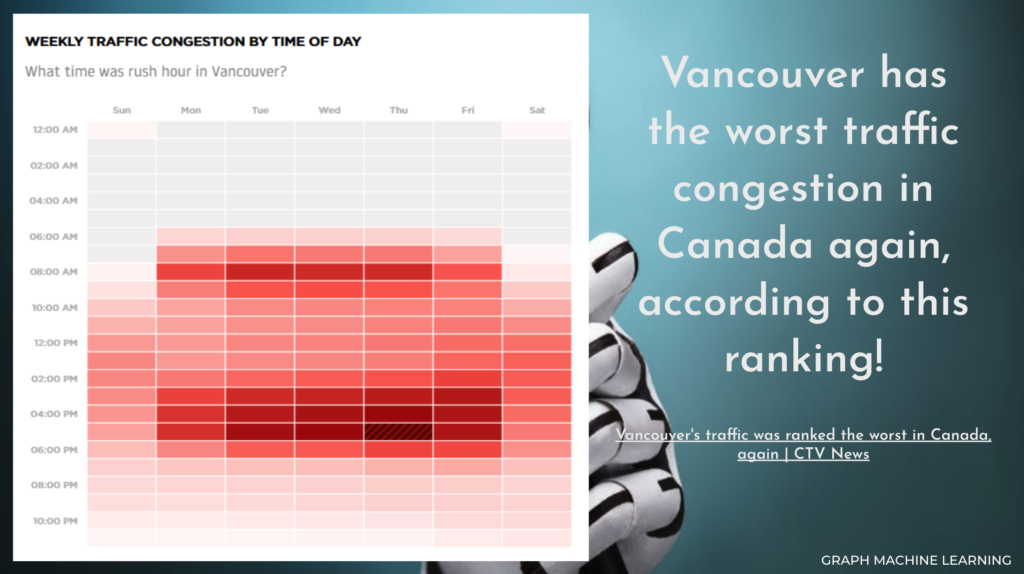
In 40th place worldwide, Vancouver is the worst city in Canada when it comes to congestion. While the city has fallen slightly from 36th place in 2018, the new data suggests last year was slightly worse. It ranked the congestion level at 39 per cent – up one per cent over the last two years.
Solution
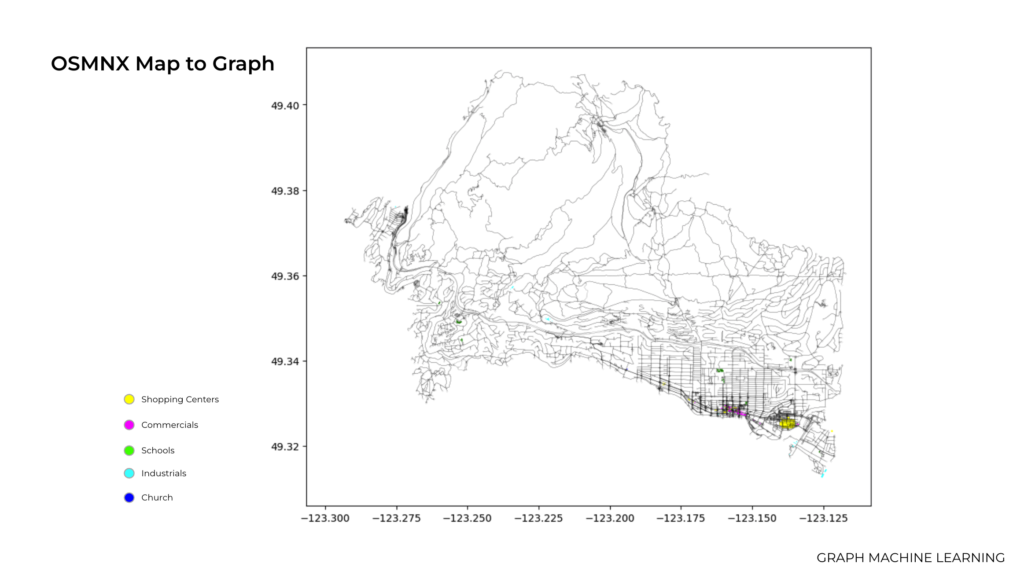
To resolve this issue we tried to use graph machine learning to find the optimum location to build a new building in North Shore area. Also we studied the population and traffic, roads and average age of the people living in North shore area. And then we used OSMNX Map to Graph, Shallow Embedding, Node2Vec, K-means clustering and HOPE (High-Order Proximity preserved Embedding).
DeepWalk Algorithm, Node2Vec
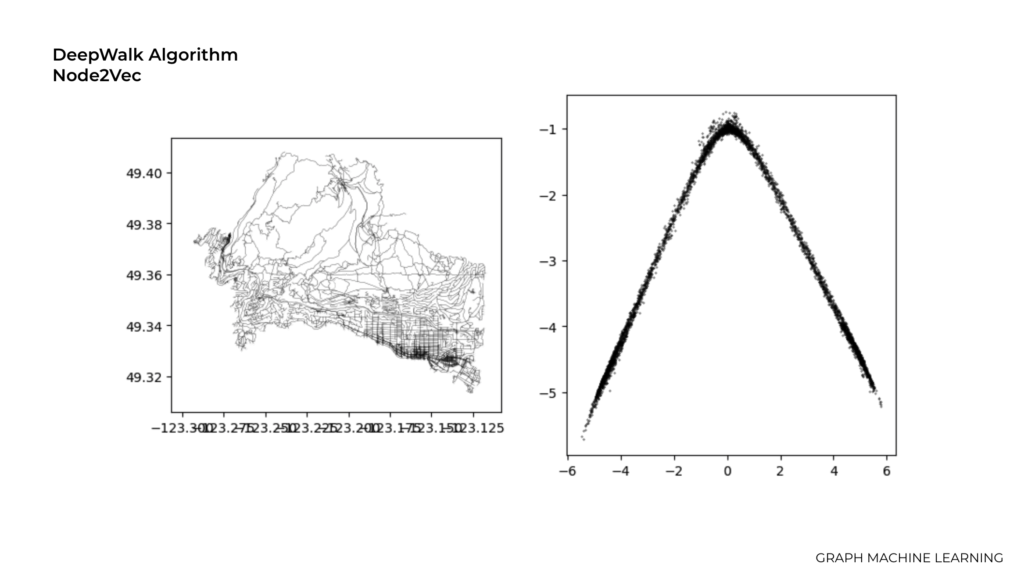
First we tried to use Node2Vec which is a popular algorithm learning node embeddings in graph data. we actually tried to fix the seed value to initialize a random number generator. Setting a seed ensures that the random numbers generated during the training process are reproducible.
The size of the embedding dimensionality of the embedding vectors in this graph is 2.
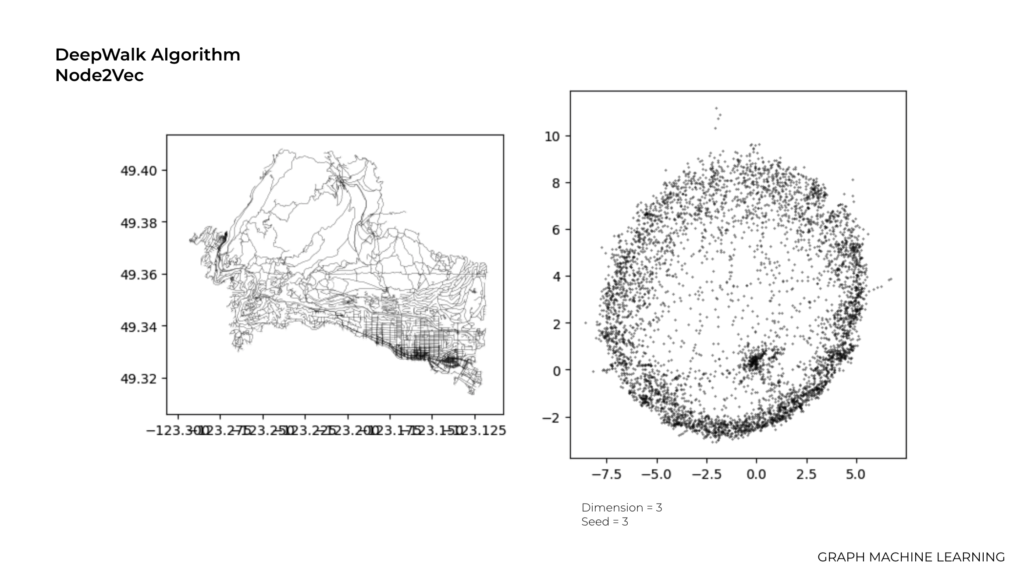
The length or dimensionality of the embedding vectors in this graph is 3.
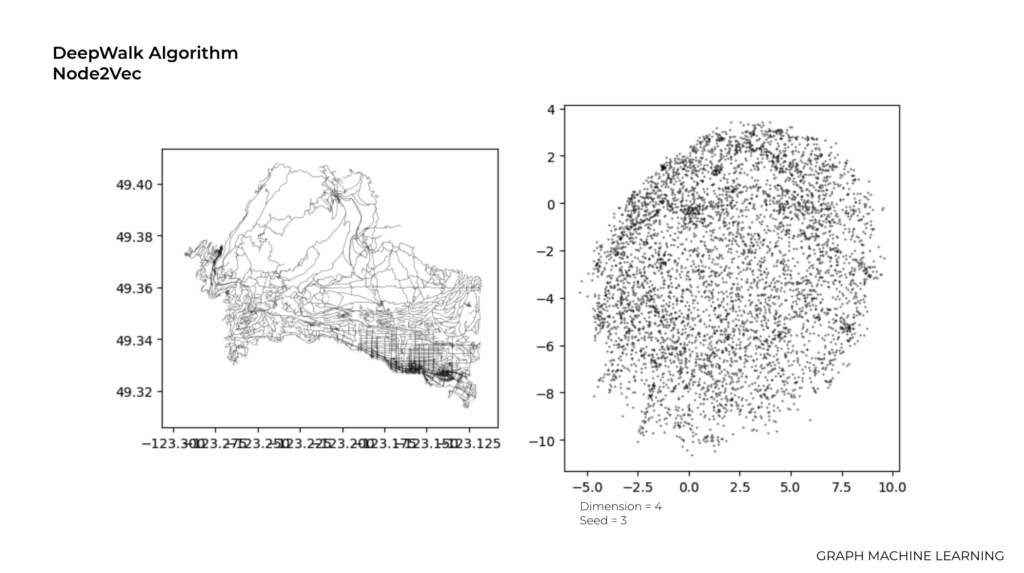
Here we have the value of 4.0 and the reason that we tried higher number is because the higher dimension allows for more expressive embeddings that can capture more intricate patterns and relationships in the graph.
K-means Clustering
In the context of inductive training we tried to make a group or categorizing data points (such as nodes in a graph) into distinct clusters based on their inherent similarities or relationships and train the machine learning model and then using that model to make predictions.
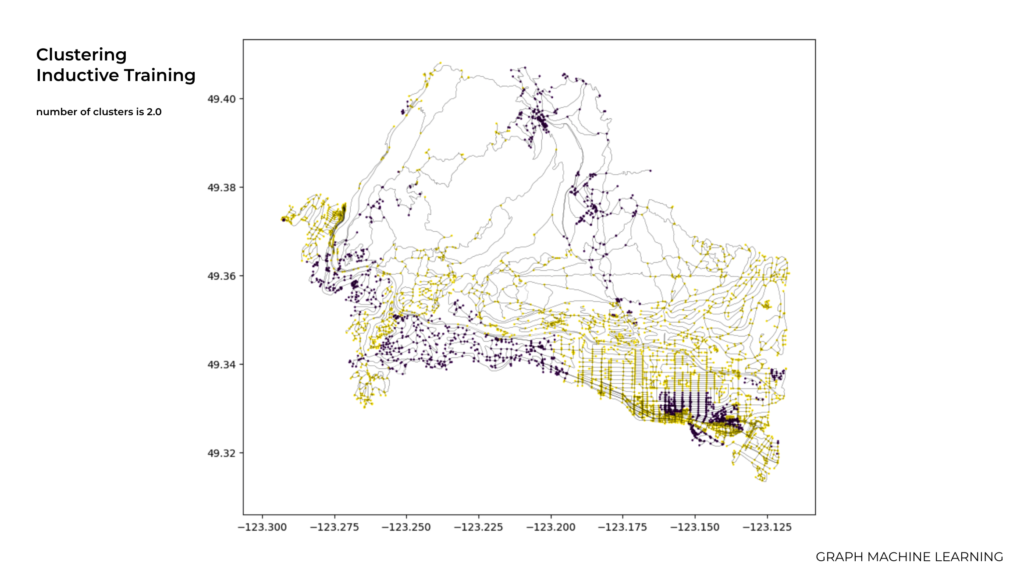
For instance in this slide as you can see we used the value of 2.0 for the number of clusters and In the next slides we tried to change the number of clusters in clustering for inductive training which is an important consideration, as it affects the quality and interpretability of the clustering results.
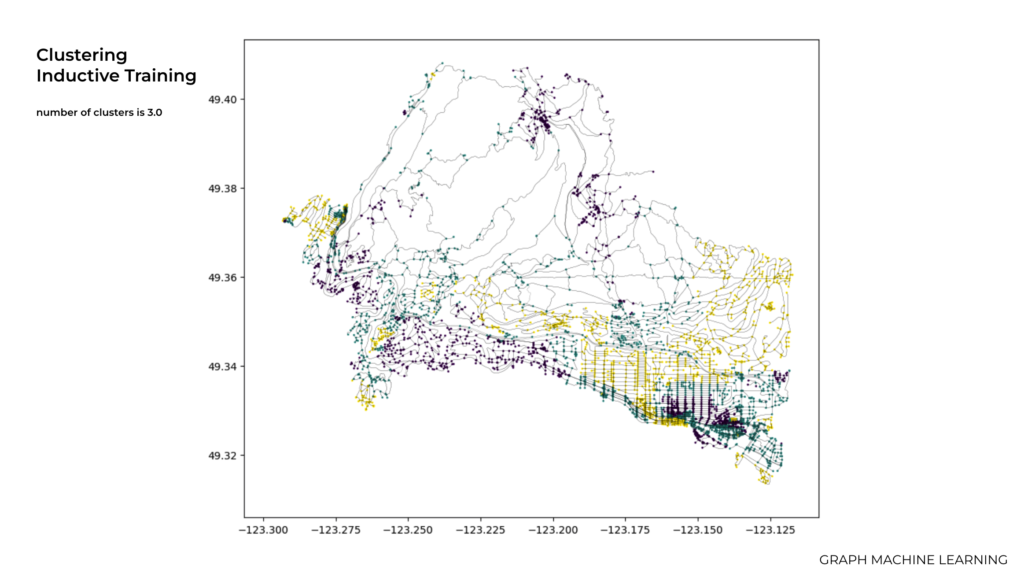
Here we used 3.0 which it shows more nodes and clustering.
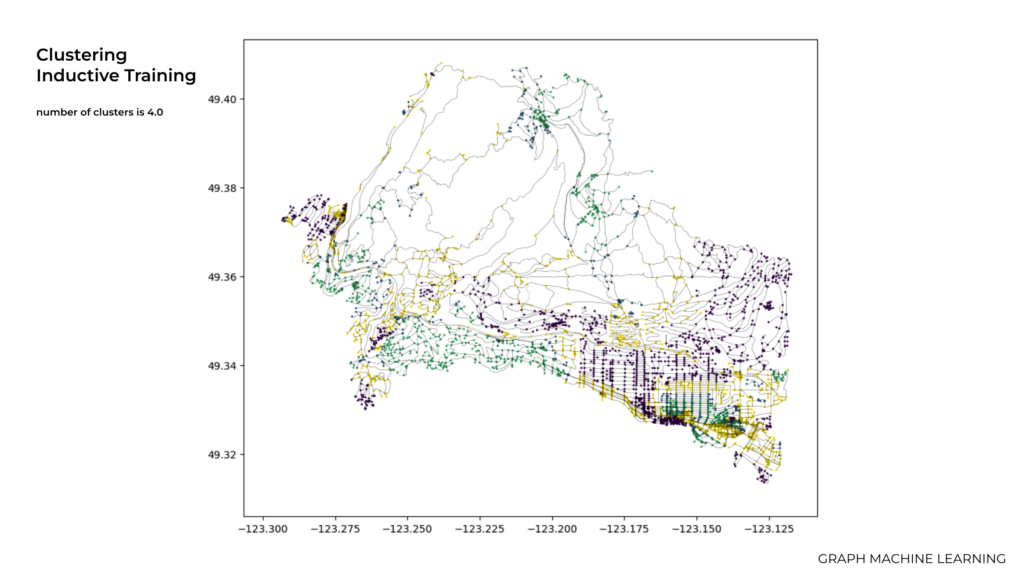
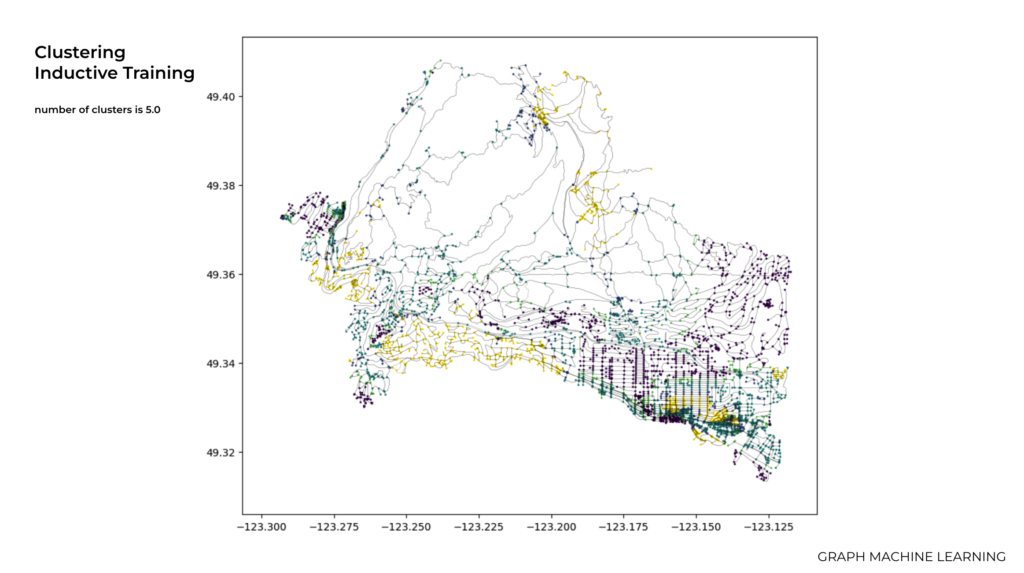
And finally in this graph we used the value of 5, however, Determining the optimal number of clusters is often a challenging task, and there is no definitive applicable method to determine the exact number of clusters.
HOPE or Higher-order proximity preserved embedding
The reason that we use this model of embedding is because it aims to capture higher-order proximity information in a graph by preserving the similarity between nodes based on their common neighborhood structures.
So basically as you can see in these three areas we have a higher-order adjacency matrix that represents the higher-order relationships between nodes, which effectively captures the common neighbourhood structures between nodes at different distances.
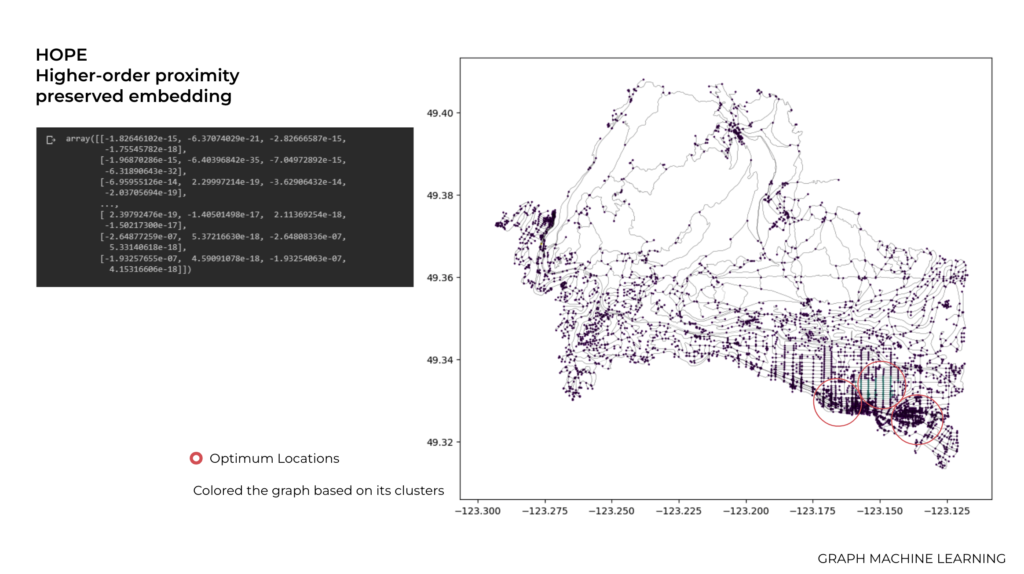
So as a result these three areas could be a potential locations for having Medical center for people living in this area.