
The assignment entailed harnessing the open data portal for the city of Melbourne with the aim to articulate a narrative revolving around data and technology within the cityscape. Our group initiated contact with several individuals possessing firsthand experience of Melbourne, who provided valuable insights steering us away from our preliminary topic of the potential correlation between street art and local crime rates.
Through their experiential knowledge, we ascertained that Melbourne, whilst having low crime rates, experiences exceedingly hot summers. With these insights in mind, we opted to focus on datasets involving tree canopy coverage, drinking fountain locations, and the gradient of pedestrian footpaths. These factors will serve as additional attributes contributing to the optimization of the shortest path algorithm, thereby facilitating the identification of a more suitable alternative transportation route during the summer months.
The project started with accessing the Open Street Map data, this was done in python with the OSMnx library as well as using the .OSM file downloads and the Caribu plugin for Grasshopper. We chose to use the grasshopper plugin because we needed to utilize Ladybug Tools to gather the environmental data at the core of the project. Once the pedestrian, walking, and footways were selected out of all the routes available the team took to sorting out the nodes and edges for the graph generation. Now the City of Melbourne’s data came into play, the tree canopy along with building massing for street shading, locations of drinking fountains and the footpath steepness.

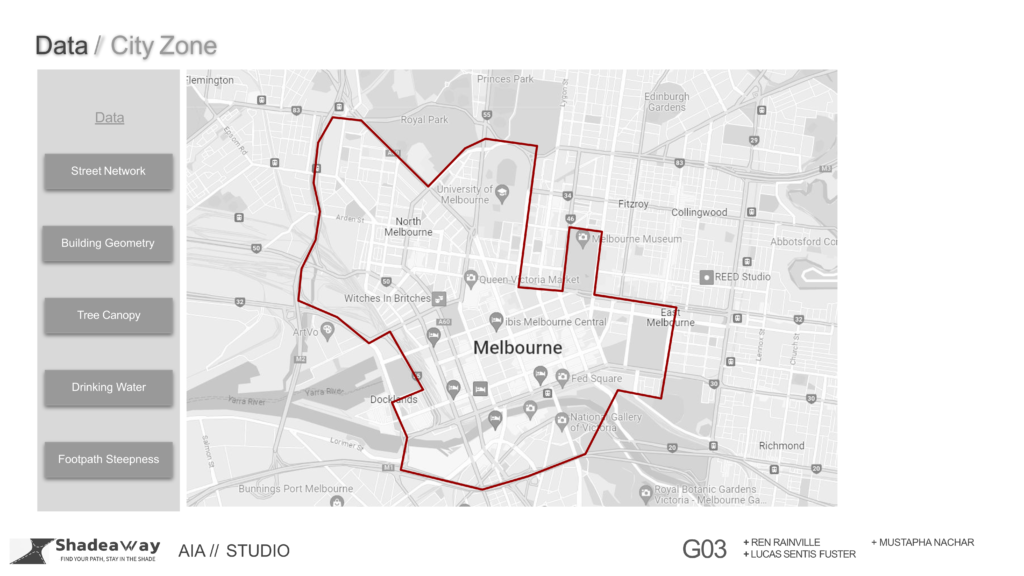
Seeing as the City of Melbourne is quite large, we chose to reduce our area of investigation to the polygon shown below.
The building massing from Open Street Map with an approximation of the tree canopy we were able to test the sun hours received at the center of each edge. The axon in center and the plan view in the lower right show the conditions in which we gathered our sun hours features for each edge.

For the drinking fountain feature, we felt pedestrians and other alternate modes of transportation would like to know where drinking fountains are located. We created a dome with a radius of 30m so this parameter was a True/False value a 0 or a 1, if a drinking fountain was within 30m of the edge.

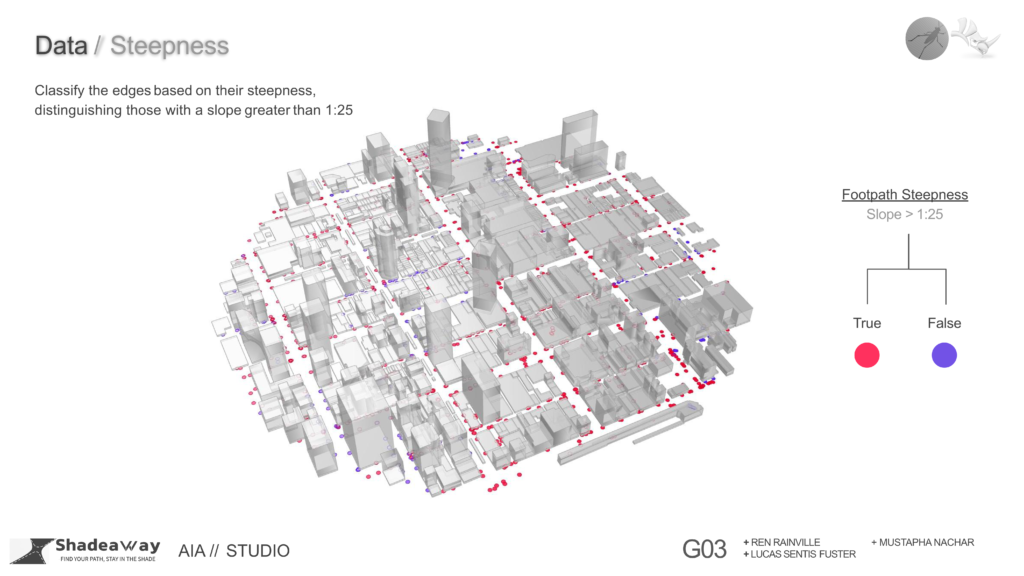
Footpath steepness, we found a few areas of downtown Melbourne were there were some steep. As seen below the edges where again we have a True/False parameter valuing 0 or 1, colored with blue or red respectively.
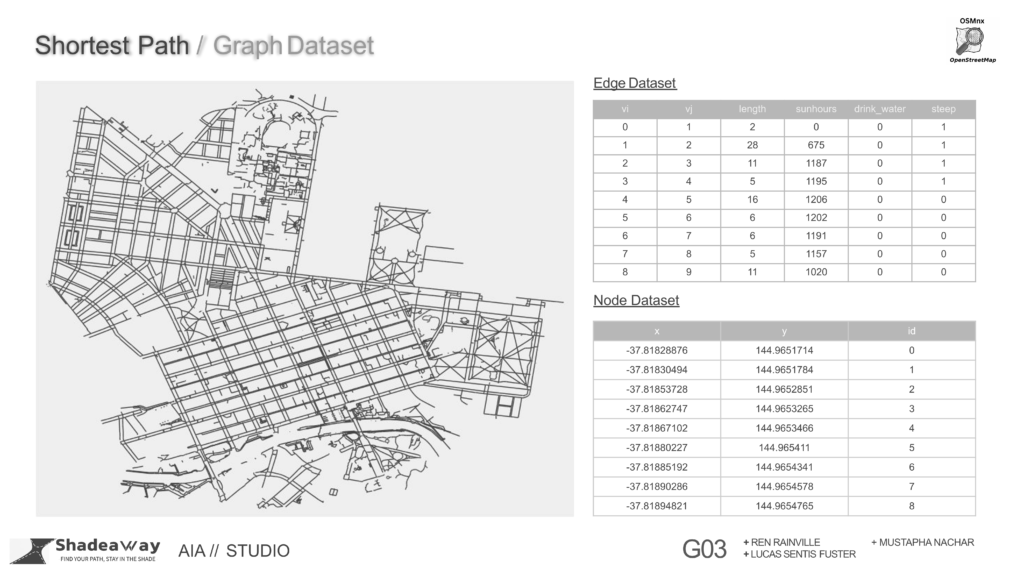
Shown below is the graph dataset obtained from Open Street Map and regenerated in python with the help of the OSMnx (OSM version of NetworkX) library.
Our proposed app would have sliders for the user to set their desired level of each parameter, the graph would then calculate the combined score weight for each edge and run the shortest path across the graph from the source node to the target node.
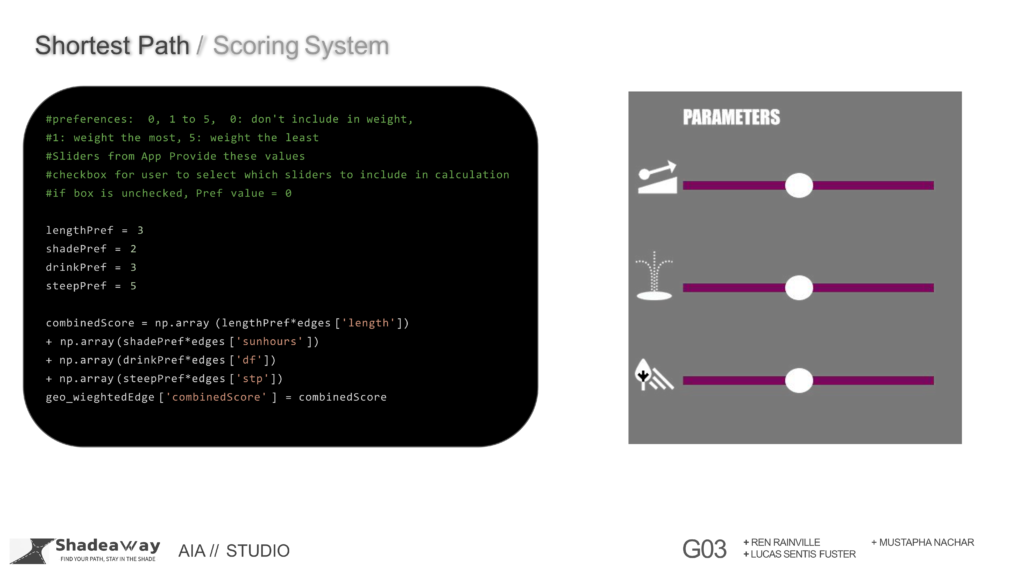
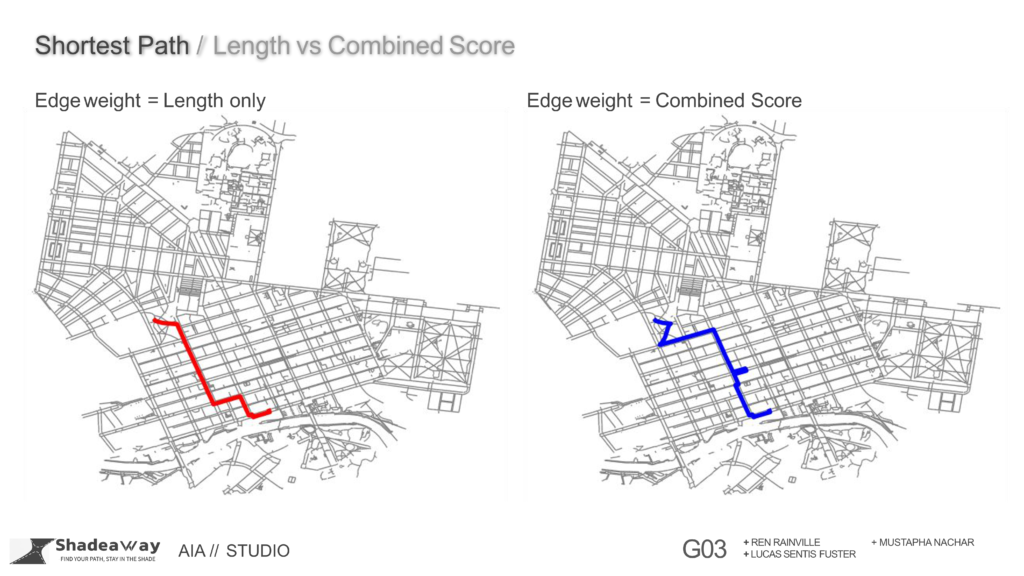
With a trial setup for the preferences we ran the shortest path taking only length into consideration and then with the preferences and combined score weights on the graph edges, the output can be seen below. In relation to a comment we had in the final pinup in future iterations it would be beneficial to note the distance based on length alone and the distance with the combined score weights to help the user know how much more or how similar in length would be the preferred path.
The proposed application would keep it simple allowing the user to input a start and end location along with the three input sliders for setting how much each would be used in the combined score calculation and applied to the shortest path.
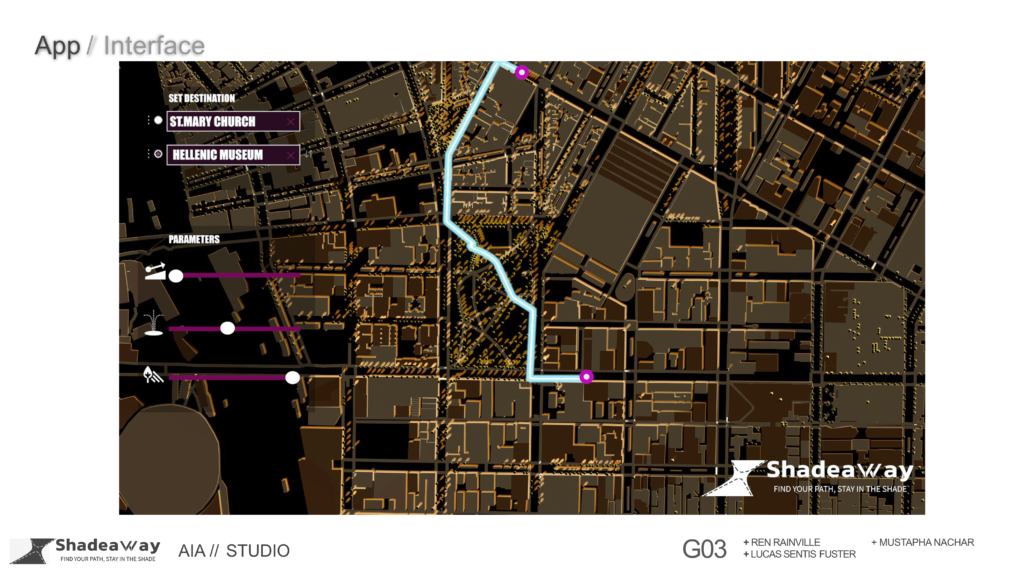
Please enjoy a demo reel for the proposed app.
