
Introduction
As I stepped into the world of urban technology at IAAC, I was introduced to the new language of Python. Coming from a background with no prior experience in programming, this journey was not just about learning a new skill but also about a mindset shift. Python is a gateway into the complex world of data and technology driving modern cities. My goal was to bridge my understanding of urban dynamics with the power of data analysis and visualization, making Python an essential tool.
Key Takeaways from each class
- Programming Logics: My first introduction to programming began with the fundamental logic behind coding. This stage was crucial since it was the basis for understanding how programs are structured and executed.
- Variables: Grasping the concept of variables was like learning the alphabet of Python. Variables are the basic units for storing and manipulating data, a concept that is foundational in any programming language.
- Conditionals: The use of conditional statements like
if,else, andelifintroduced me to the decision-making aspect of programming. This knowledge is vital for executing code under specific conditions. - Functions: Functions allowed me to understand how to compartmentalize code into reusable blocks. This practice not only makes coding more efficient but also easier to manage and debug.
- Introduction to GIS: The integration of Python with Geographic Information Systems (GIS) opened up many different possibilities for spatial analysis and mapping, crucial for urban planning and environmental studies.
- GeoPandas: Exploring GeoPandas was an extension of my GIS learning, focusing specifically on the analysis and visualization of geospatial data.
- Pandas: The Pandas library was key for my data analysis projects. Its powerful data structures and functions for data manipulation are indispensable for any data scientist.
- Data Visualization Modules: Learning about data visualization modules, particularly Plotly, taught me the art of transforming raw data into engaging, insightful visual infographics and visualizations.
- Working with Multiple Files: Handling and analyzing data from multiple sources honed my skills in managing complex, real-world datasets, an essential capability in urban technology.
Code Snippets and Outputs
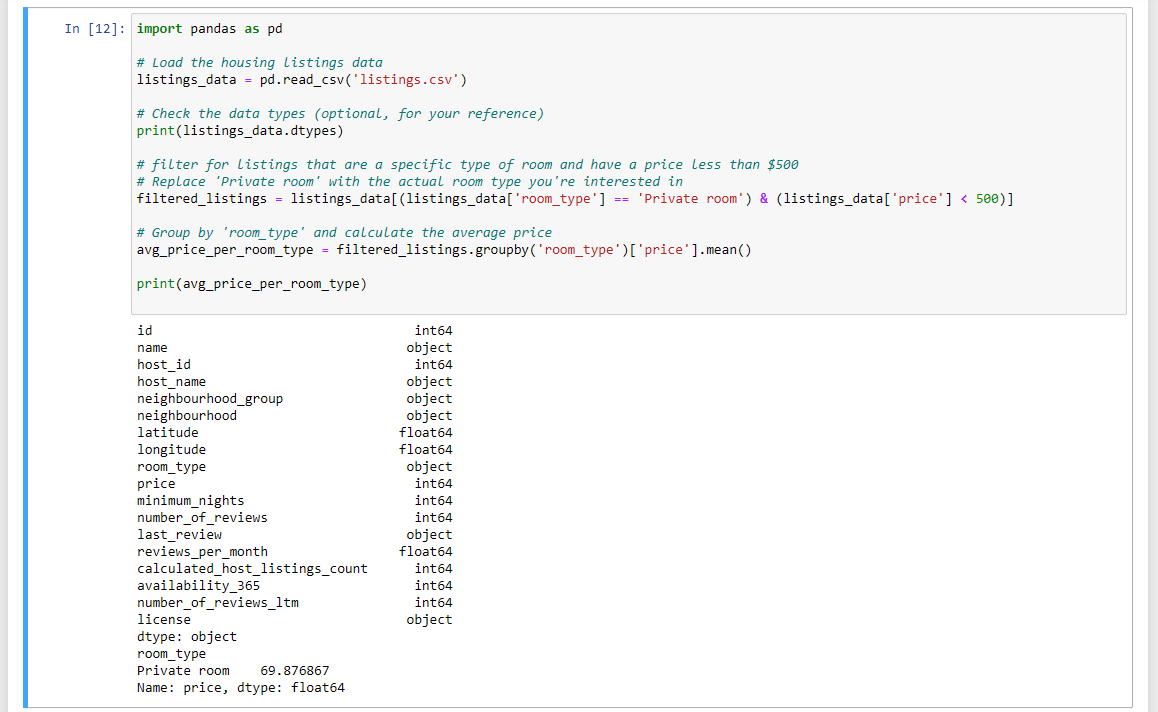
1. Data Manipulation with Pandas
This snippet demonstrates advanced data manipulation techniques, including filtering and aggregating data.
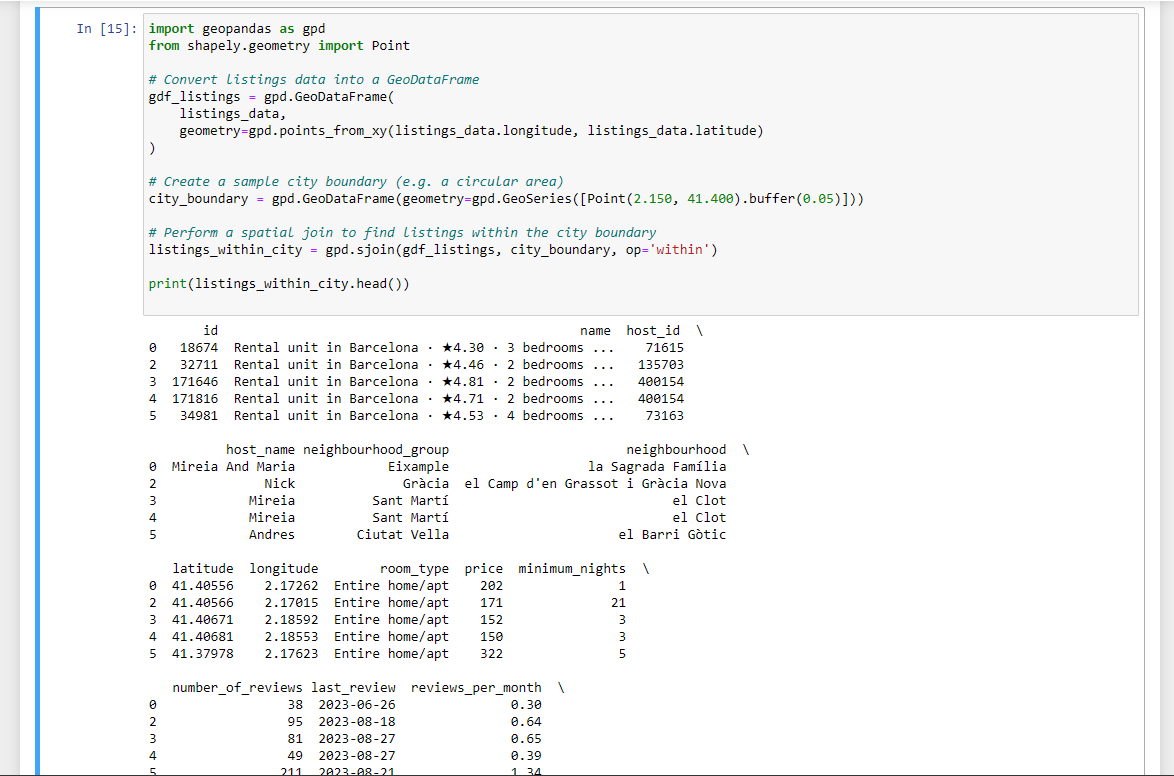
2. Geospatial Data Analysis with GeoPandas
Here, we perform a spatial analysis using GeoPandas, including spatial joins and geometry manipulations.
3. Data Visualization with Plotly
Creating an interactive map using Plotly for dynamic data visualization.
A Second exercise with a new CSV file
1. Advanced Data Manipulation with Pandas
This step involves loading the taxi trip data and performing complex data manipulations, such as filtering and aggregating data.
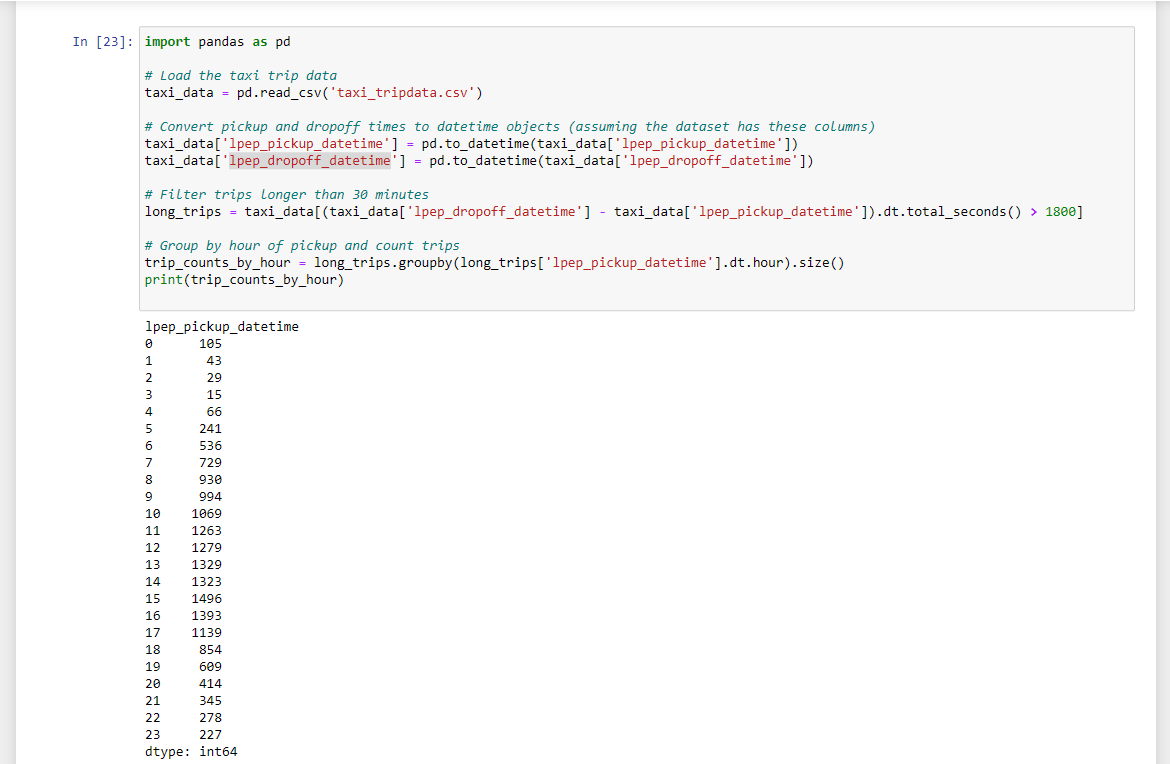
2. Time Series Analysis
In this step, we’ll conduct a time series analysis, such as examining trip durations or frequencies over different times.
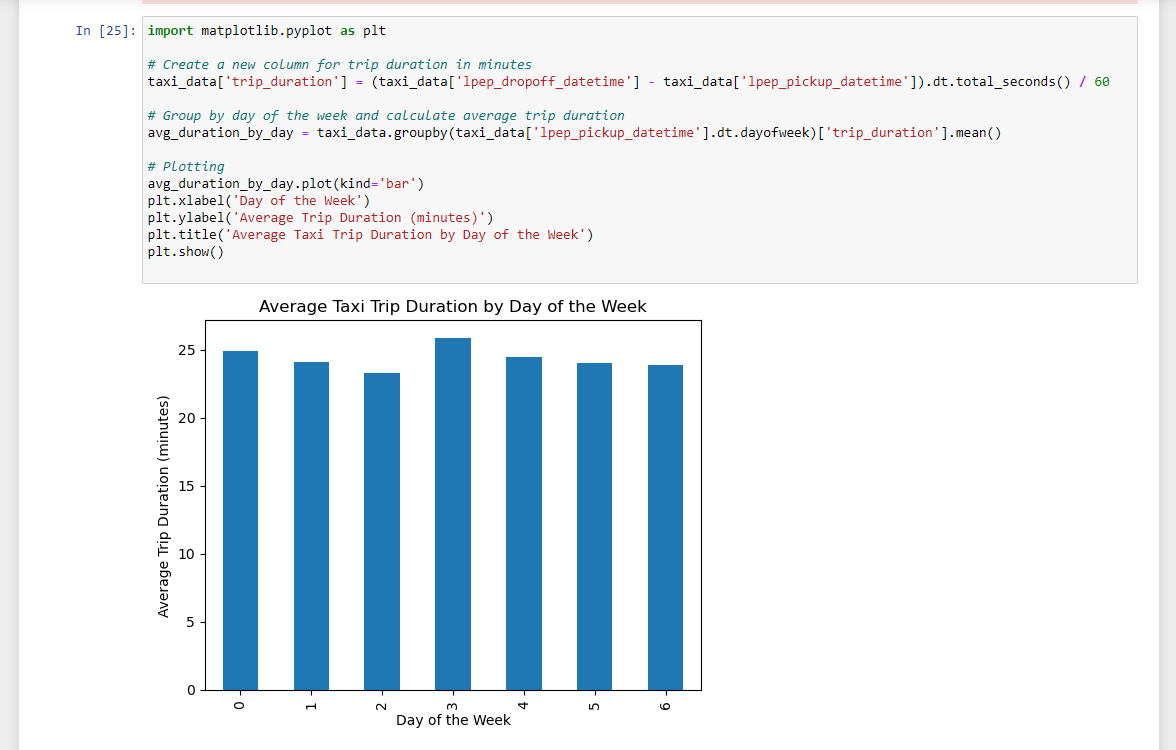
3. Interactive Data Visualization with Plotly
The final step involves creating an interactive visualization using Plotly to dynamically showcase data trends.
Conclusion
Python has proven to be an invaluable tool in deciphering the complexities of urban environments. Through analyzing diverse datasets, from housing market dynamics to rhythms of taxi trips, I am able to analyze and visualize urban life. These exercises highlighted how strategic data utilization can illuminate patterns and drive informed decision-making in urban planning and transportation. This class deepened my understanding of how data shapes the essence of urban living. As I advance, these skills and insights will be instrumental in my contributions to creating smarter outputs.
