
Abstract
In the Anthropocene, the construction industry generates vast quantities of Construction and Demolition Waste (CDW), positioning cities as latent material reservoirs rather than endpoints of consumption. This research investigates CDW not as waste, but as a designed material system. Initial experiments explored rammed CDW composites, revealing strong compressive behavior but critical limitations under lateral forces and impact, leading to brittle failure. While compression performance showed promise, it remained insufficient for structural application.
Subsequent material studies introduced binders, demonstrating that controlled grading and minimal cement stabilization significantly improve cohesion and strength, though material alone could not resolve tensile weakness. This shifted the research toward spanning systems, integrating tensile members to compensate for material limitations. Experiments with natural fibers and reclaimed steel informed the transition to hybrid systems, ultimately incorporating salvaged rebars from construction sites.
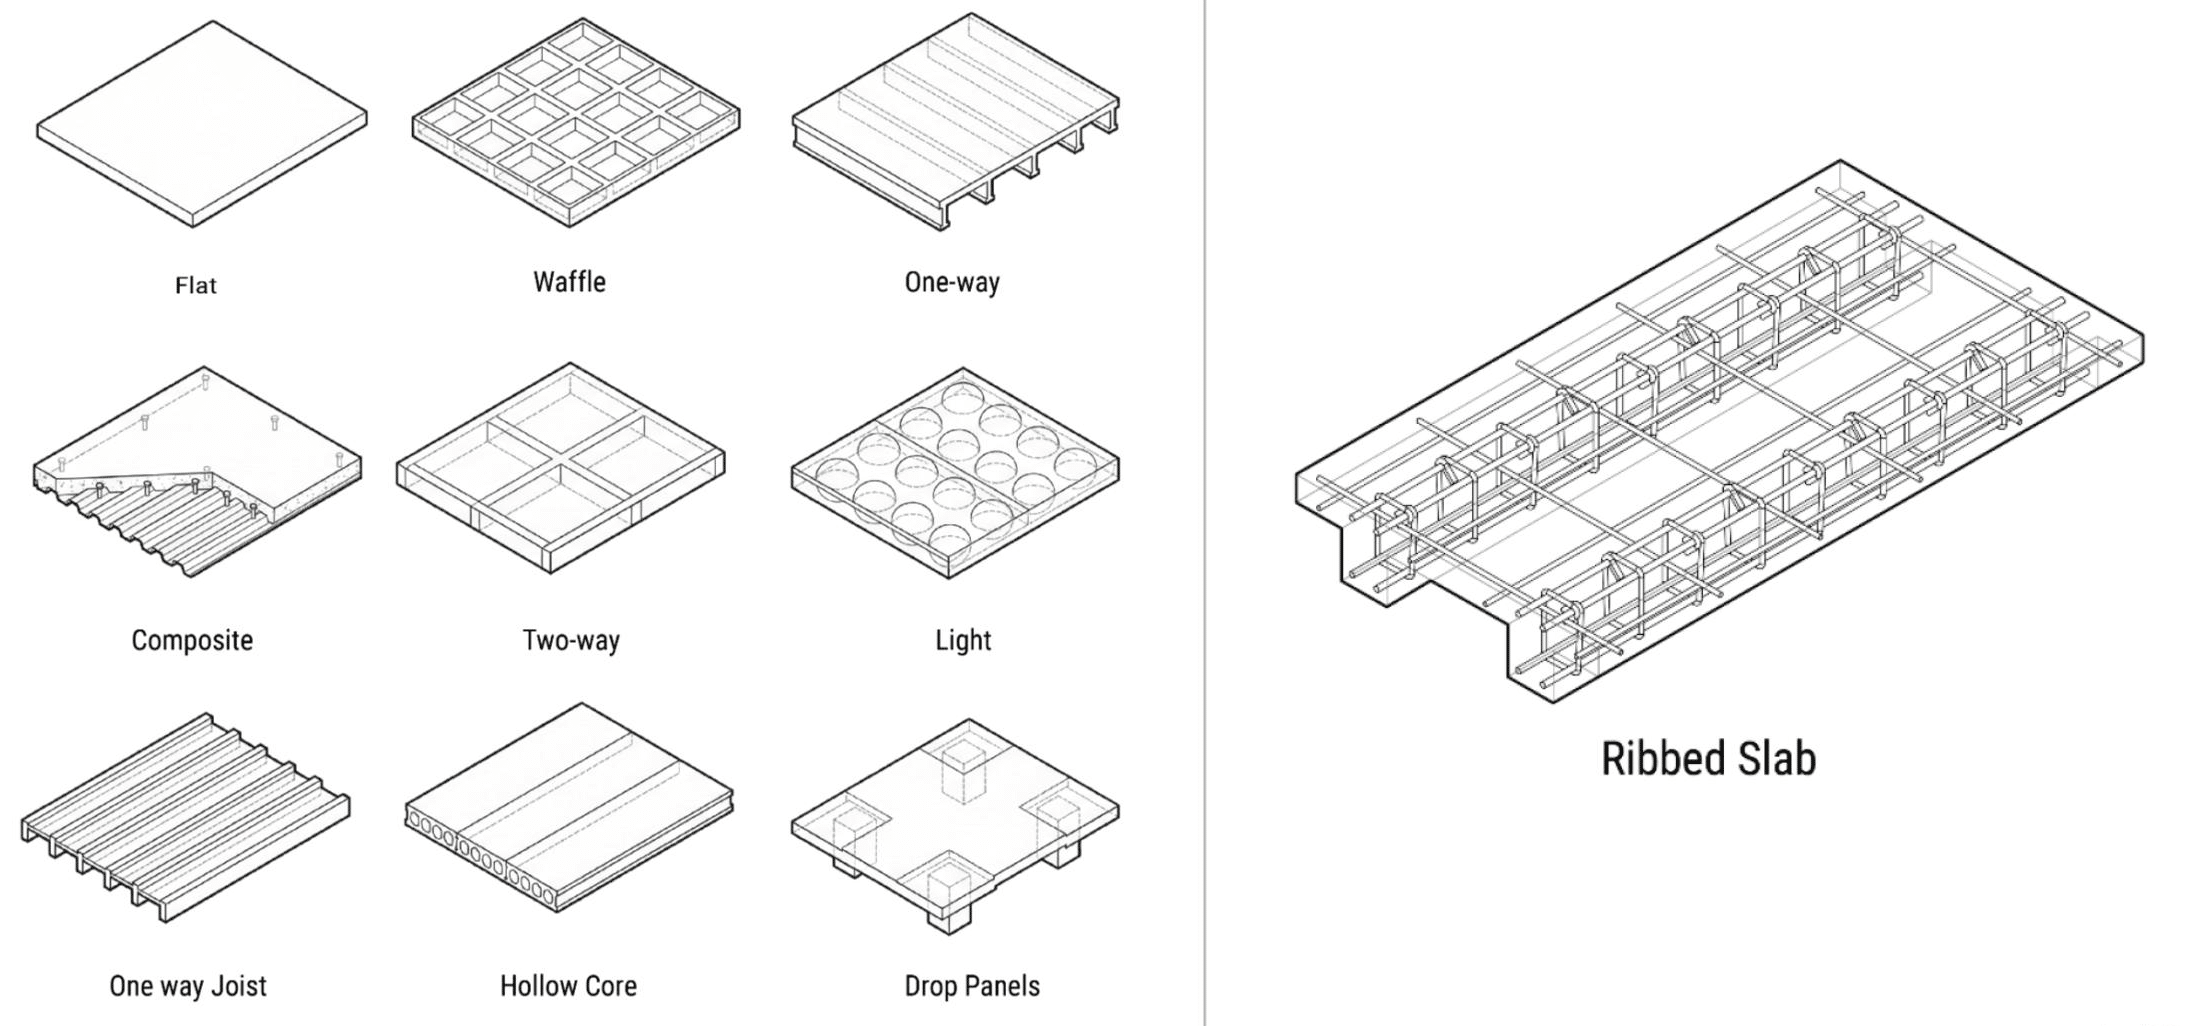
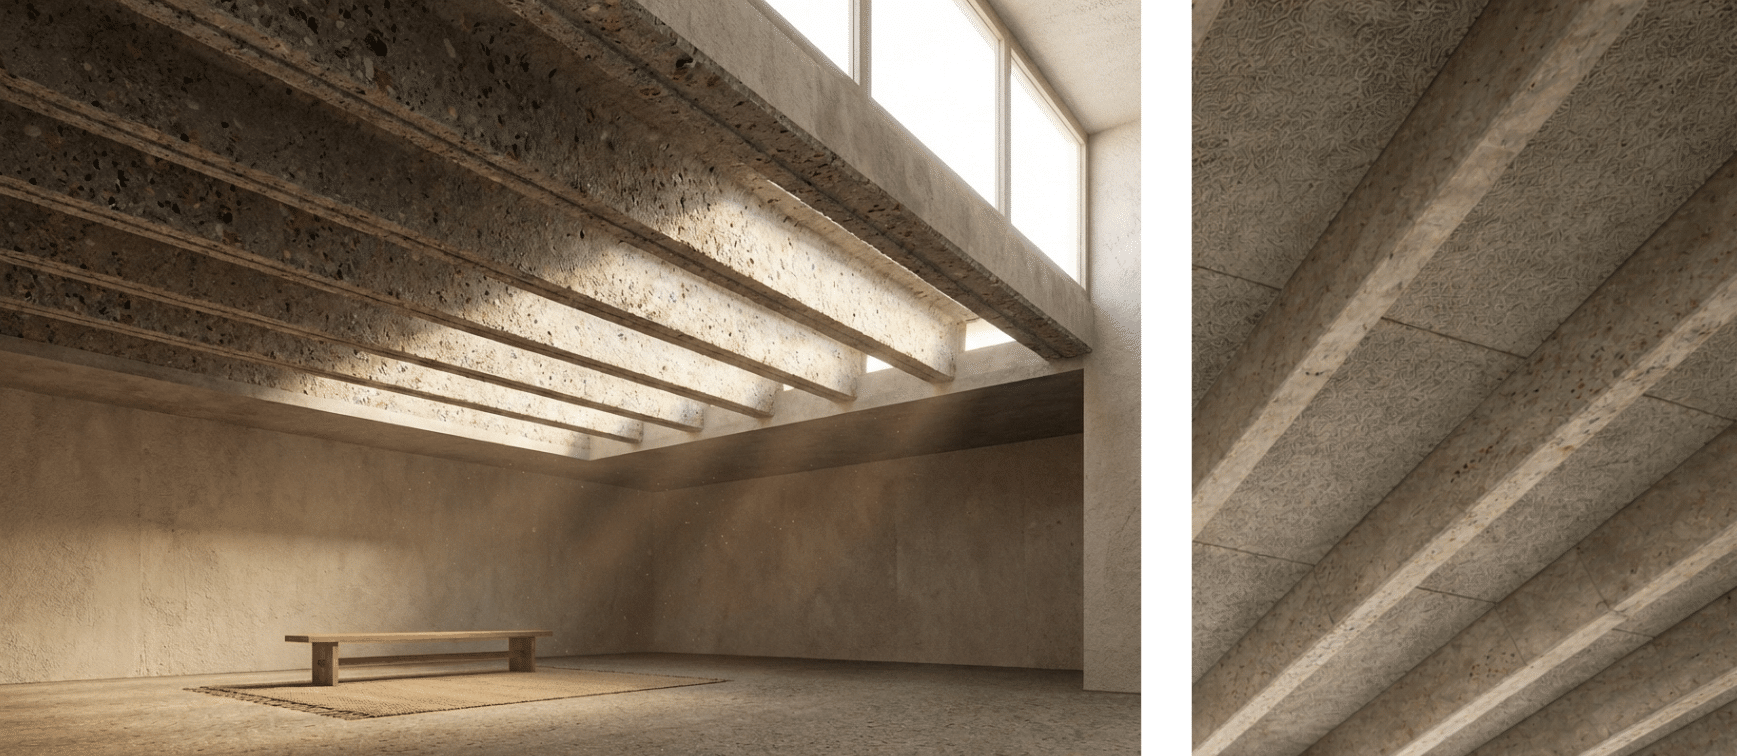
The project proposes a precast ribbed slab system, where geometry, reinforcement, and material grading work together to achieve structural performance. Only cement is introduced as a virgin material, while aggregates and steel are reclaimed, forming a predominantly upcycled system. Prototyping focuses on flexural behavior and assembly logic.
At an urban scale, a digital interface enables the identification, evaluation, and controlled extraction of CDW, structuring a pipeline from demolition to fabrication. The work hypothesizes a scalable system where buildings become material sources, processed, assembled, and reconstituted into new architectural elements.
The CDW Paradox
Problem Framing: Environmental and Technical Gap
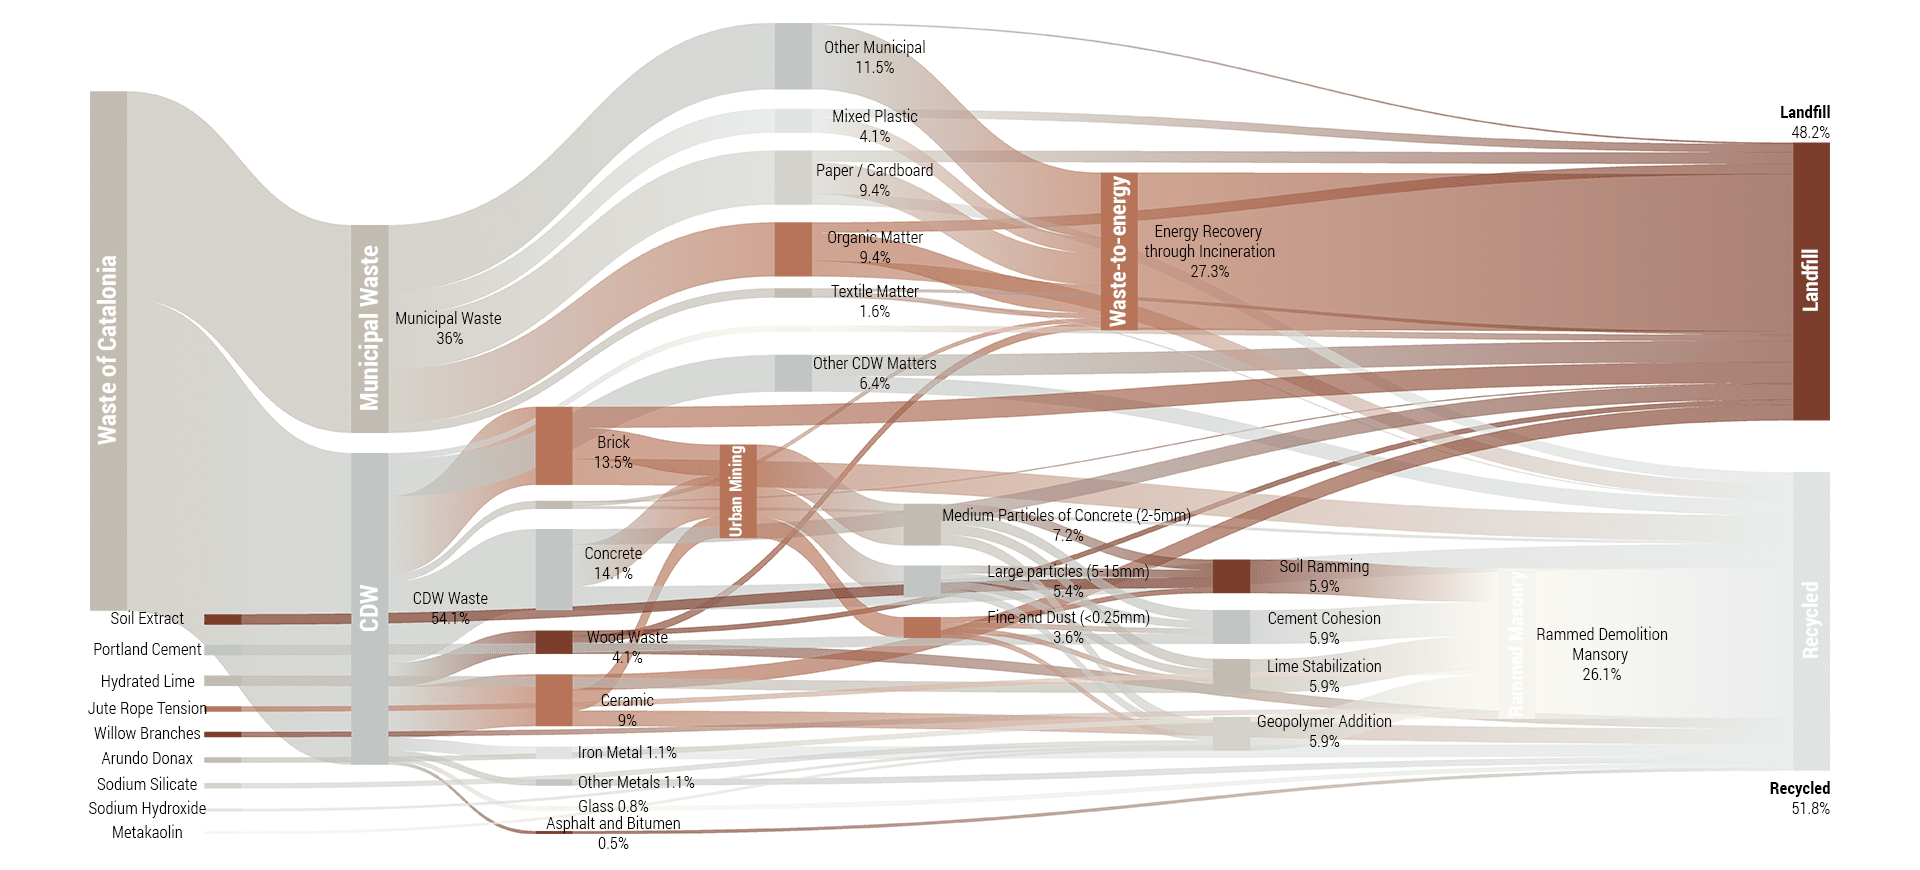
Material Flow: Sankey Diagram
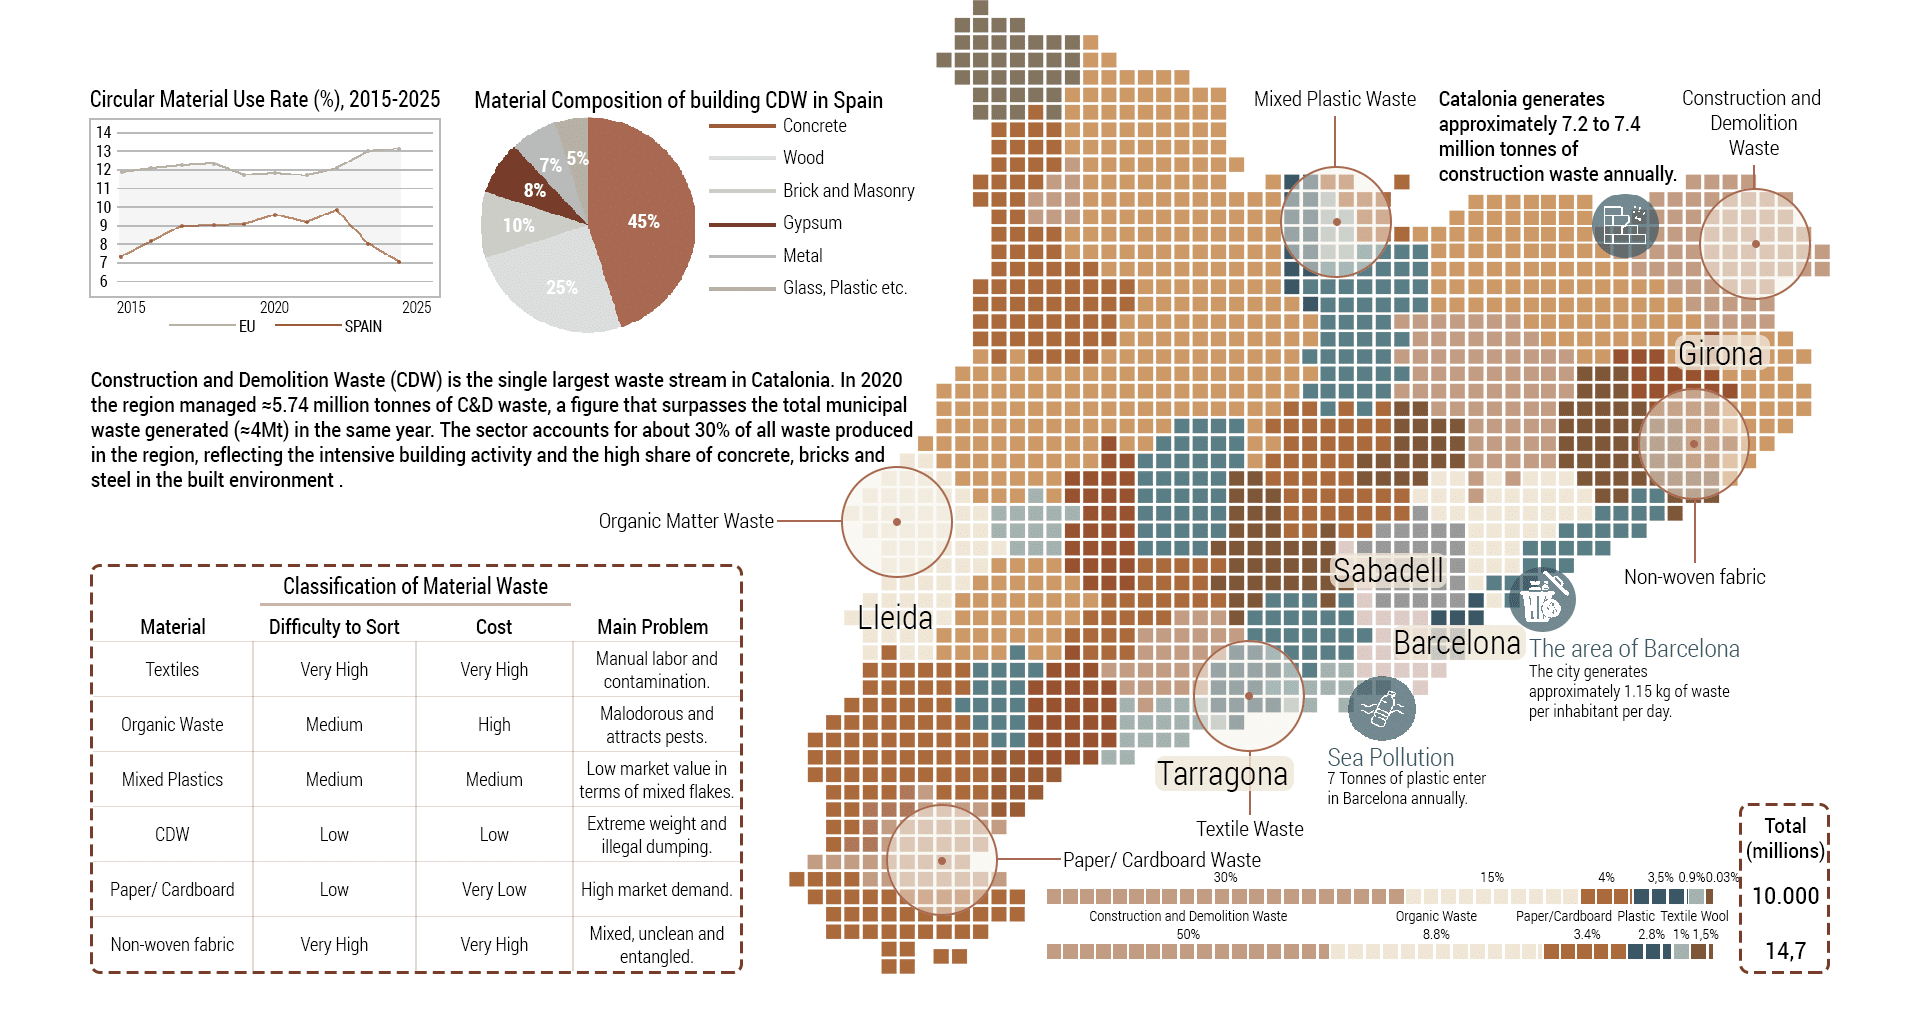
Typical CDW composition in Catalonia mirrors the European pattern: concrete ≈ 40 %, brick waste 20‑25 %, steel‑metal ≈ 10 %, glass ≈ 10 %, with additional fractions of asphalt/bitumen, gypsum/plaster and ceramic mix 10‑25 % that together complete the material balance.
These figures illustrate that Catalonia’s construction sector generates a substantial volume of material that is only partially reintegrated into the circular economy, underscoring the urgent need for more effective waste‑reduction, material‑recovery and reuse strategies.
Material Focus
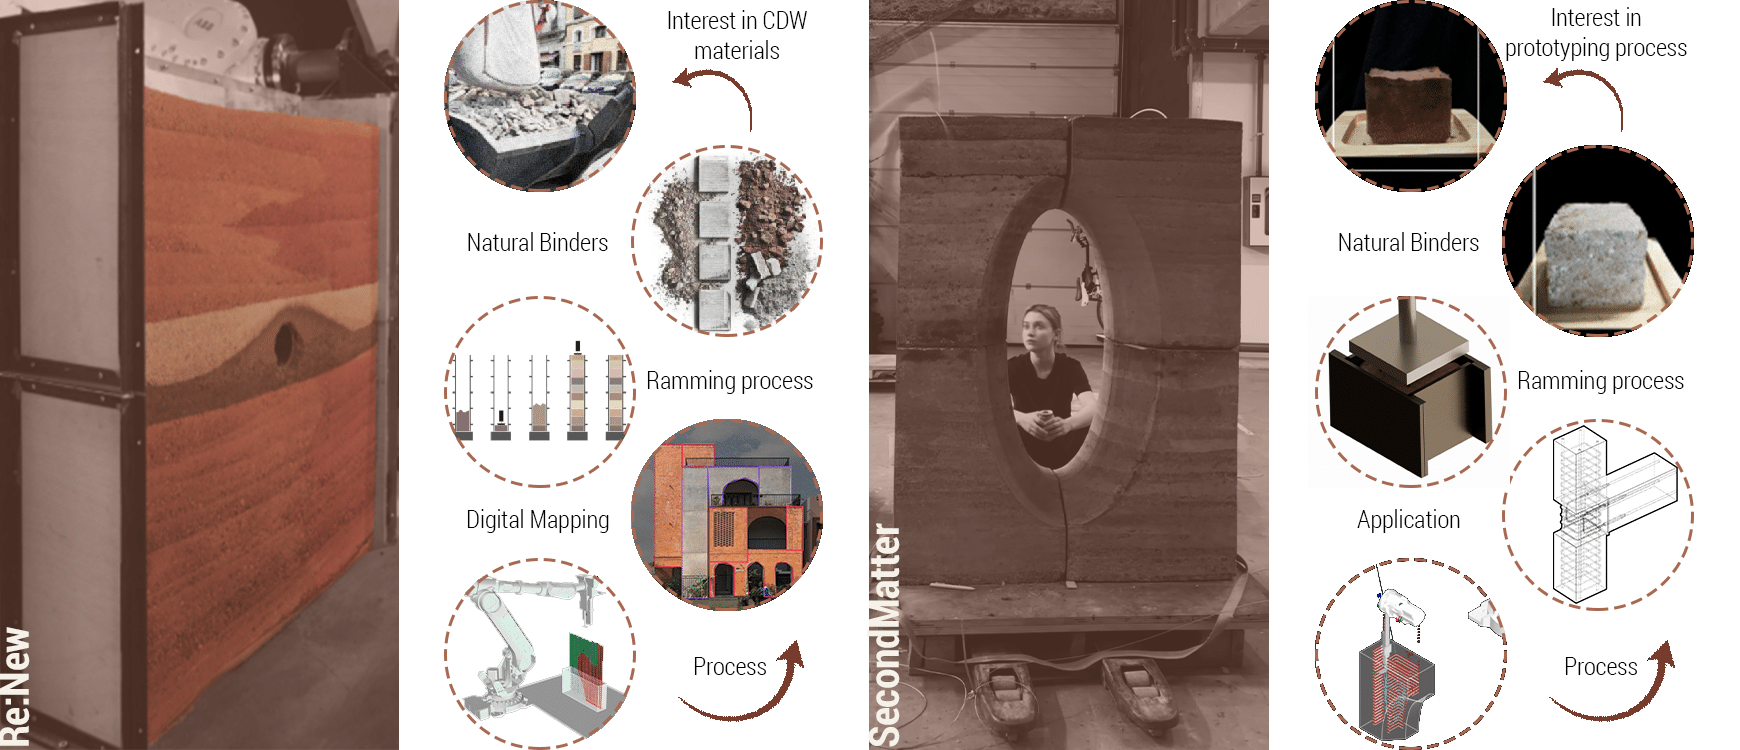
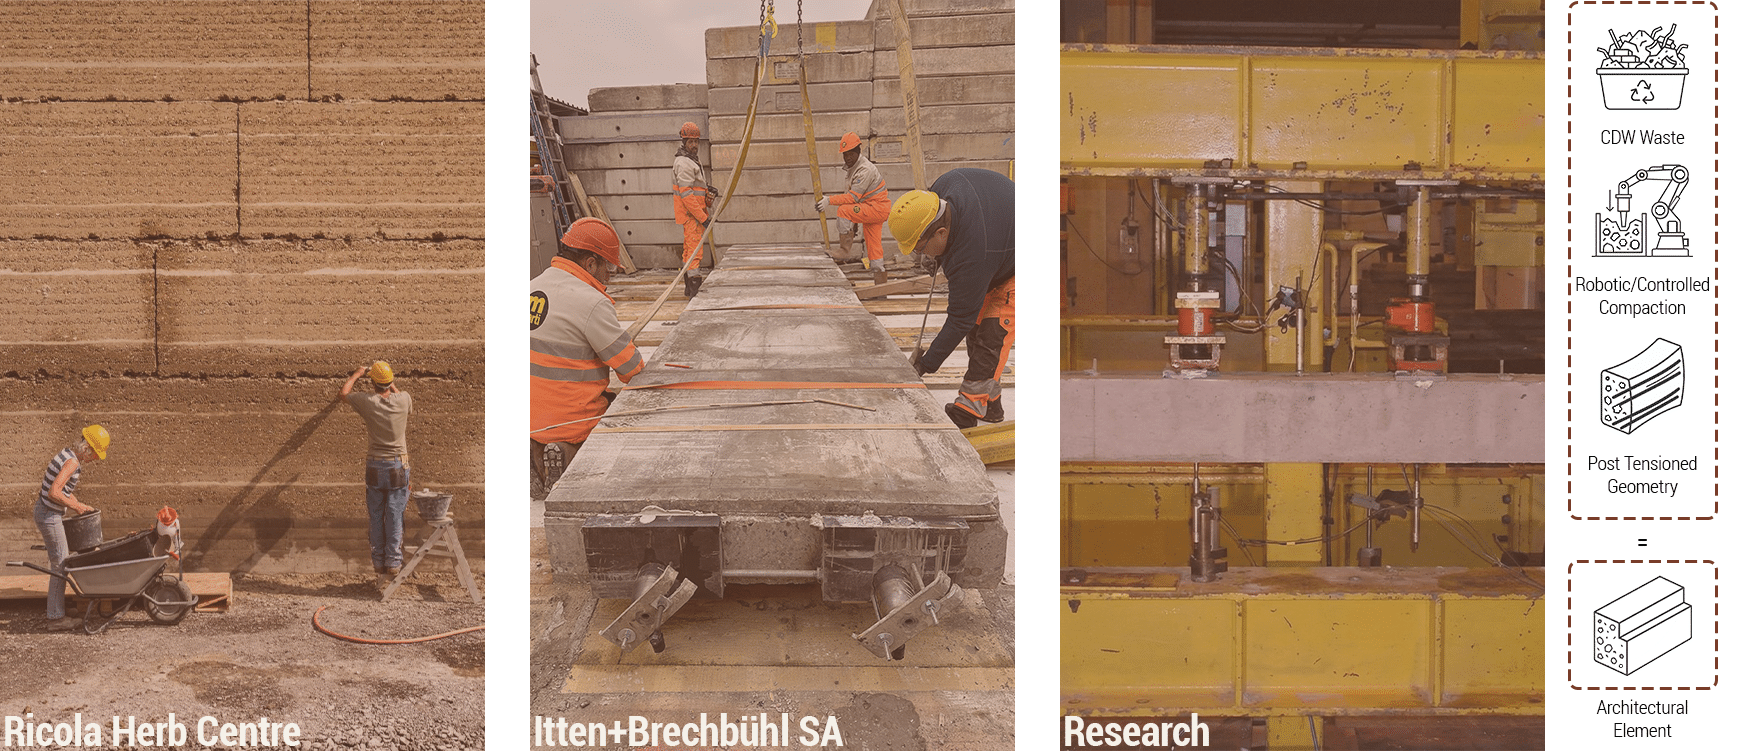
Architectural Applications
When looking at architectural applications, there is a growing interest in CDW materials and natural binders. Two projects that inspired us starting the research were Renew and SecondMatter.
CDW in Structural Research
ResearchGate, Reinforced Concrete Beams with Recycled Aggregates from Demolished Concrete of a Stadium.
Research Gap
Redesigning Matter for a Circular Future
Urban Mining and Granular Intelligence
Urban Mining Workflow
Sourcing and Collection
Material Processing
Mineral Material Classification
Mineral Breakdown
Particle Size as Design Parameter
Mineral Particle Size Catalogue

Granular Intelligence
Mohammed Al-Surf; Mosleh Al-Harthi; and Ashraf Balabel. Strength and Water Absorption of Sustainable Concrete Produced with Recycled Basaltic
Concrete Aggregates and Powder. Sustainability 13, no. 11 (2021): 6277.
Material Property Mapping
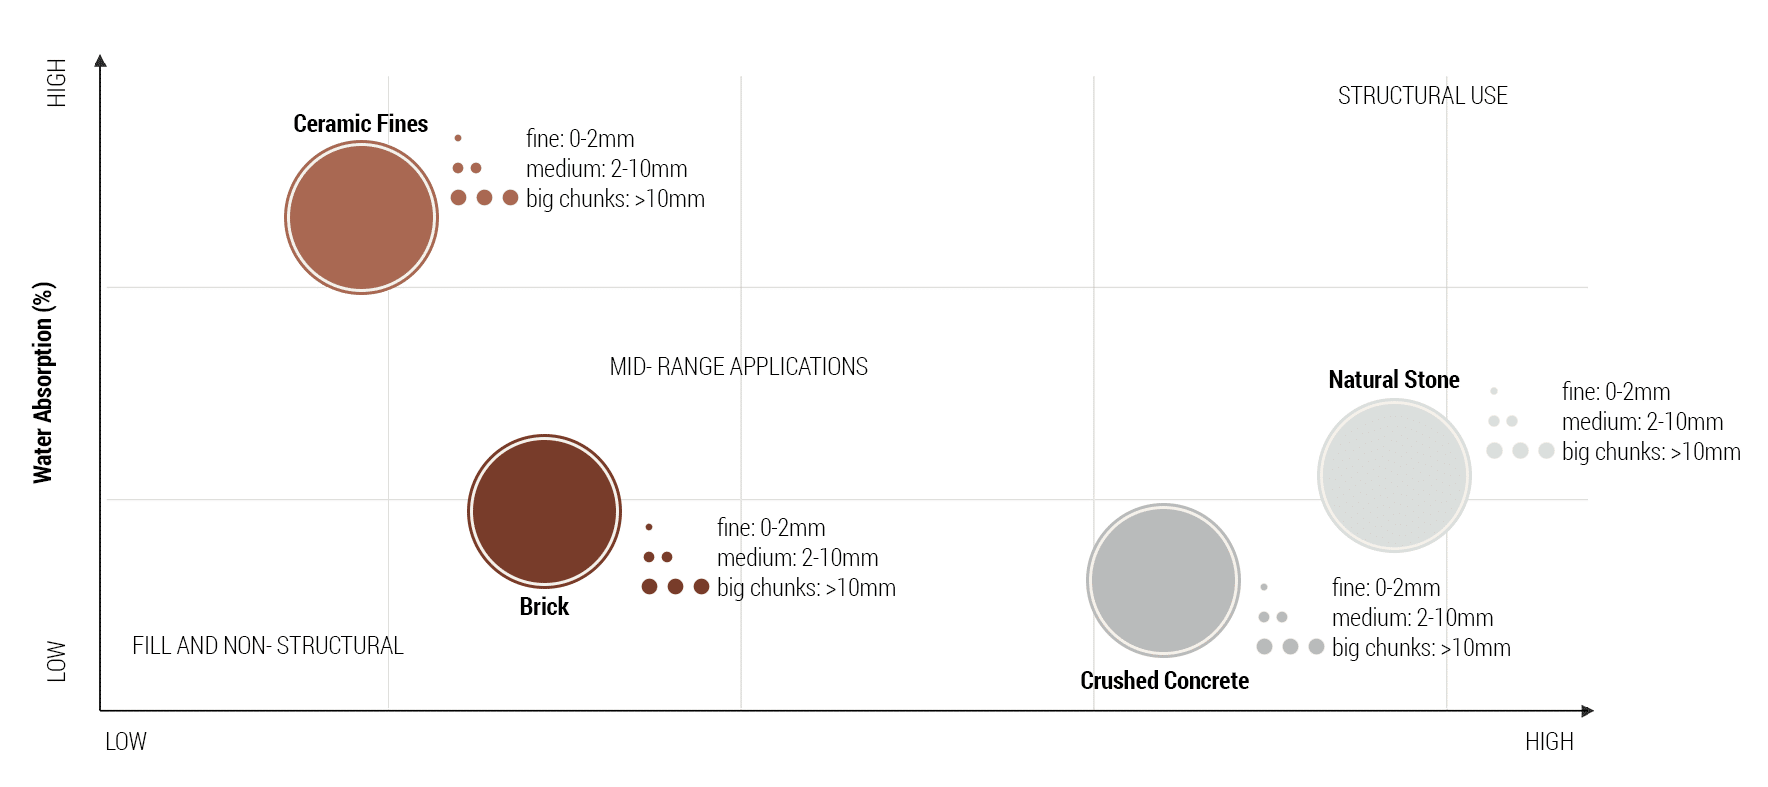
Surf; Mosleh Al-Harthi; and Ashraf Balabel. Strength and Water Absorption of Sustainable Concrete Produced with Recycled Basaltic Concrete
Aggregates and Powder. Sustainability 13, no. 11 (2021): 6277.
Material Performance and Compaction Experiments
At this stage the research transitions from the urban mining workflow to material experimentation.
Ramming as a Design Parameter
Finding Structural Integrity through Granular Density
Across these references, ranging from prefabricated blocks to in-situ manual and mechanical techniques, it is observed that variations in pressure and layering contribute to both structural integrity and architectural expression.
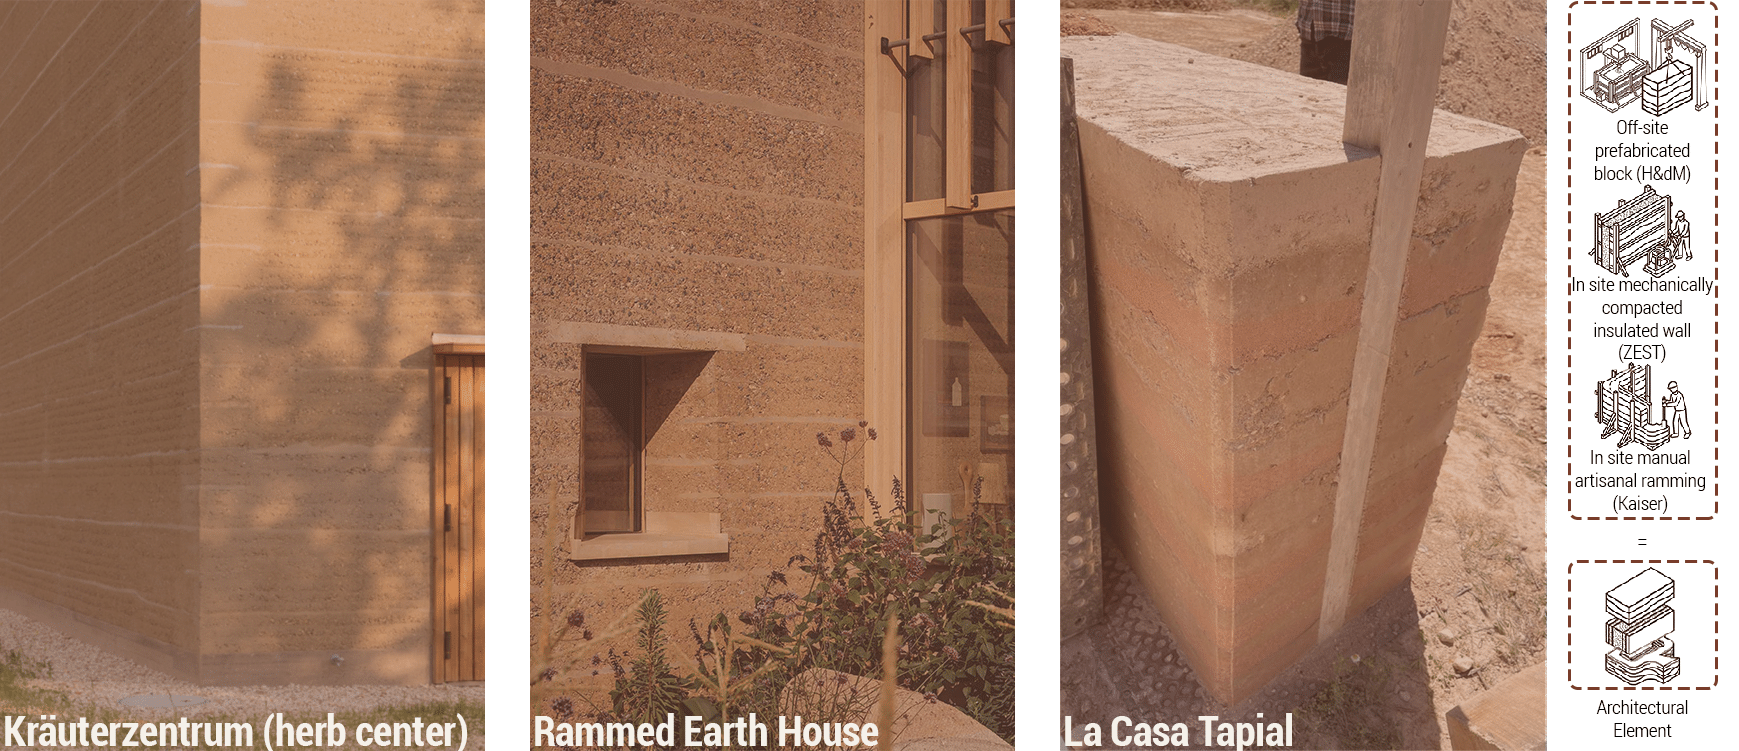
and build a rammed earth wall.
Compaction Experiments
Fabrication Parameters
A 7 cm mold was used, with ramming for compaction and sealed curing to control airflow.
Formulation and Demolding
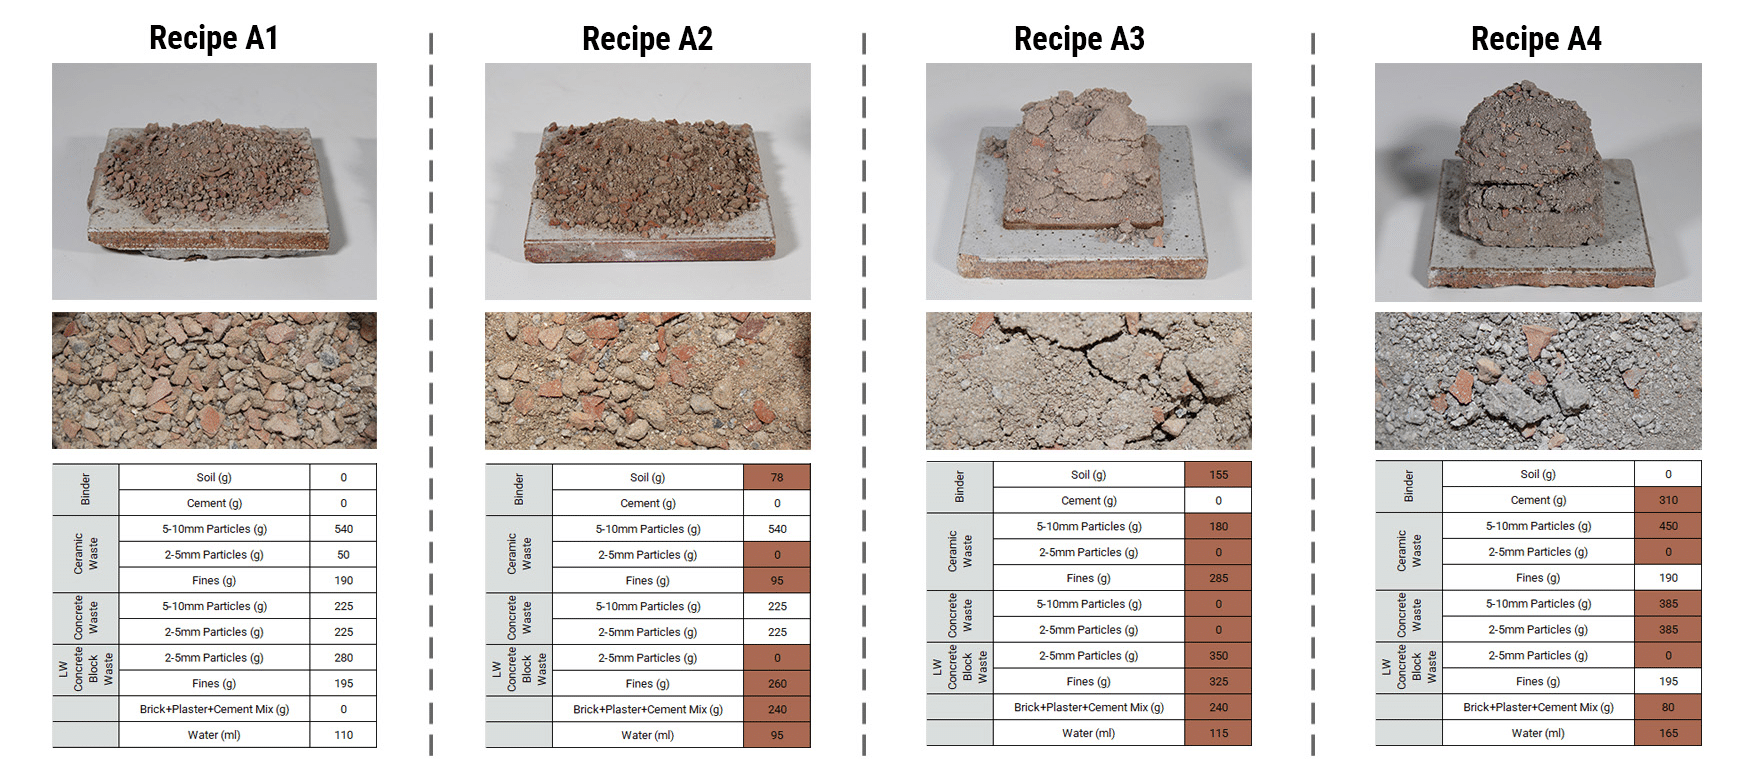
Experiment Set A Dry Ramming
The first batch of experiments consisted of 12 different recipes, exploring a range of binders, including soil, cement, lime, and geopolymers, alongside varying particle size distributions.
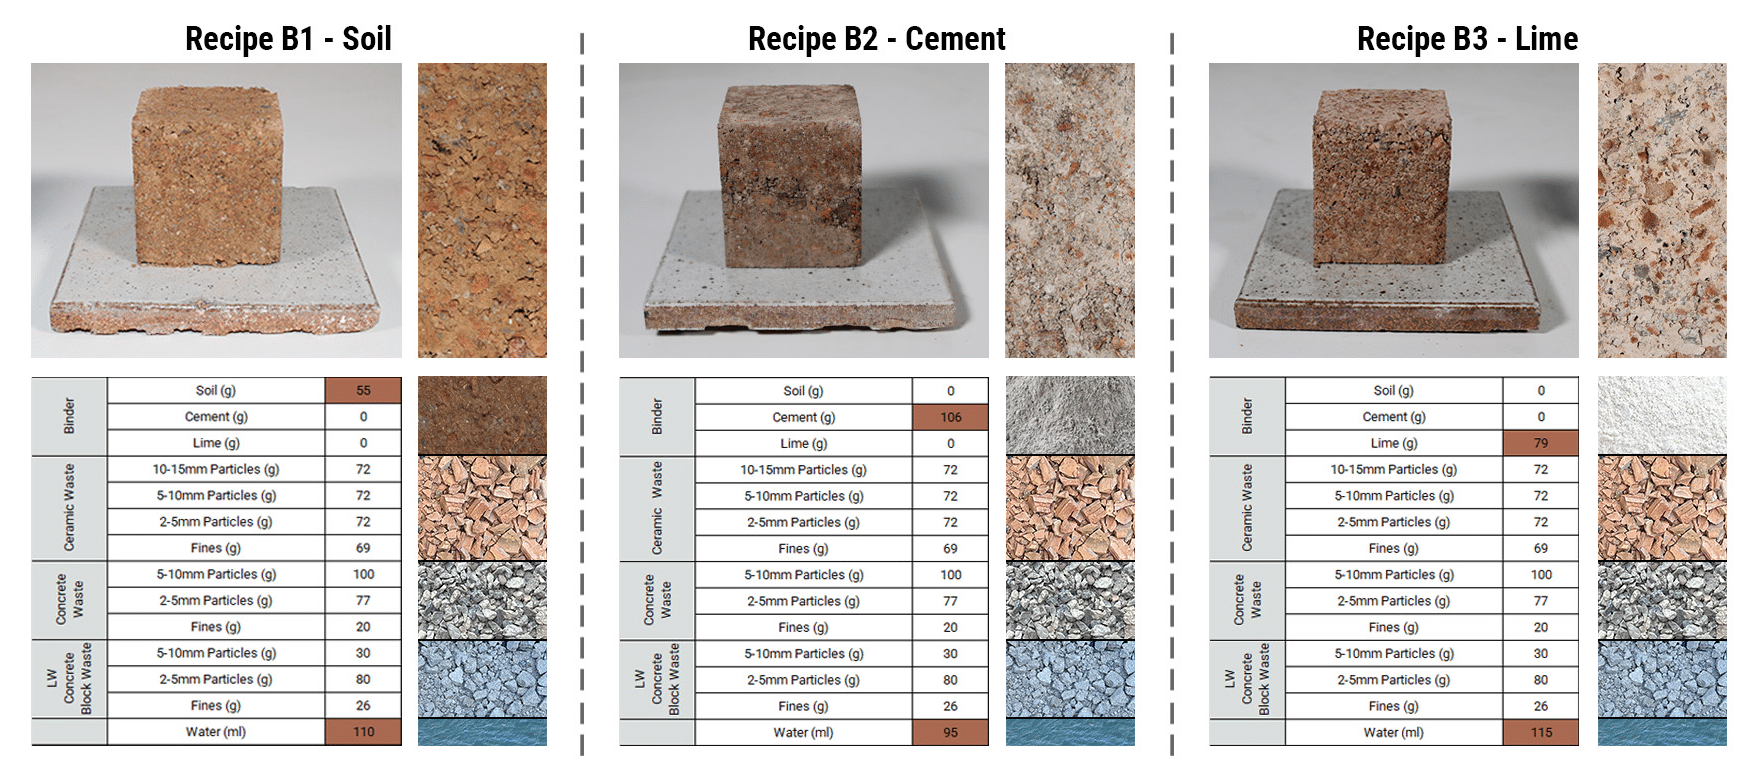
Experiment Set B Binder Controlled Cohesion
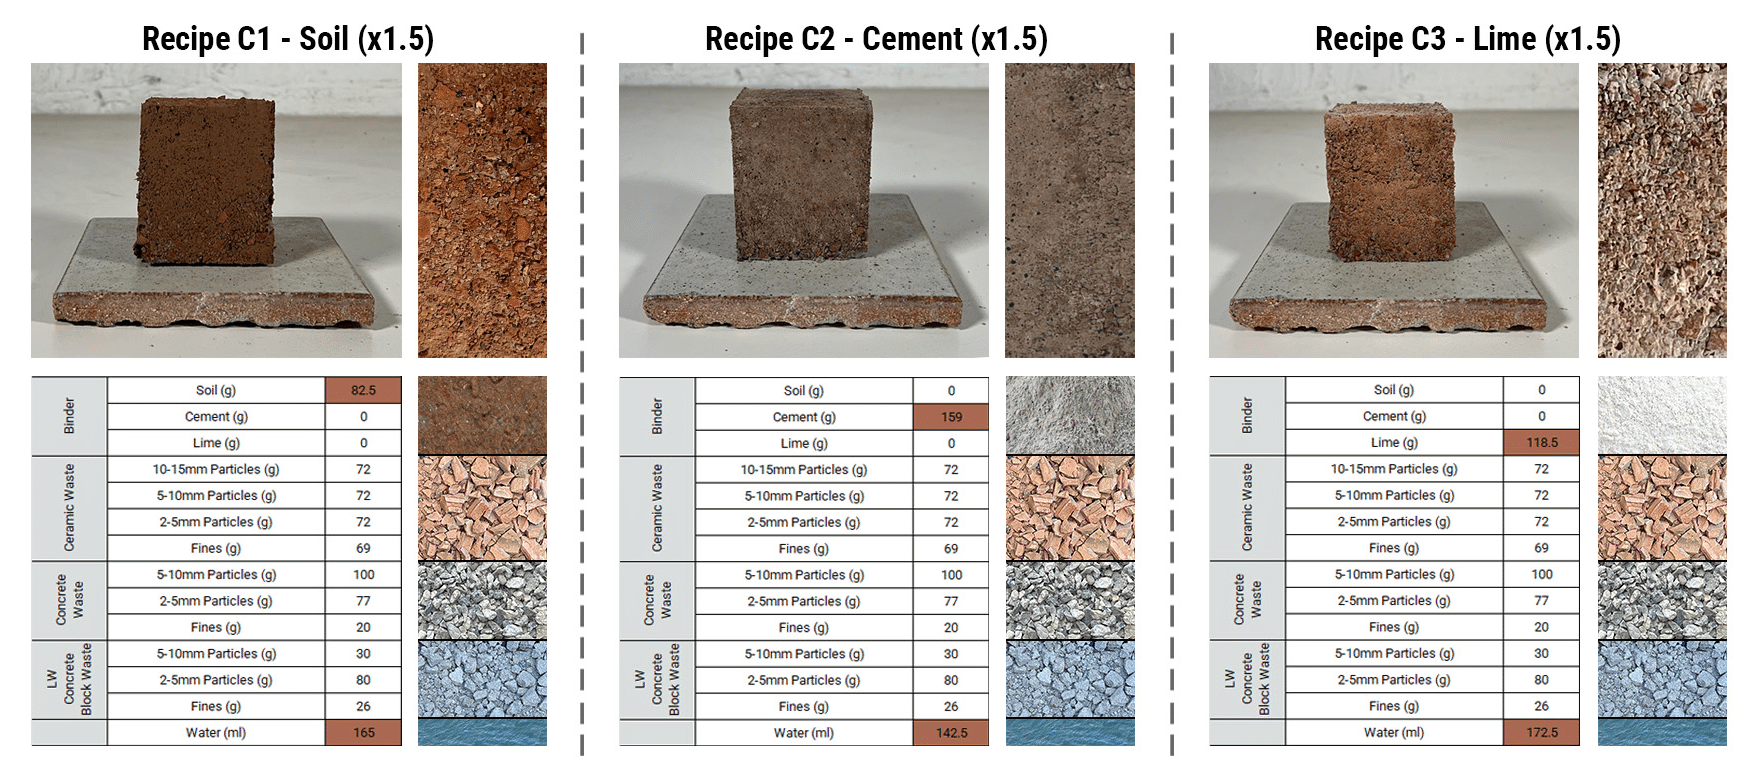
Experiment Set C Phased Binder Ratios
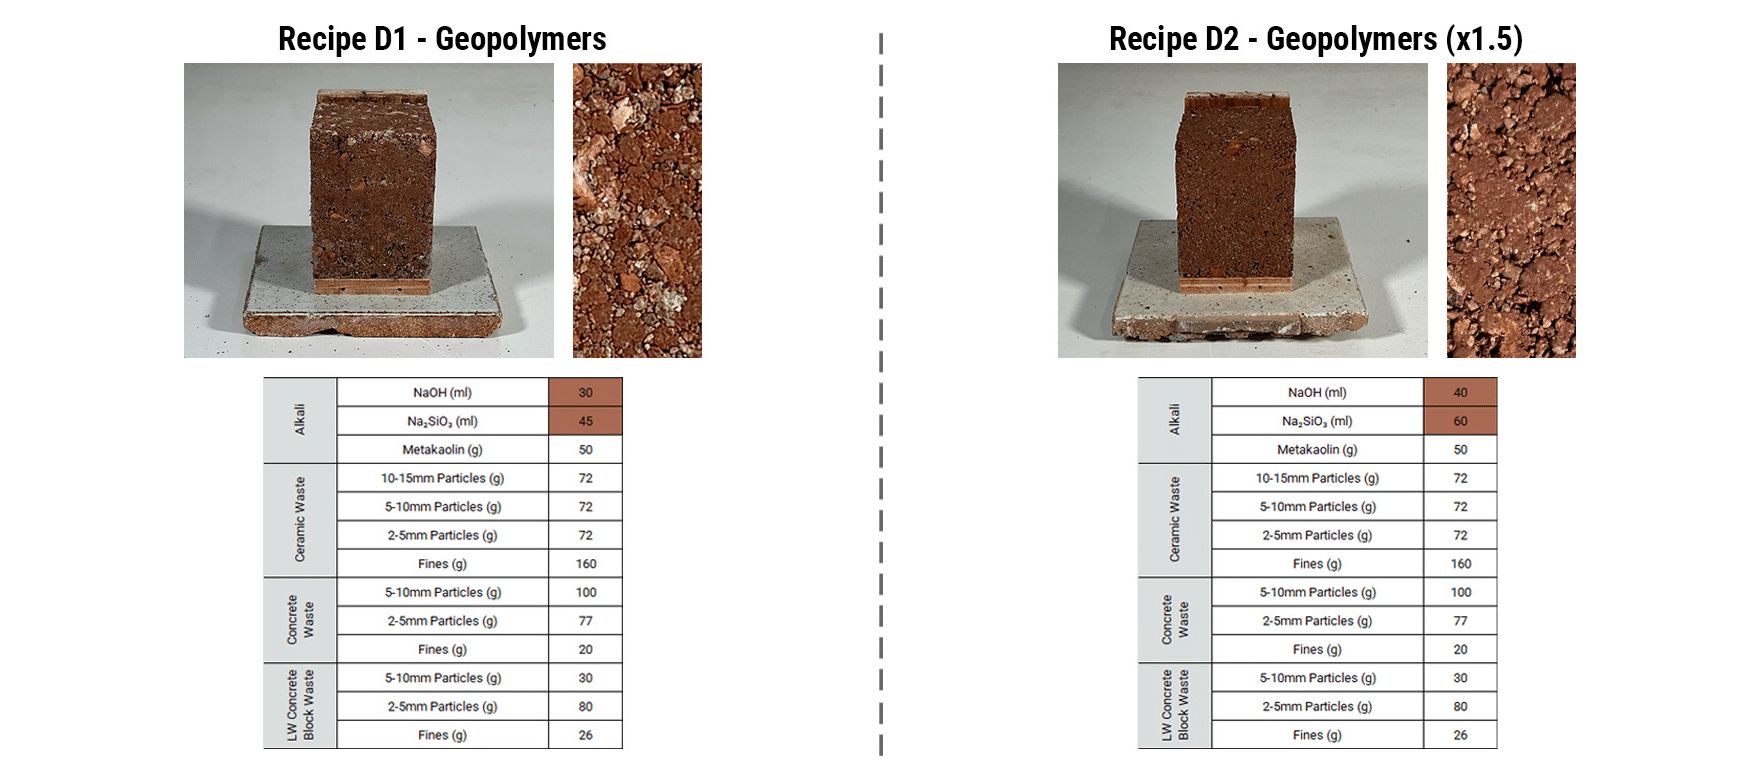
Experiment Set D Low Carbon Mineral Binders
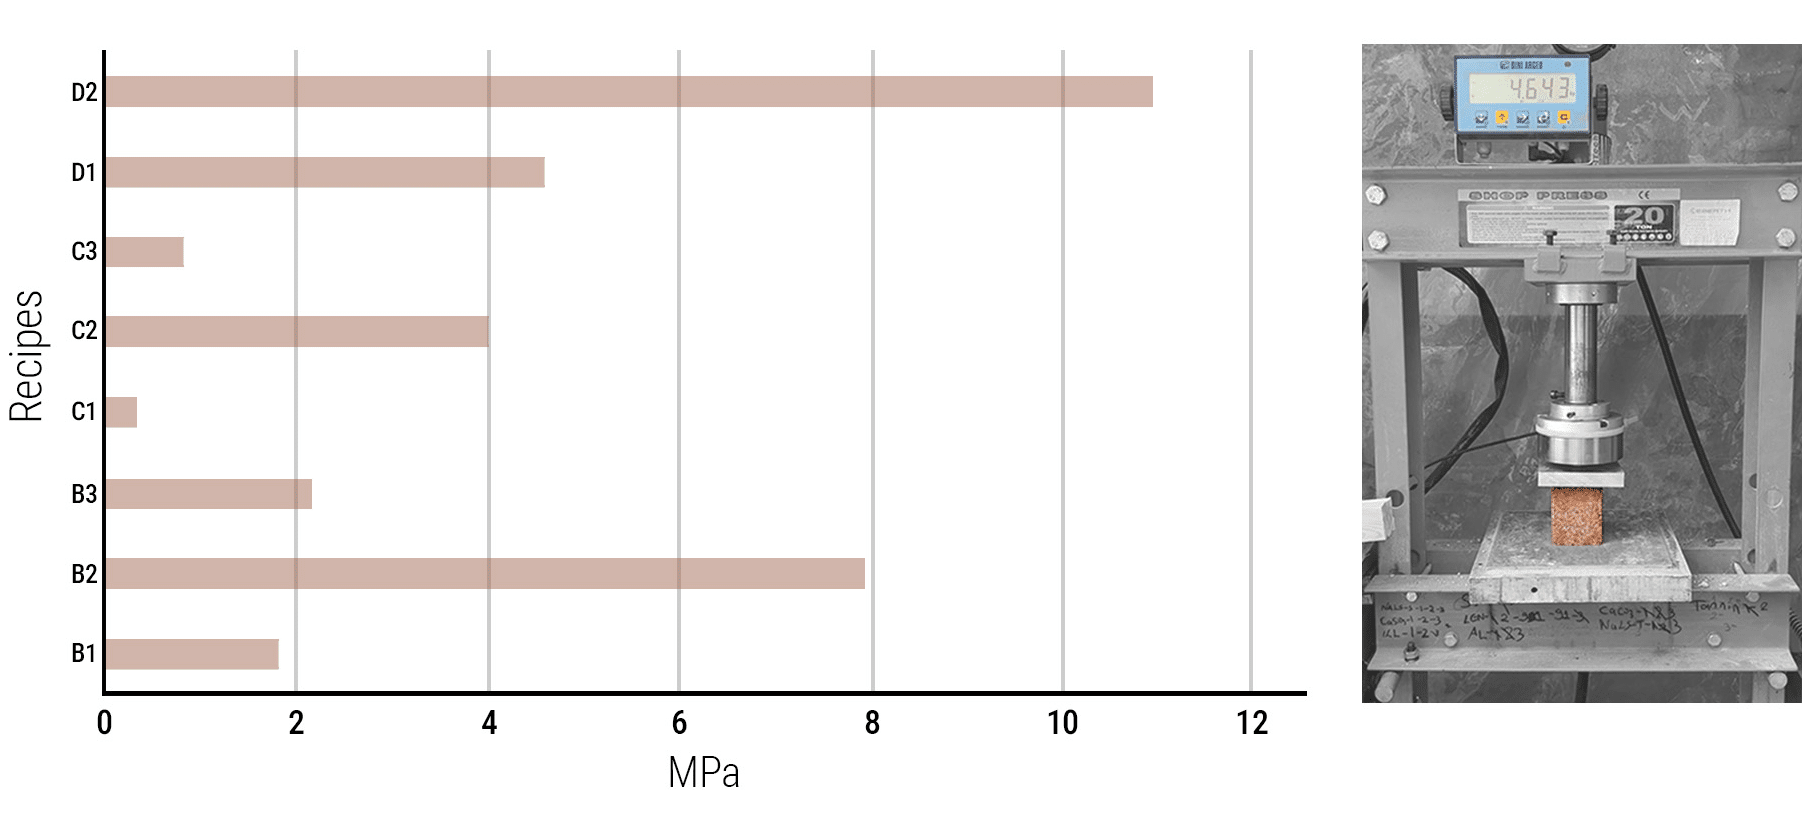
Compression Performance Tests for Experiments B, C, D
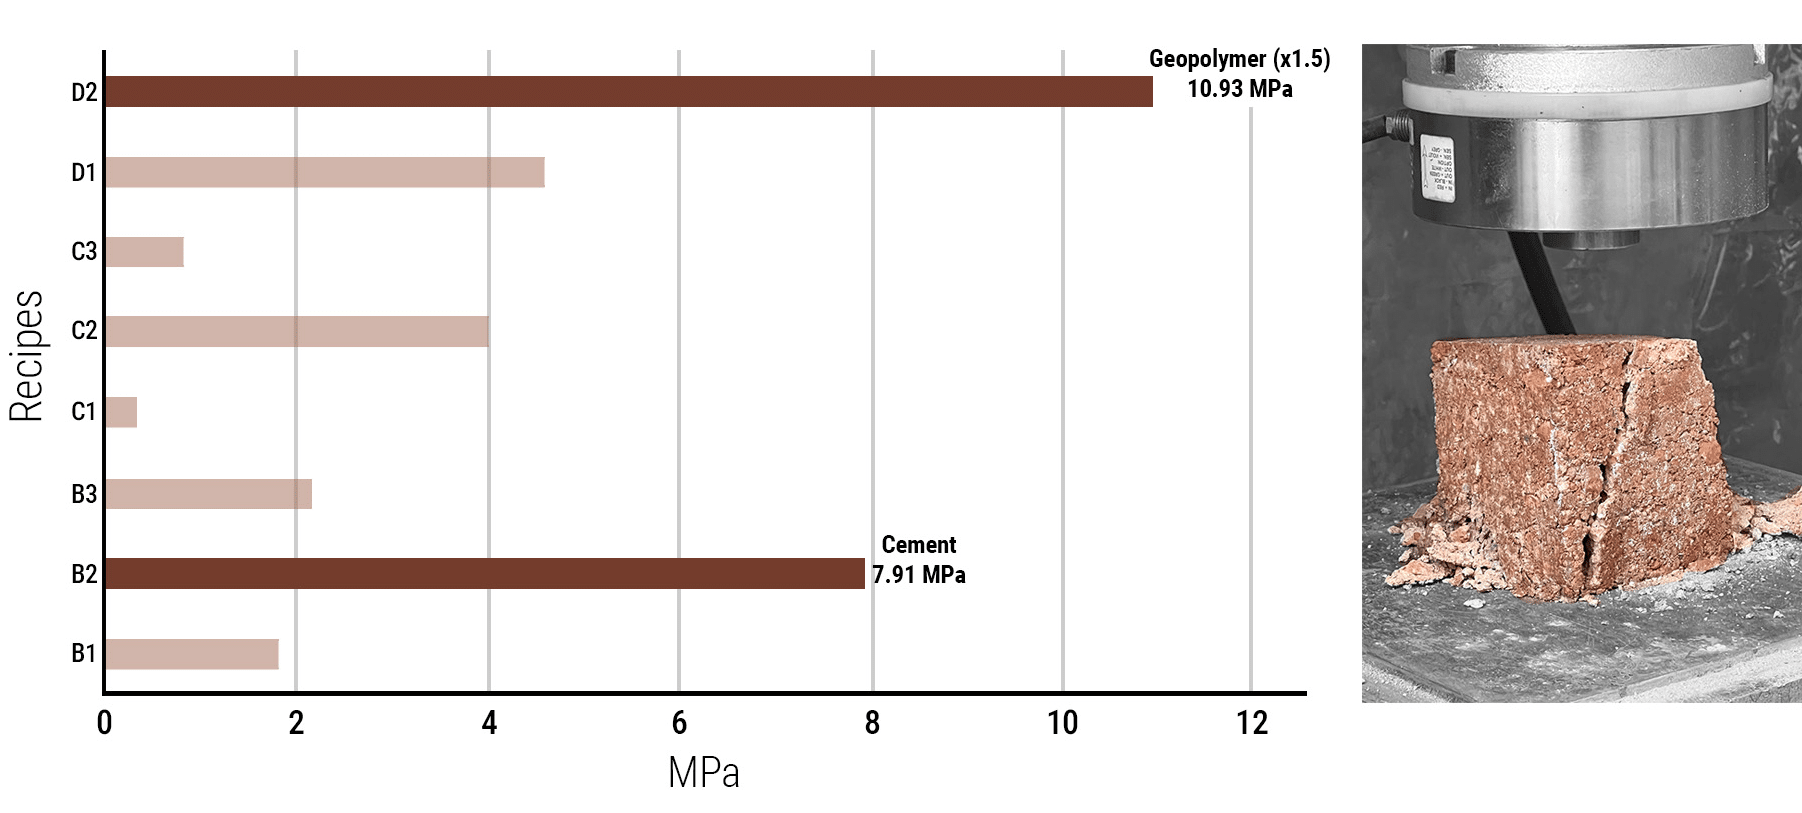
Analysis and Best Performance
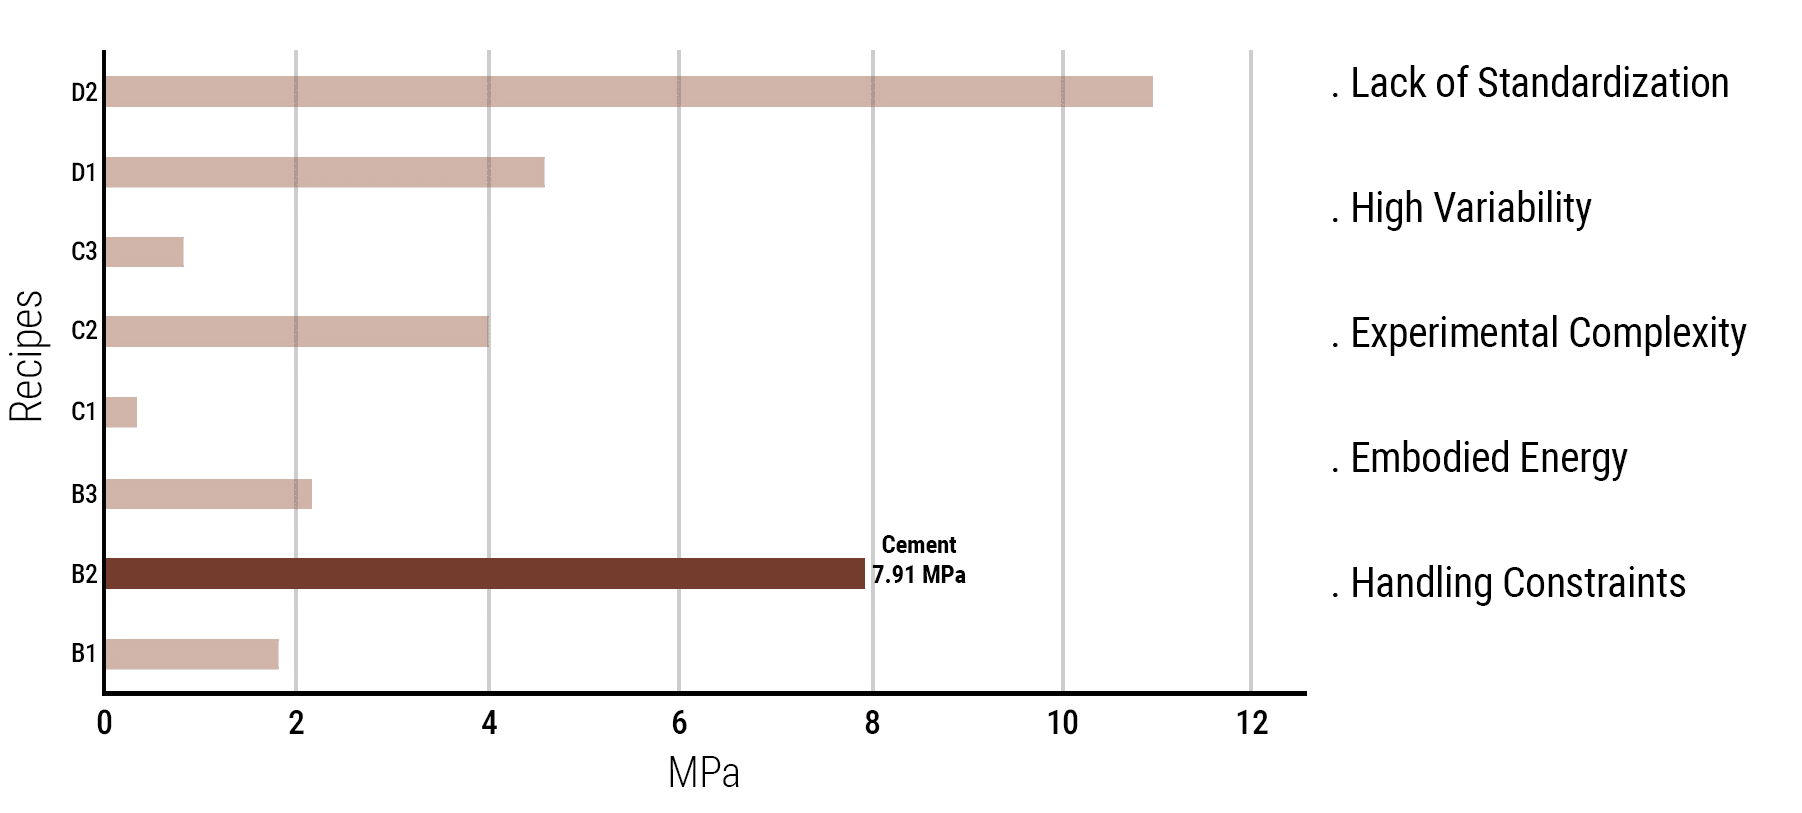
After 14 days of curing, compressive strength tests were conducted on all prototypes. The highest-performing mixes were identified as those using geopolymers and cement as binders. However, geopolymers were excluded due to their variability, lack of standardization, and complex chemistry, which made it difficult to isolate and accurately evaluate the performance of CDW materials.
Conclusion and Next Steps
Experiments A/B/C/D
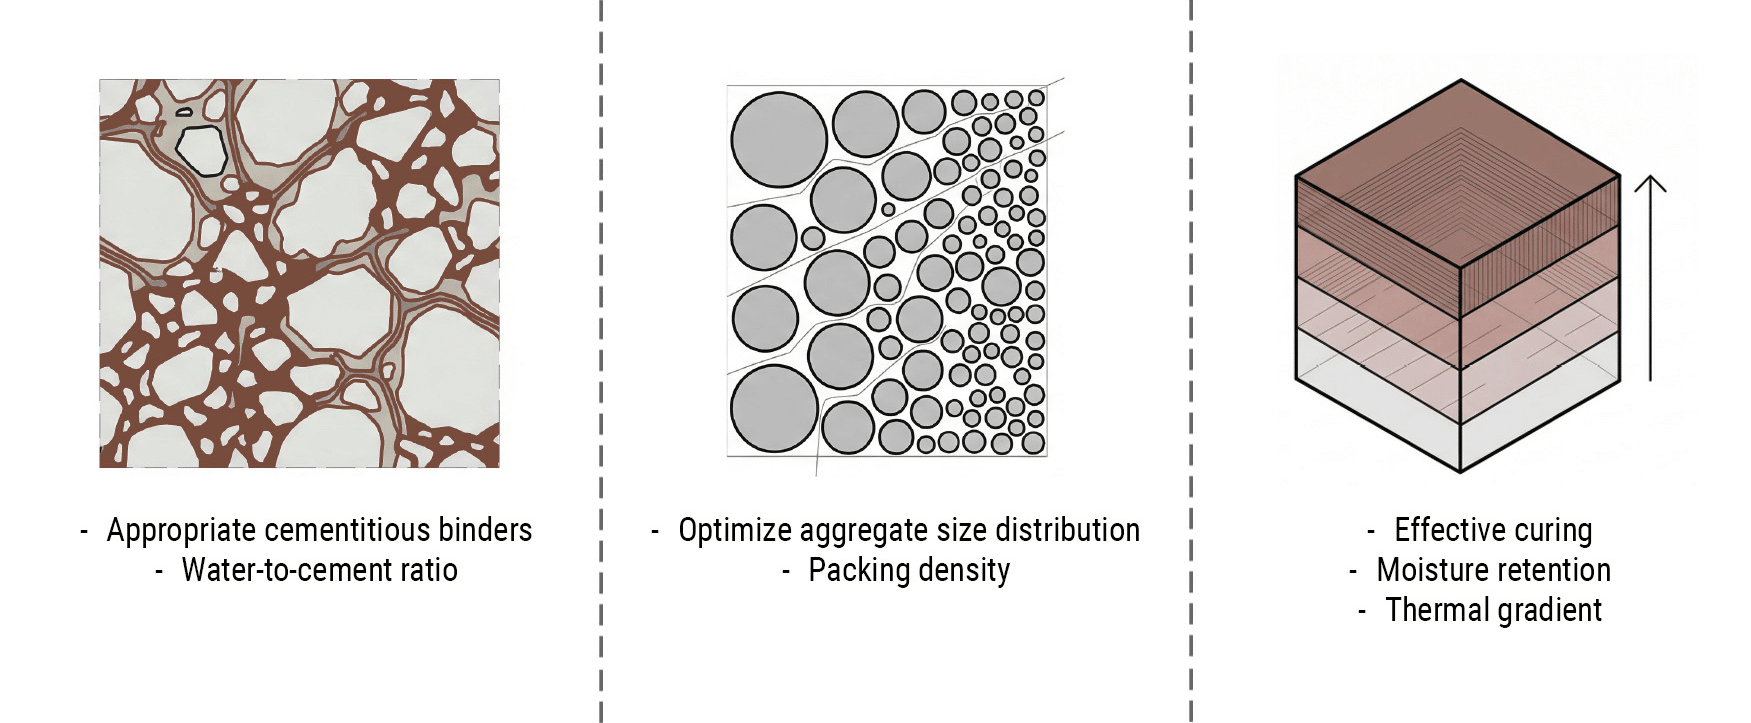
The findings established cement as the primary binder, highlighted the need for optimized particle distribution, and revealed strength loss due to moisture evaporation during curing.
Experiment Set E: Testing Aggregate Variation
Fabrication Parameters
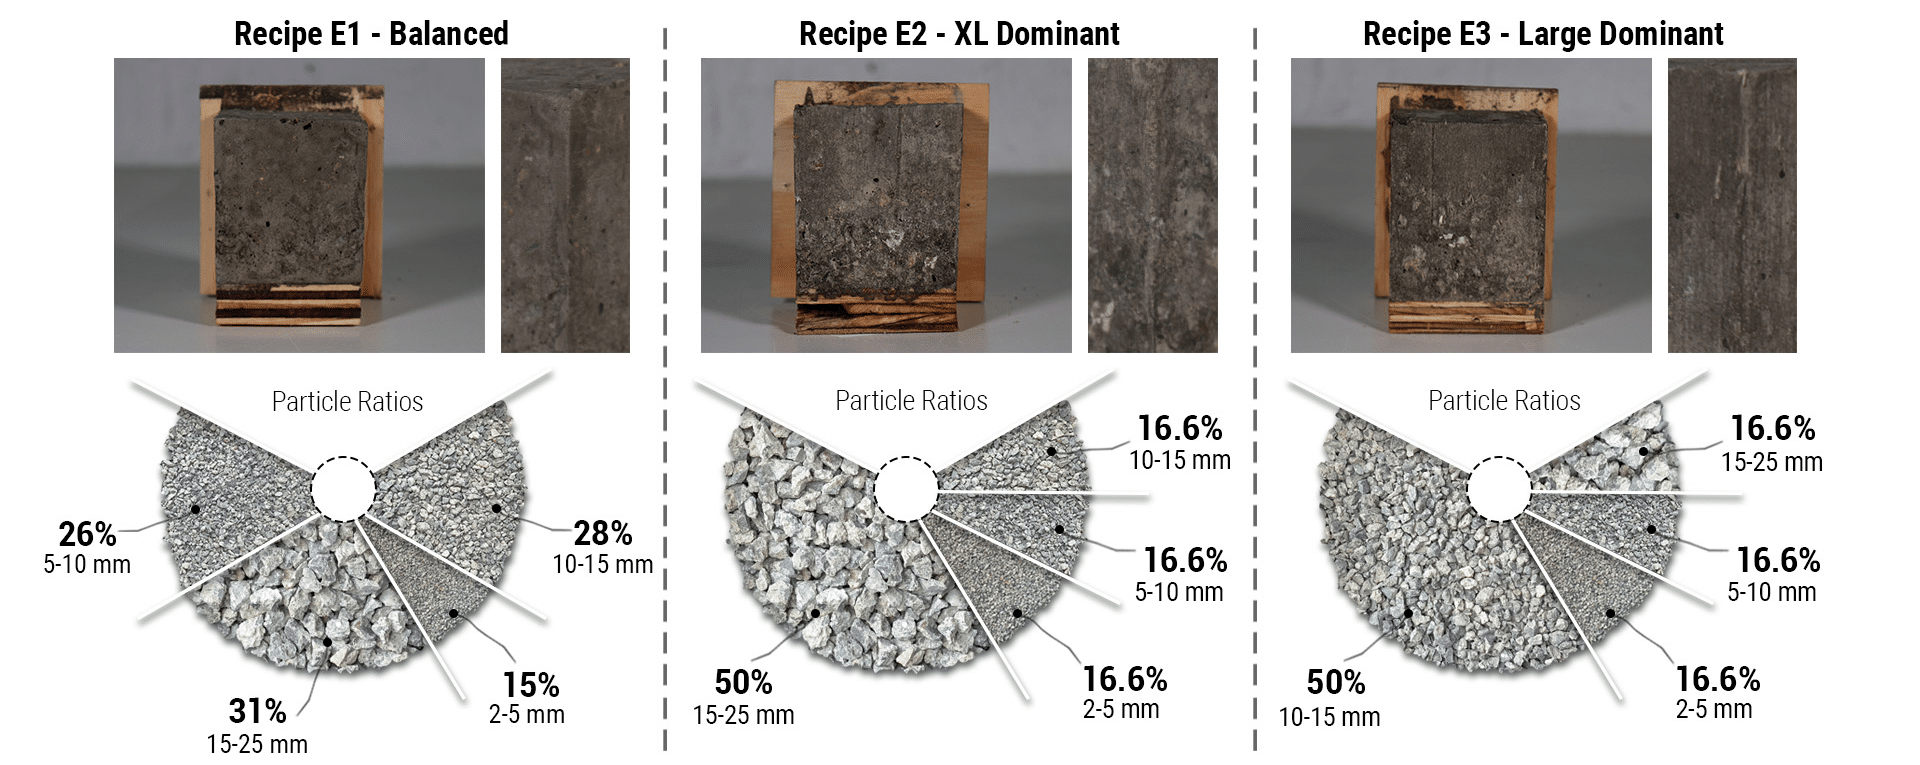
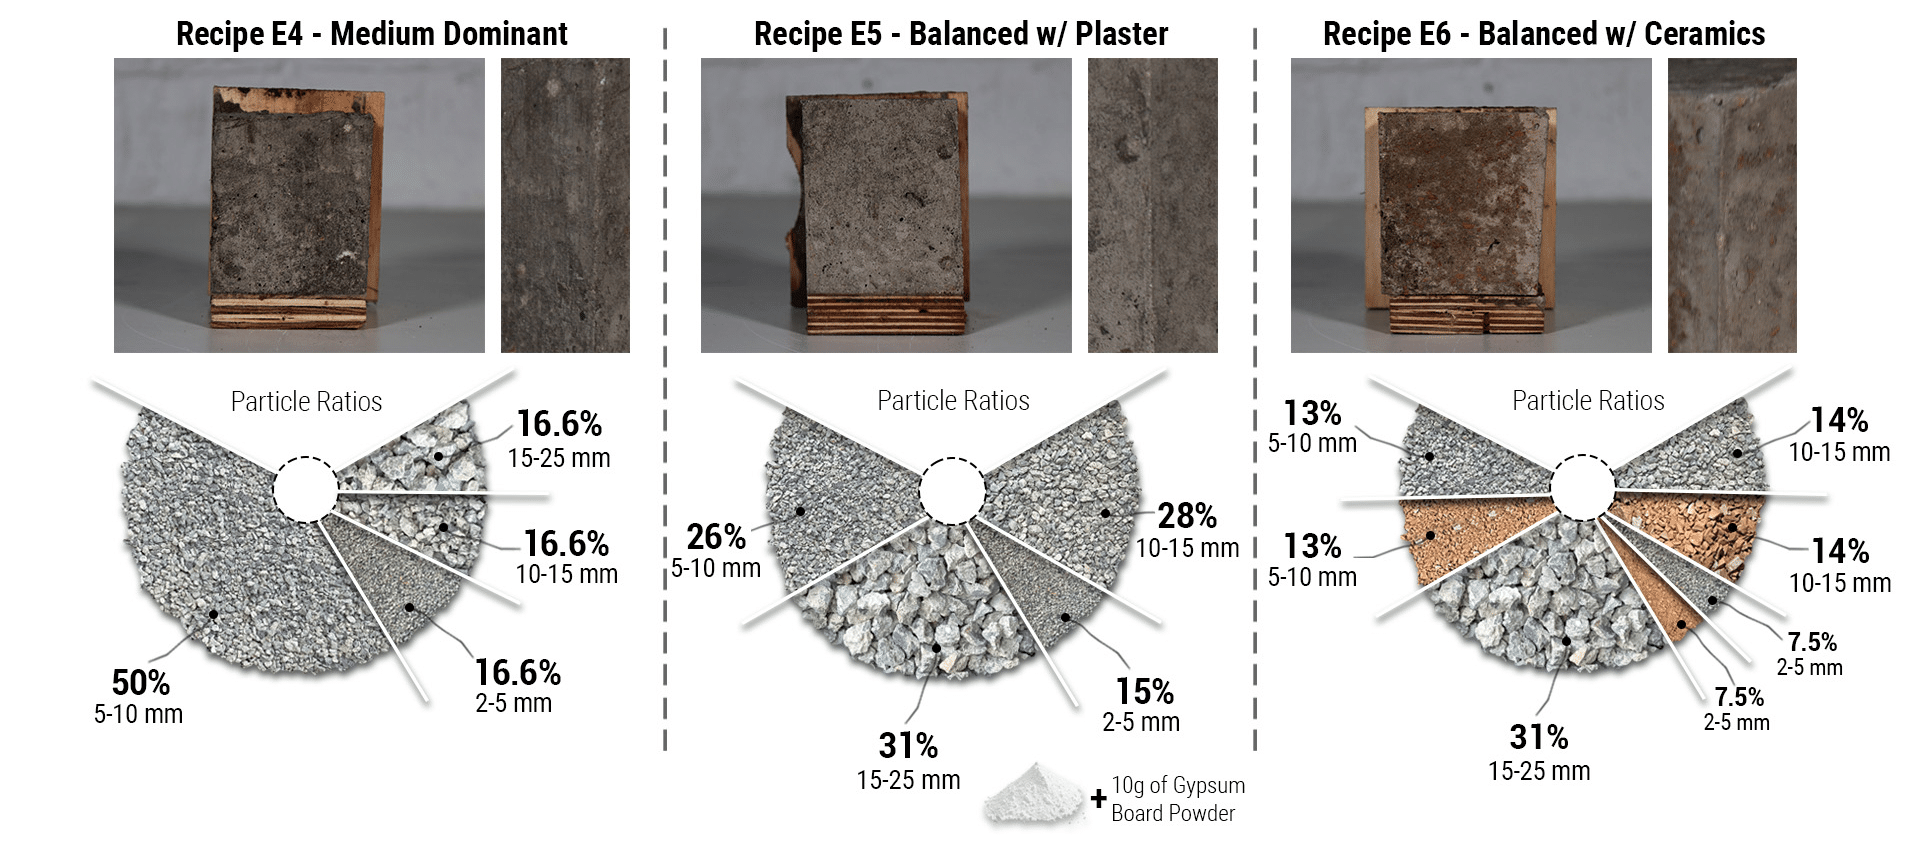
Experiment set E focuses on testing aggregate variation in compacted construction and demolition waste elements. The same procedure was applied, 7 cm mold, with ramming for compaction and sealed curing to control airflow.
Formulation
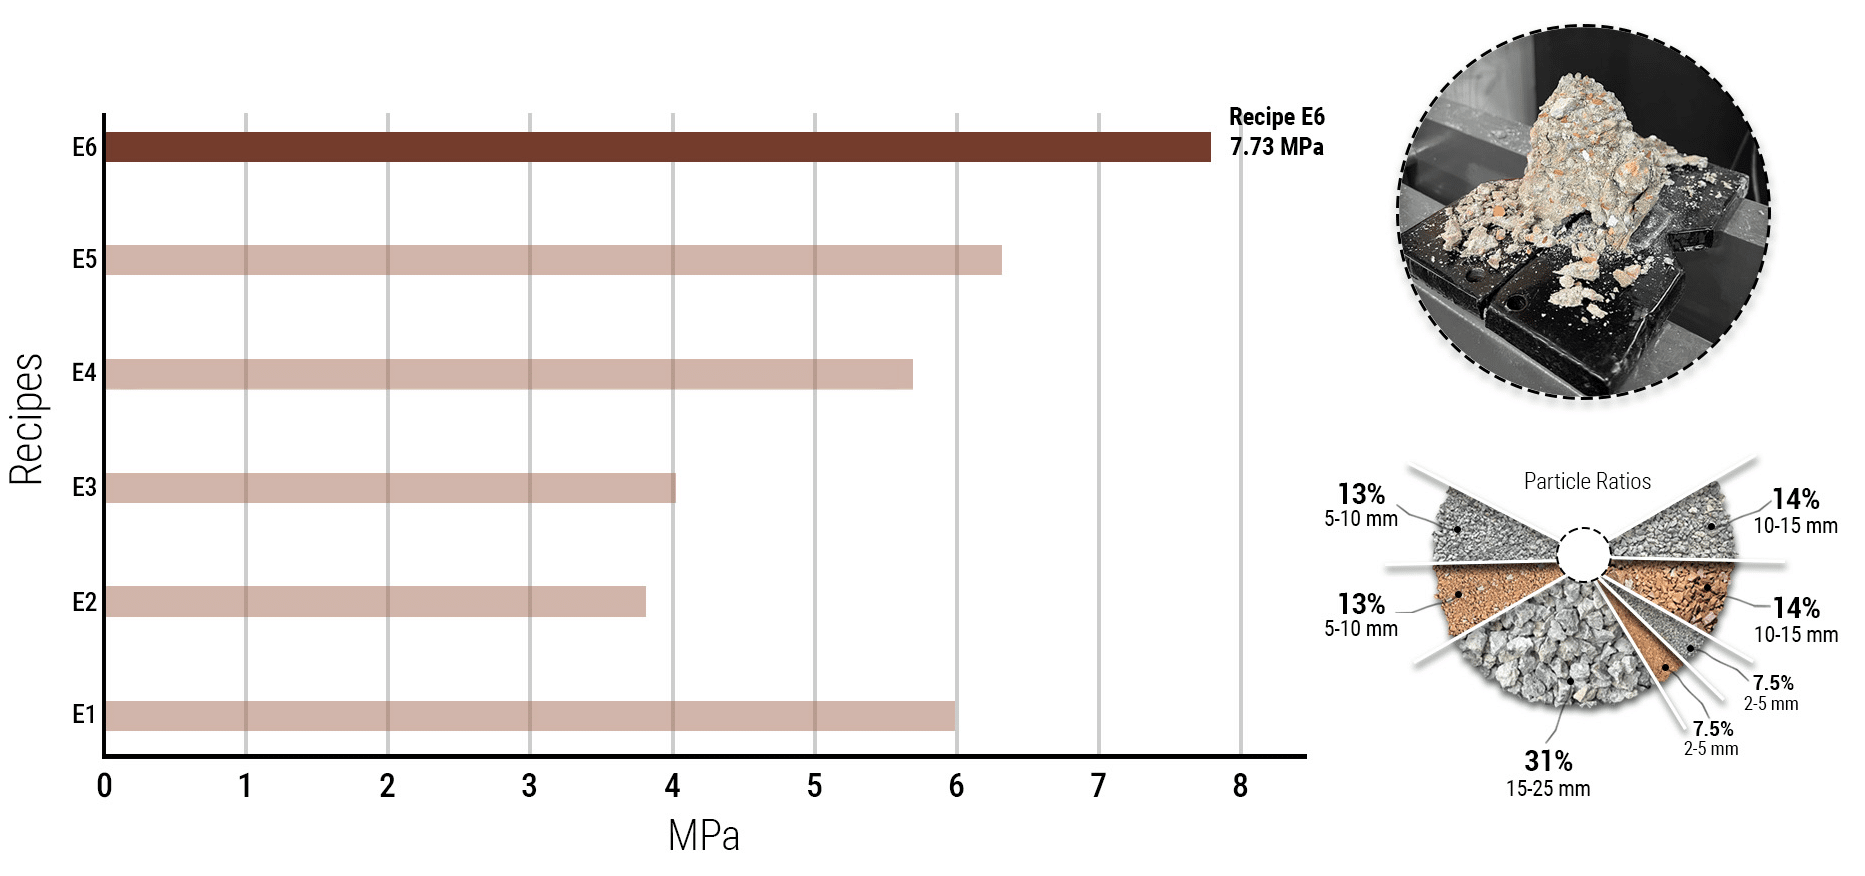
The prototype’s composition is as follows, with the corresponding ratios: cement 1, fines 0.81, aggregates 5.27, and water 0.86. The aggregates, which make up 66.3% of the mix, are distributed across four particle sizes: 15 to 25 millimeters, 10 to 15 millimeters, 5 to 10 millimeters, and 2 to 5 millimeters. This range allows us to test different packing and interlocking behaviors.
Particle Sizes and Demoulding
Analysis and Best Performance
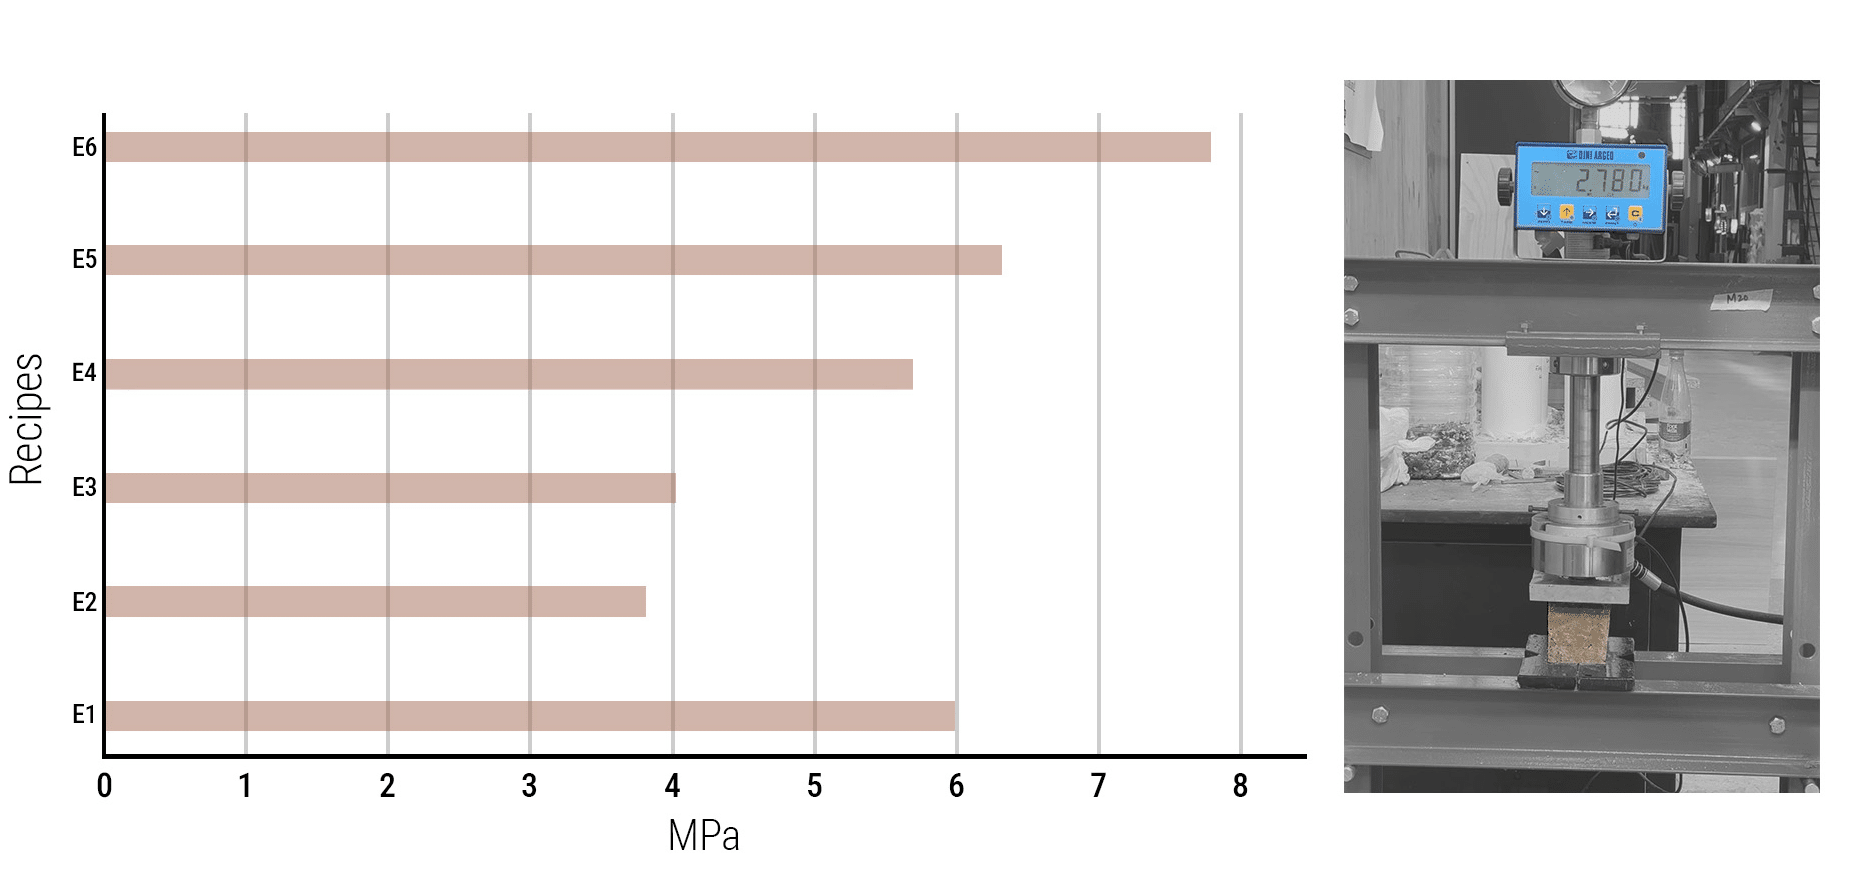
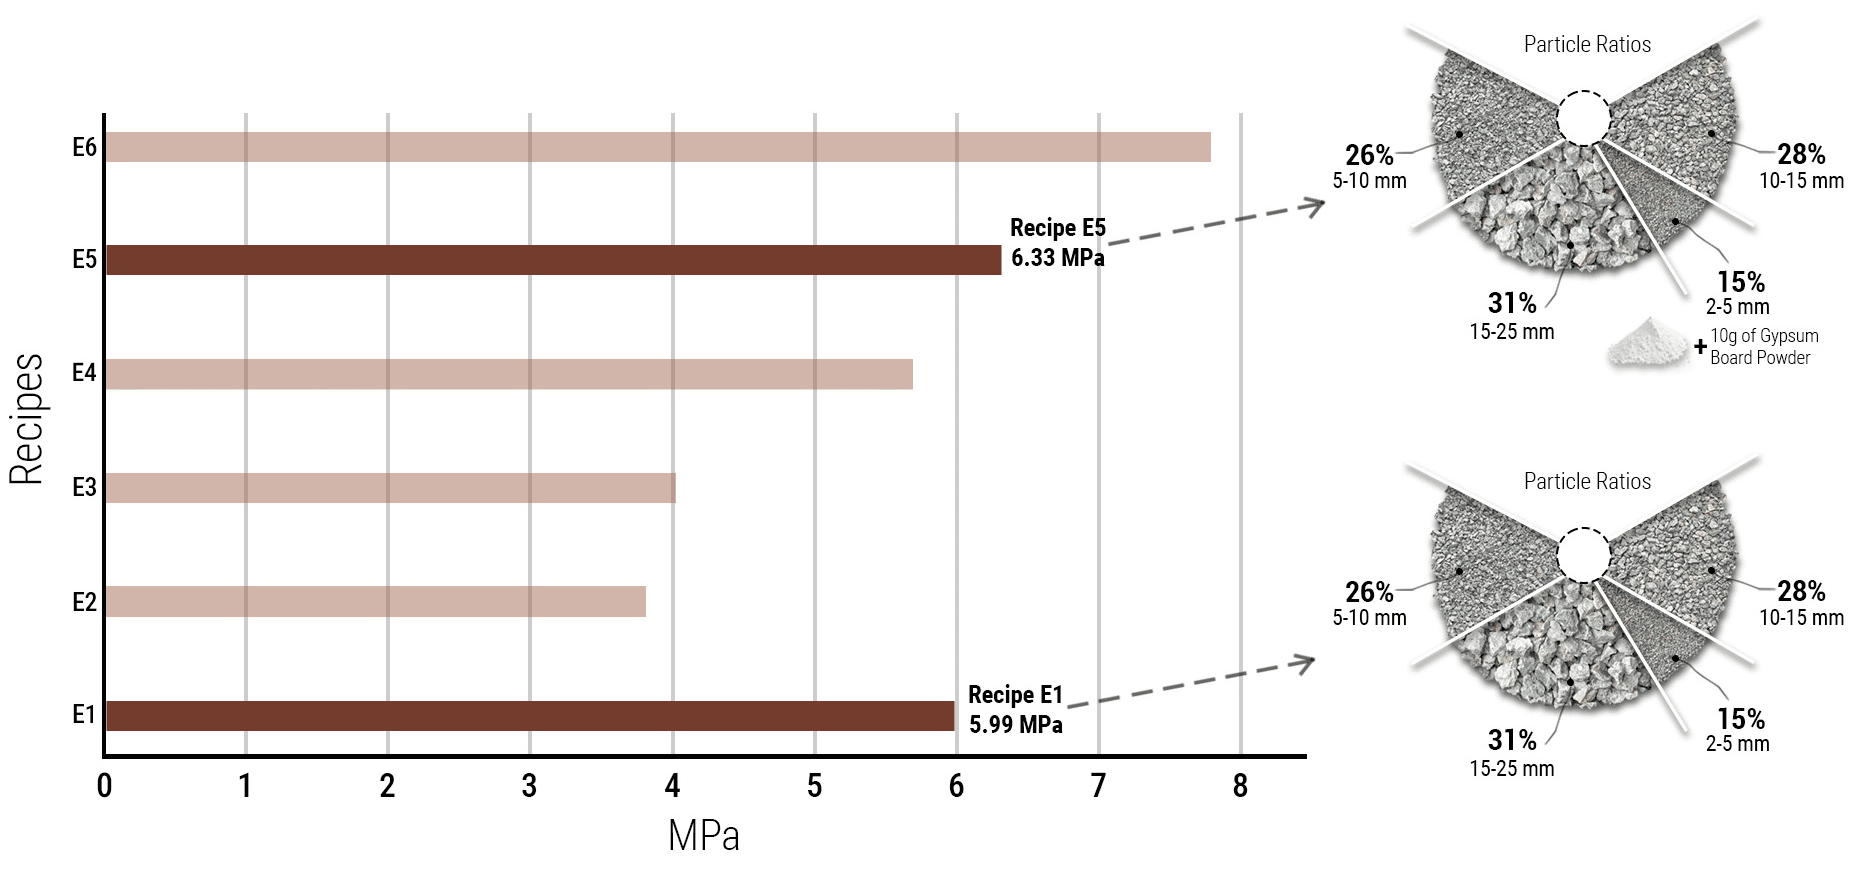
The same curing process was conducted for Experiment E, using a duration of 7 days. Compressive strength tests were then performed on all prototypes. The results show clear variation based on particle distribution and material composition. The best performance was achieved by recipe E6, which reached approximately 7.73 MPa. This indicates that combining aggregates with ceramic particles improves strength through superior interlocking and material interaction. Secondary results show that E5 and E1 reached 6.33 MPa and 5.99 MPa, respectively. Both are balanced mixes, suggesting that well-distributed particle sizes contribute significantly to structural performance.
Conclusion and Next Steps
Experiment E
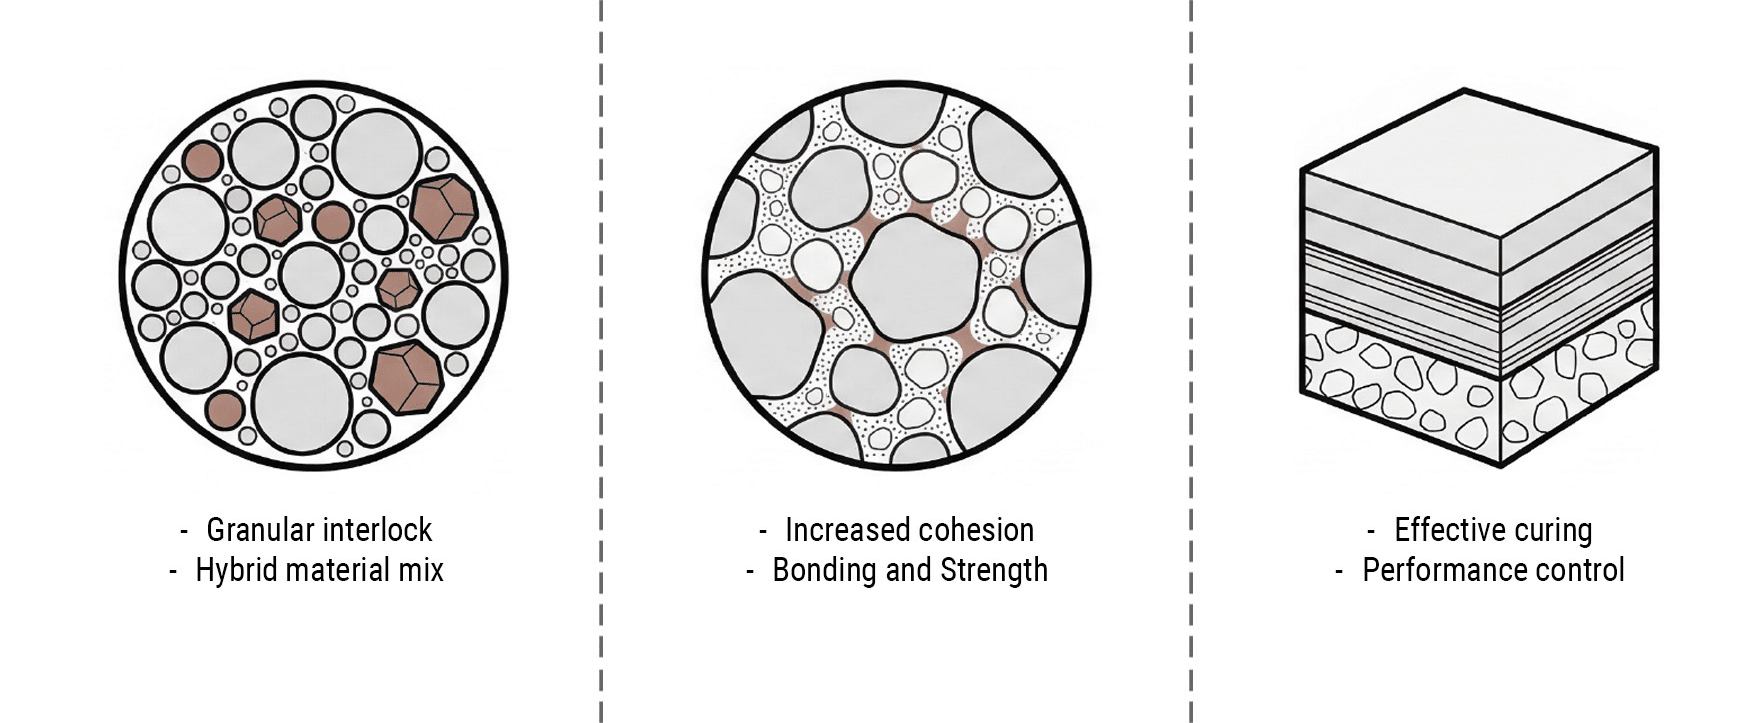
This experiment highlights three key findings: First, granular interlocking and hybrid material mixes improve performance. Second, the increase cohesion, bonding, and overall strength. And third, controlled curing plays a critical role in achieving consistent results.
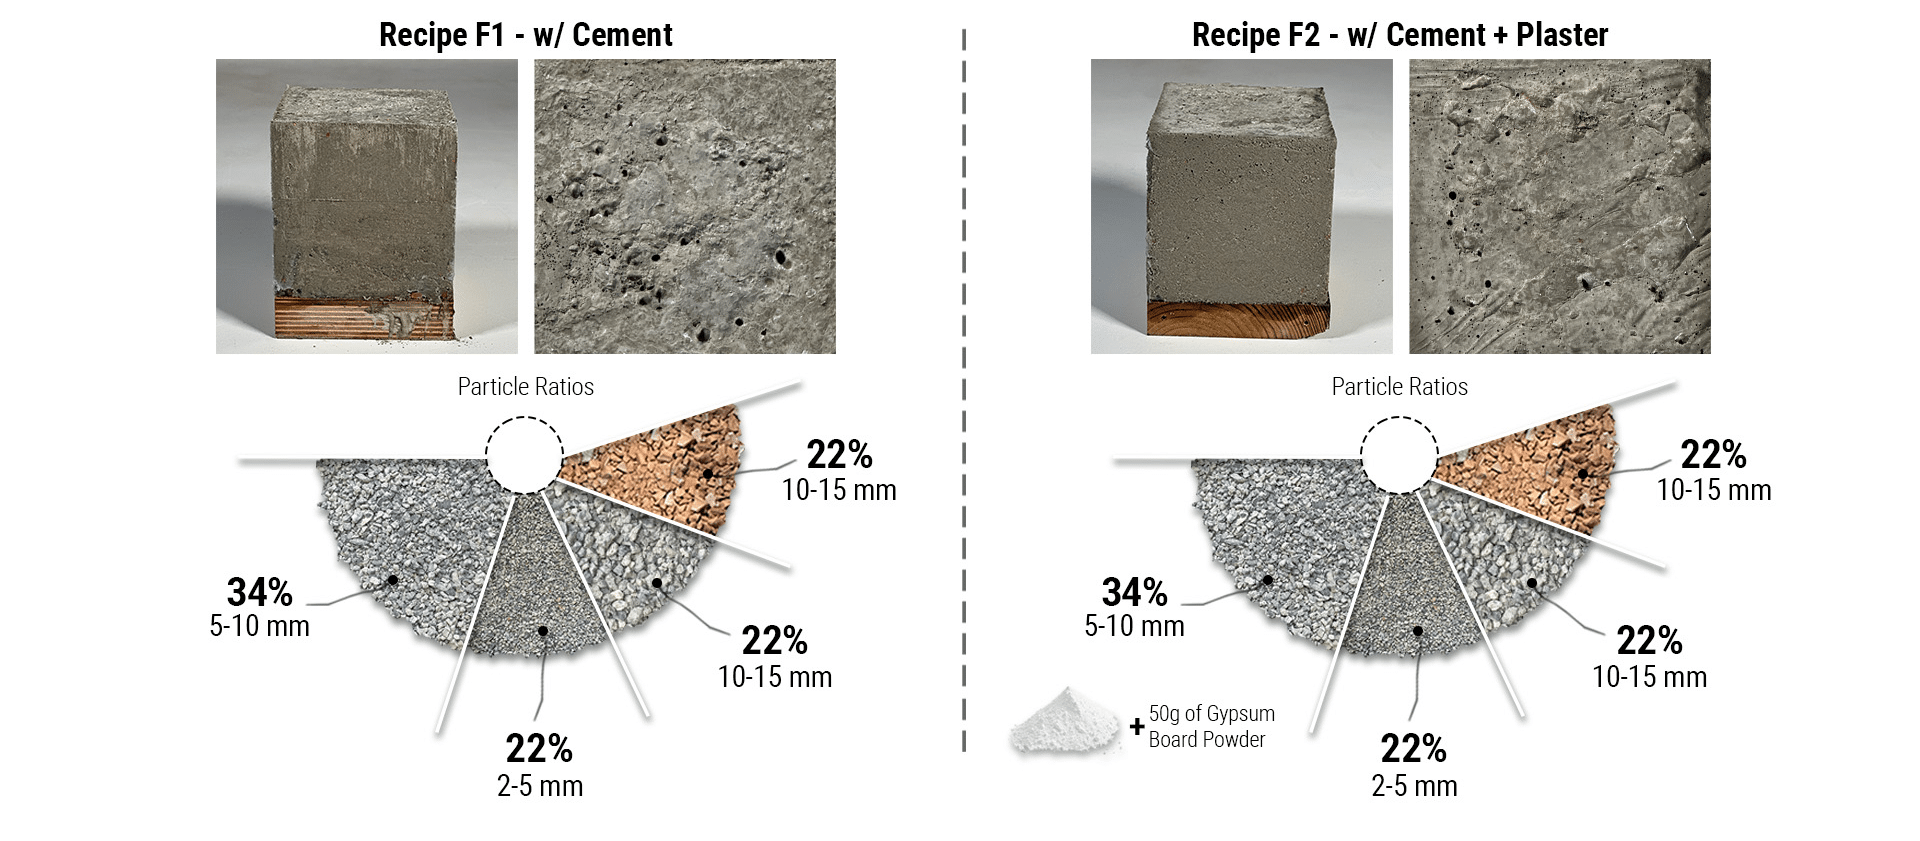
Experiment F: Optimization
Fabrication Parameters
The research then progressed to Experiment F, where fabrication parameters were further refined by increasing the mold size to 10 cm and introducing vibration during casting to improve compaction. After casting, the molds were sealed with plastic for the first 24 hours to retain moisture and ensure proper hydration.
Formulation
For this recipe, mix proportions were calibrated to match a 20 MPa concrete benchmark. Aggregate size was limited to below 15 mm, as larger particles were unsuitable for the mold scale and could compromise the reliability of compressive strength results. A finer particle range of 0.6–1.2 mm was also introduced, intended to function similarly to sand in conventional concrete mixes by improving packing density and cohesion.
Particle Sizes and Demolding
The particle distribution was balanced with a slight dominance of 5–10 mm sizes. The only variation between the two recipes was the addition of 10% gypsum board powder in the second mix.
Curing Phase
Further research indicated that submerging the molds in water is the most effective curing method, as it ensures consistent hydration of the concrete. The curing period is currently underway prior to conducting compressive strength tests.
The Spanning Element Idea and Tension Tests
At this stage, the project transitions from compression-based systems to spanning elements, where tensile performance becomes critical. The focus shifts toward introducing tensile capacity within a predominantly compressive CDW material system.
Architectural Systems
From Vertical Wall Elements to Horizontal Spans
CDW-based systems typically perform well in compression, similar to masonry or vault structures. However, spanning systems require a hybrid approach that combines compression and tension. This leads to the exploration of reinforced slab systems and tension-integrated structural strategies.

Spanning Element Focus
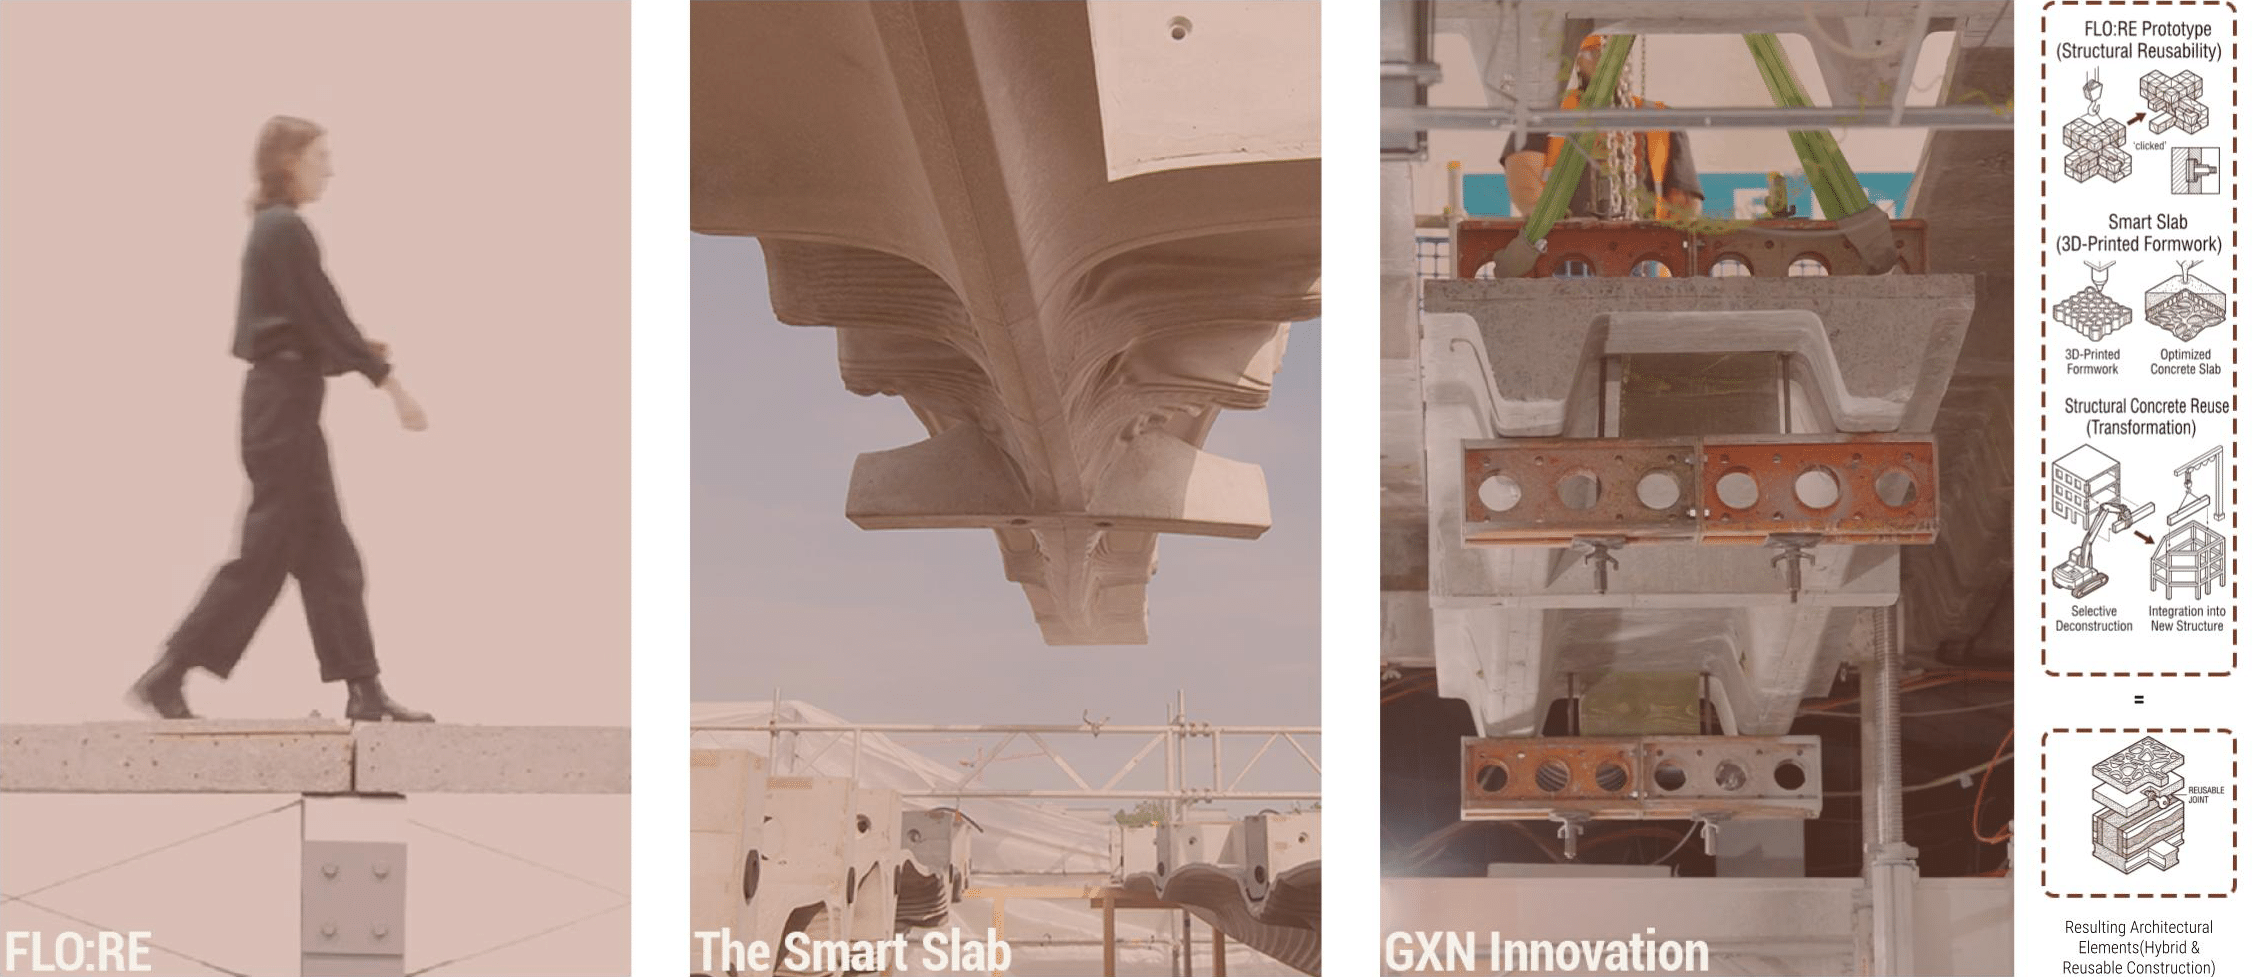
State of the art for the Spanning Element System
Precedents such as the Smart Slab and structural reuse projects demonstrate how geometry and fabrication enable efficient spanning systems. These references inform the development of a ribbed, material-efficient slab system.
Experiment Set G: Bio-based Tension Systems
Fabrication Parameters
Initial prototypes explored fabrication methods such as ramming and vibration during casting. These tests highlighted the role of compaction in influencing density, bonding, and overall material performance.
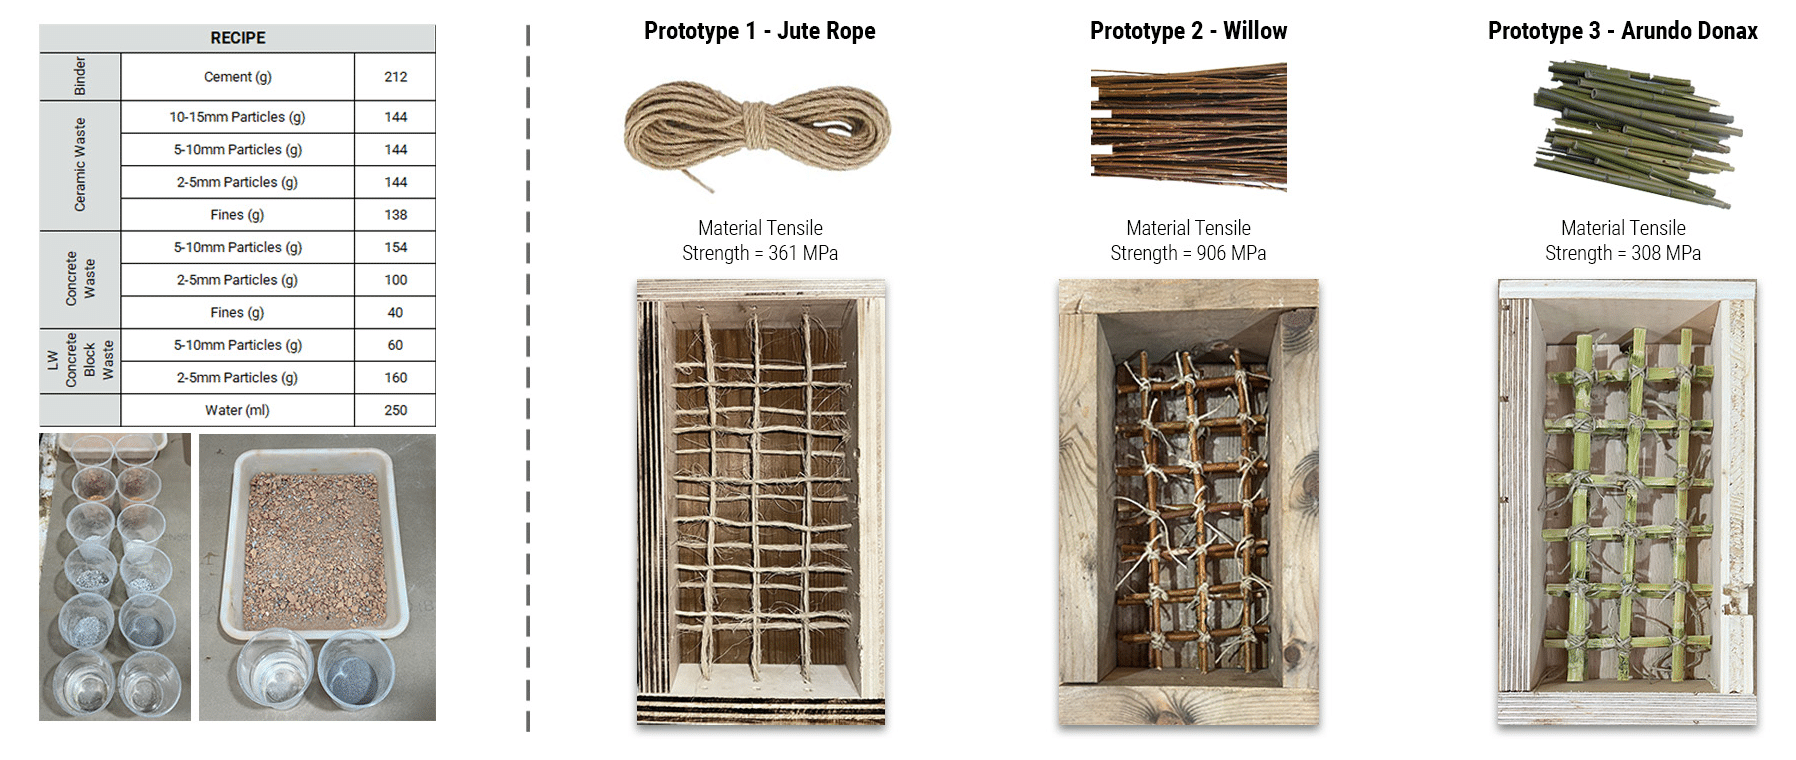
Formulation and Tensile Systems
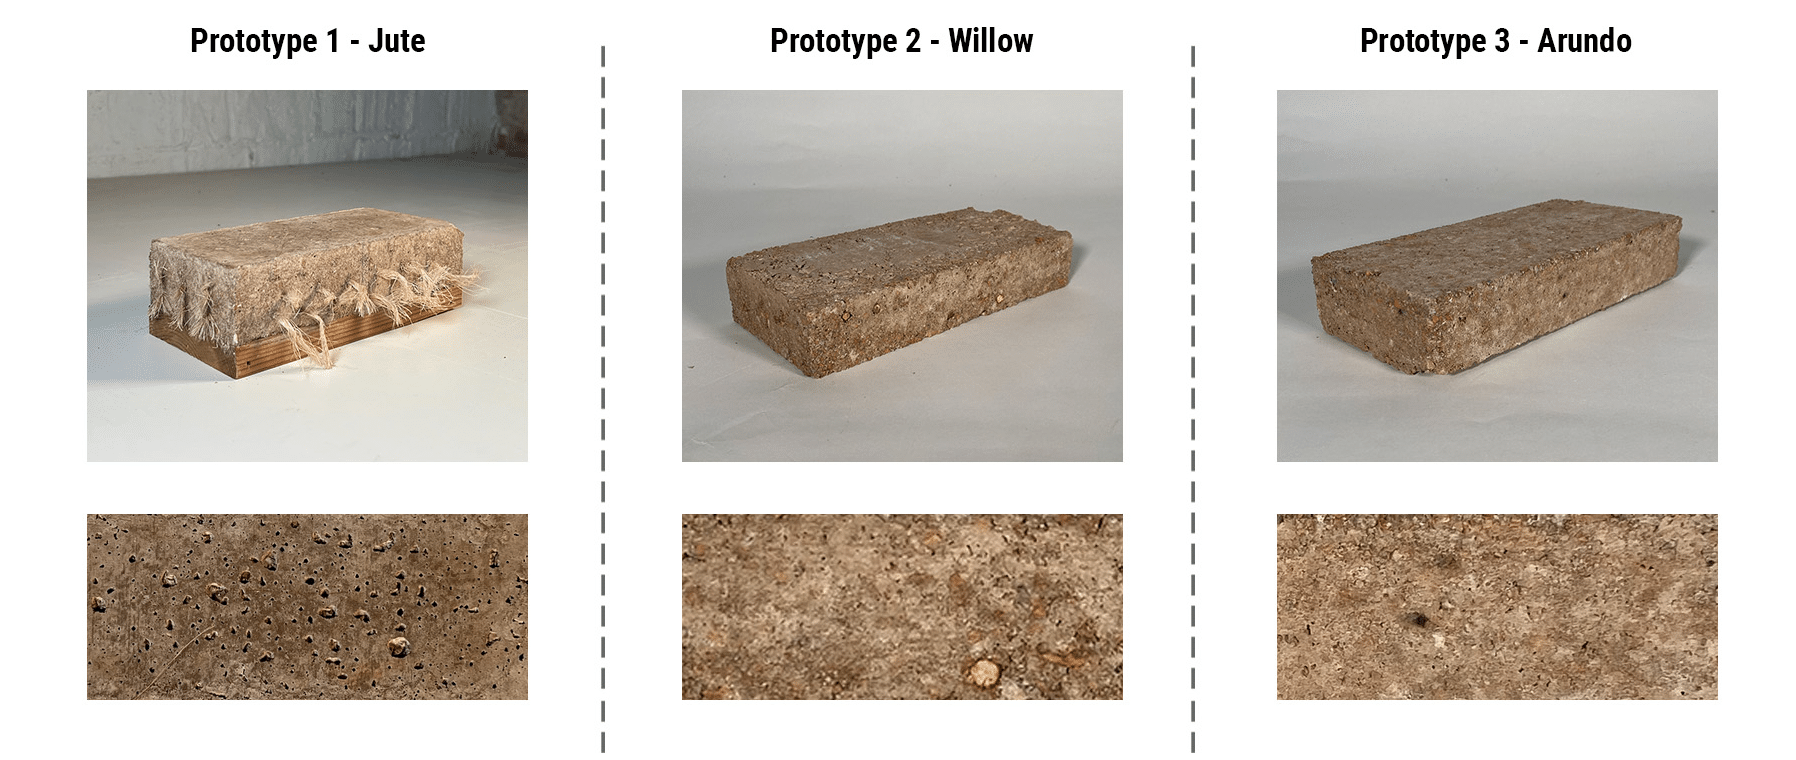
Bio-based materials, including jute, willow, and arundo donax, were tested to introduce tensile capacity. While these improved cohesion, their structural contribution remained limited and inconsistent.
Demolding
Post-demolding observations revealed variations in surface quality and internal bonding. The material exhibited brittle behavior, particularly under tension-dominated conditions.
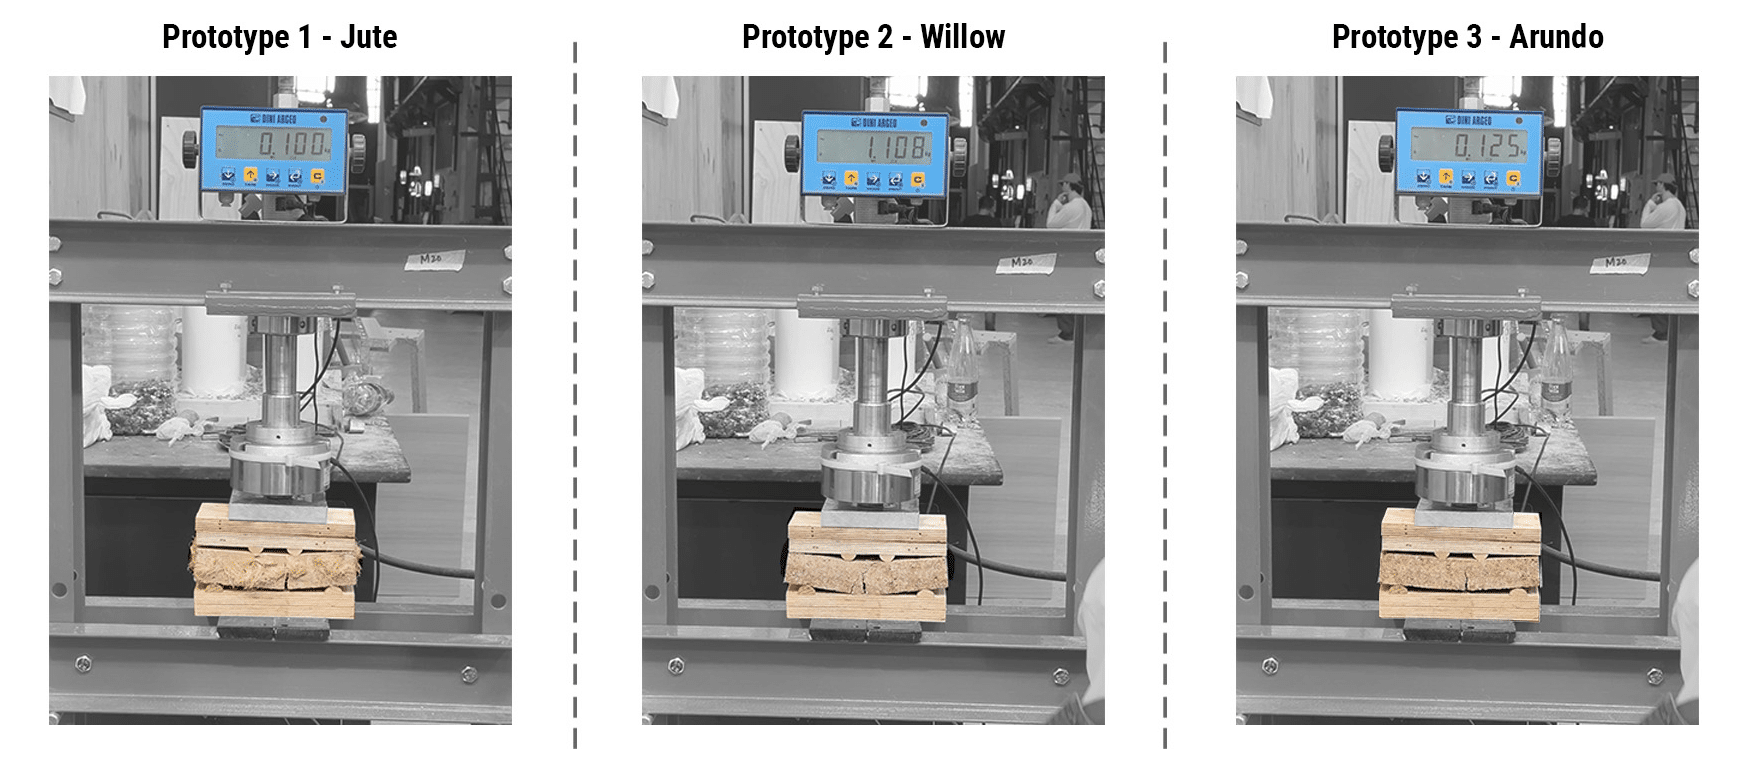
Flexural Performance Tests Experiment G
Analysis and Best Performance
Flexural tests showed incremental improvements across iterations; however, performance remained insufficient for structural applications. This indicated that material modification alone could not resolve tensile limitations.
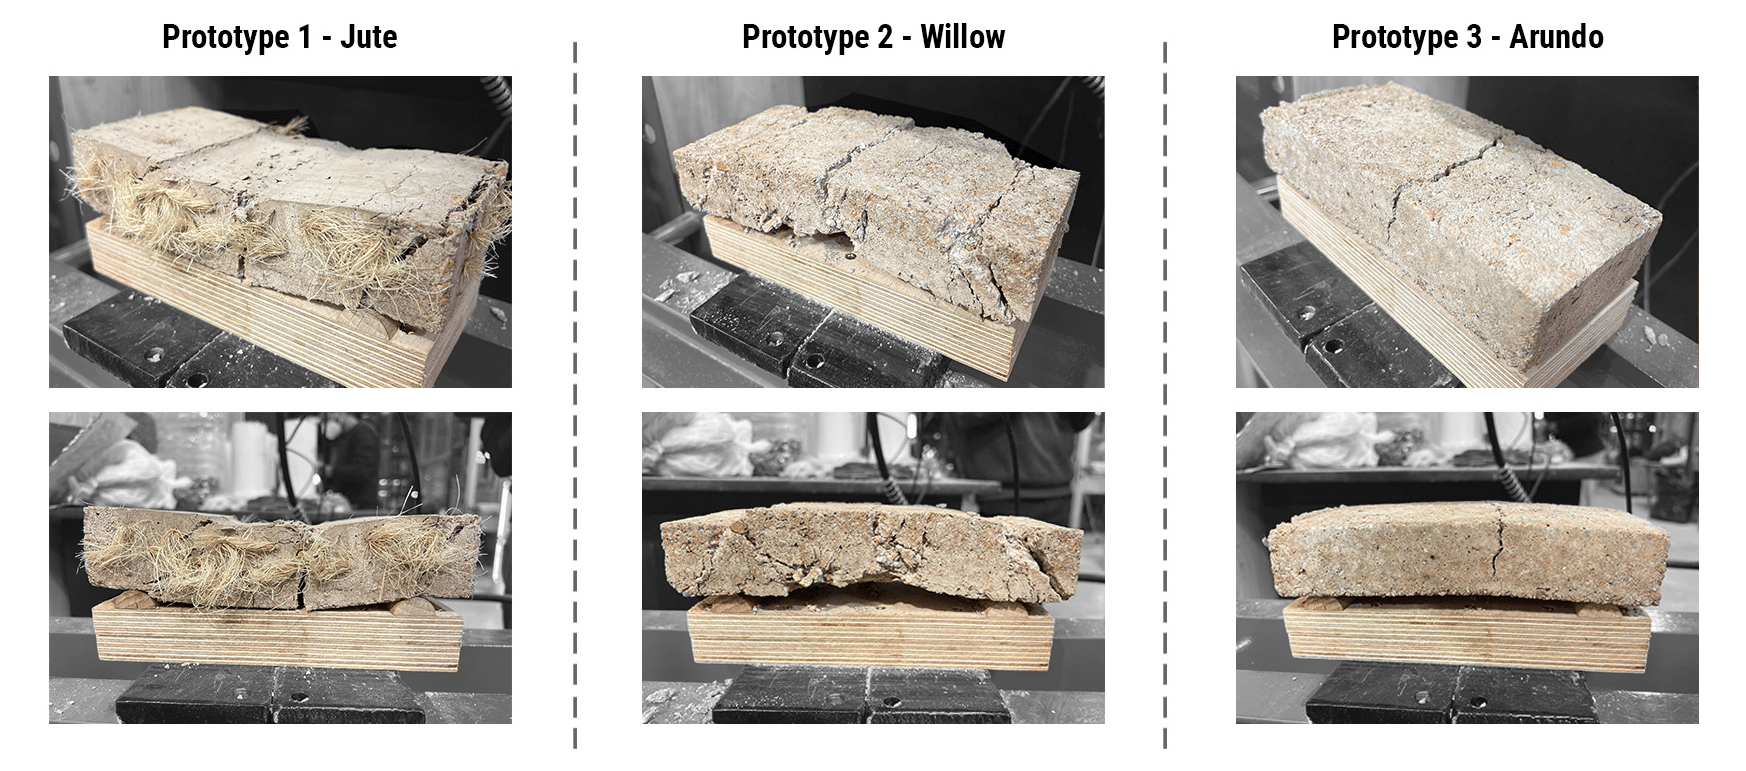
Visual Analysis
Failure patterns revealed brittle cracking and lack of tensile continuity. The system demonstrated sudden failure rather than gradual load redistribution.
Experiment Set H Introducing Steel Rebars
Formulation & Tensile Systems
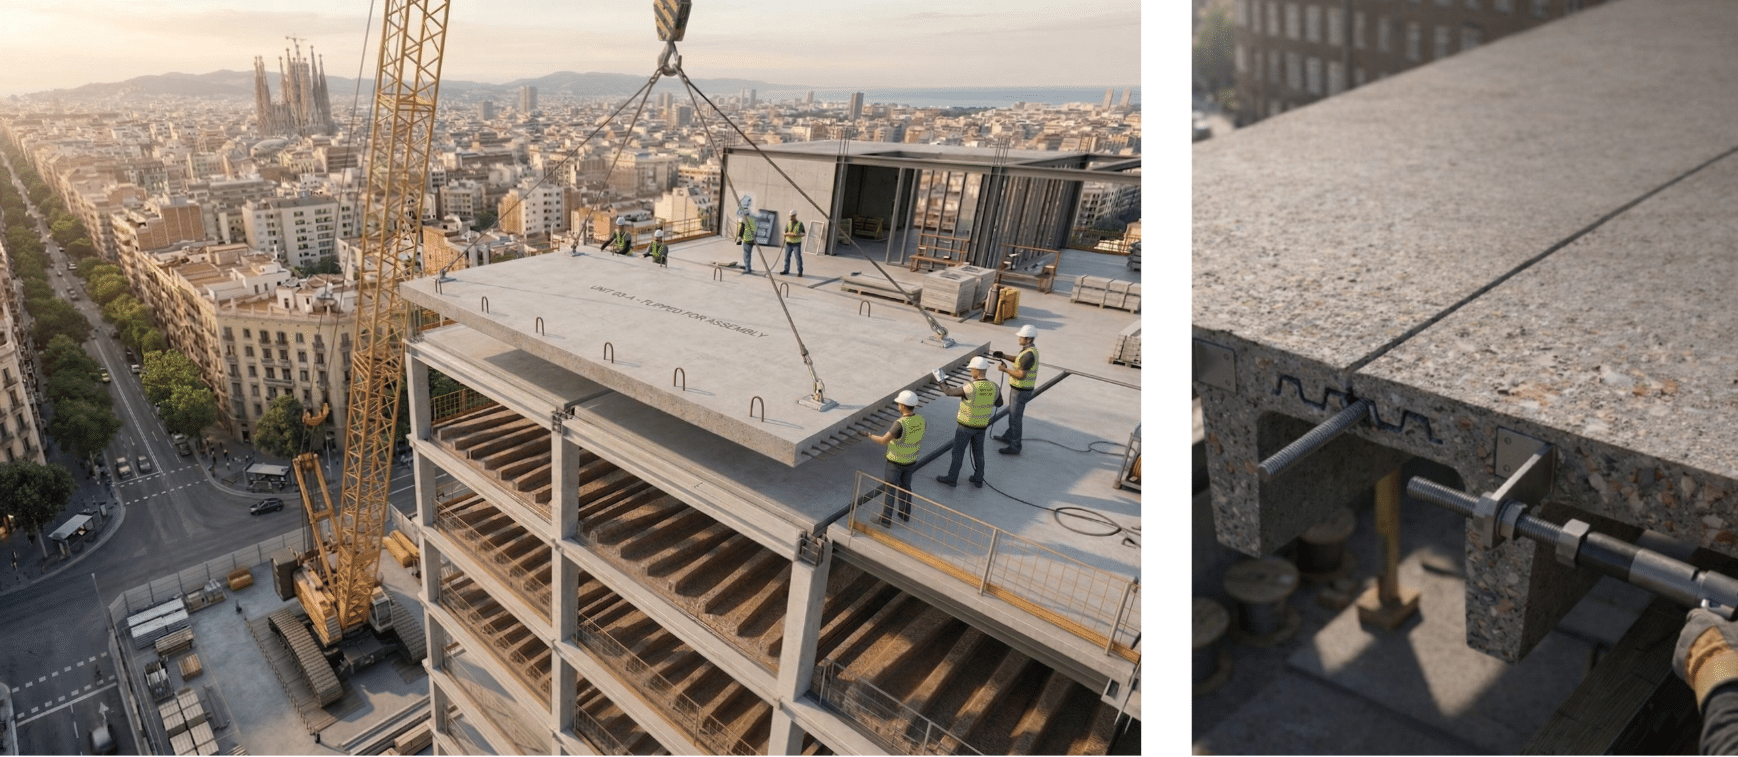
These limitations led to the integration of reclaimed steel rebars sourced from construction waste. The system evolves into a hybrid model, where compression is managed by the CDW composite and tension by steel reinforcement. Cement remains the only new material introduced, while all other components are reclaimed.
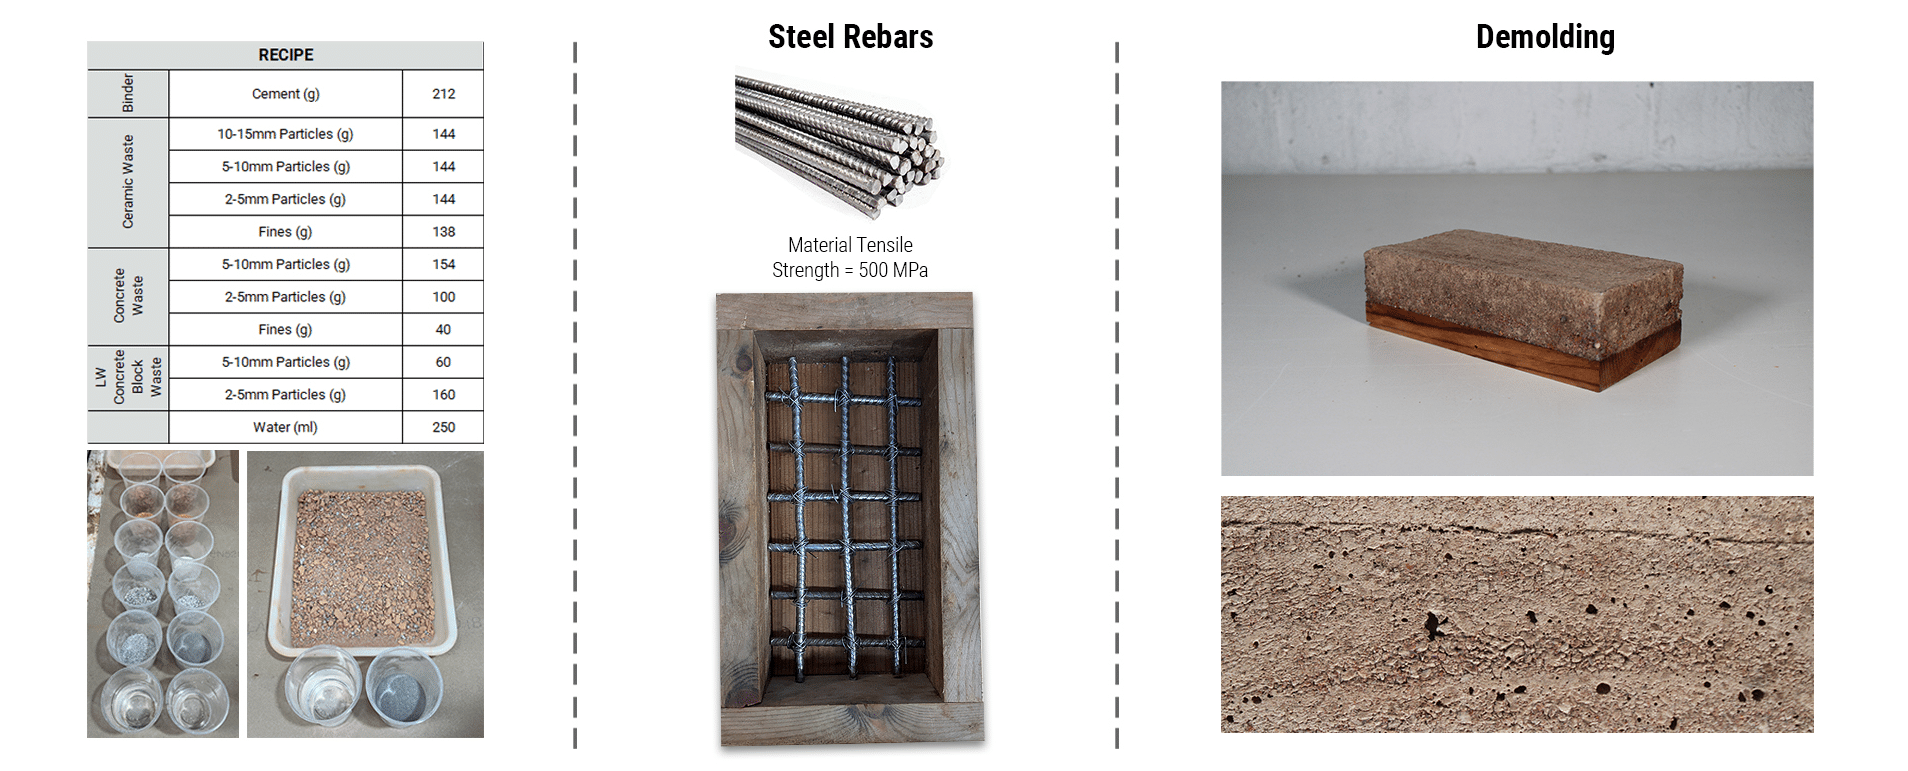
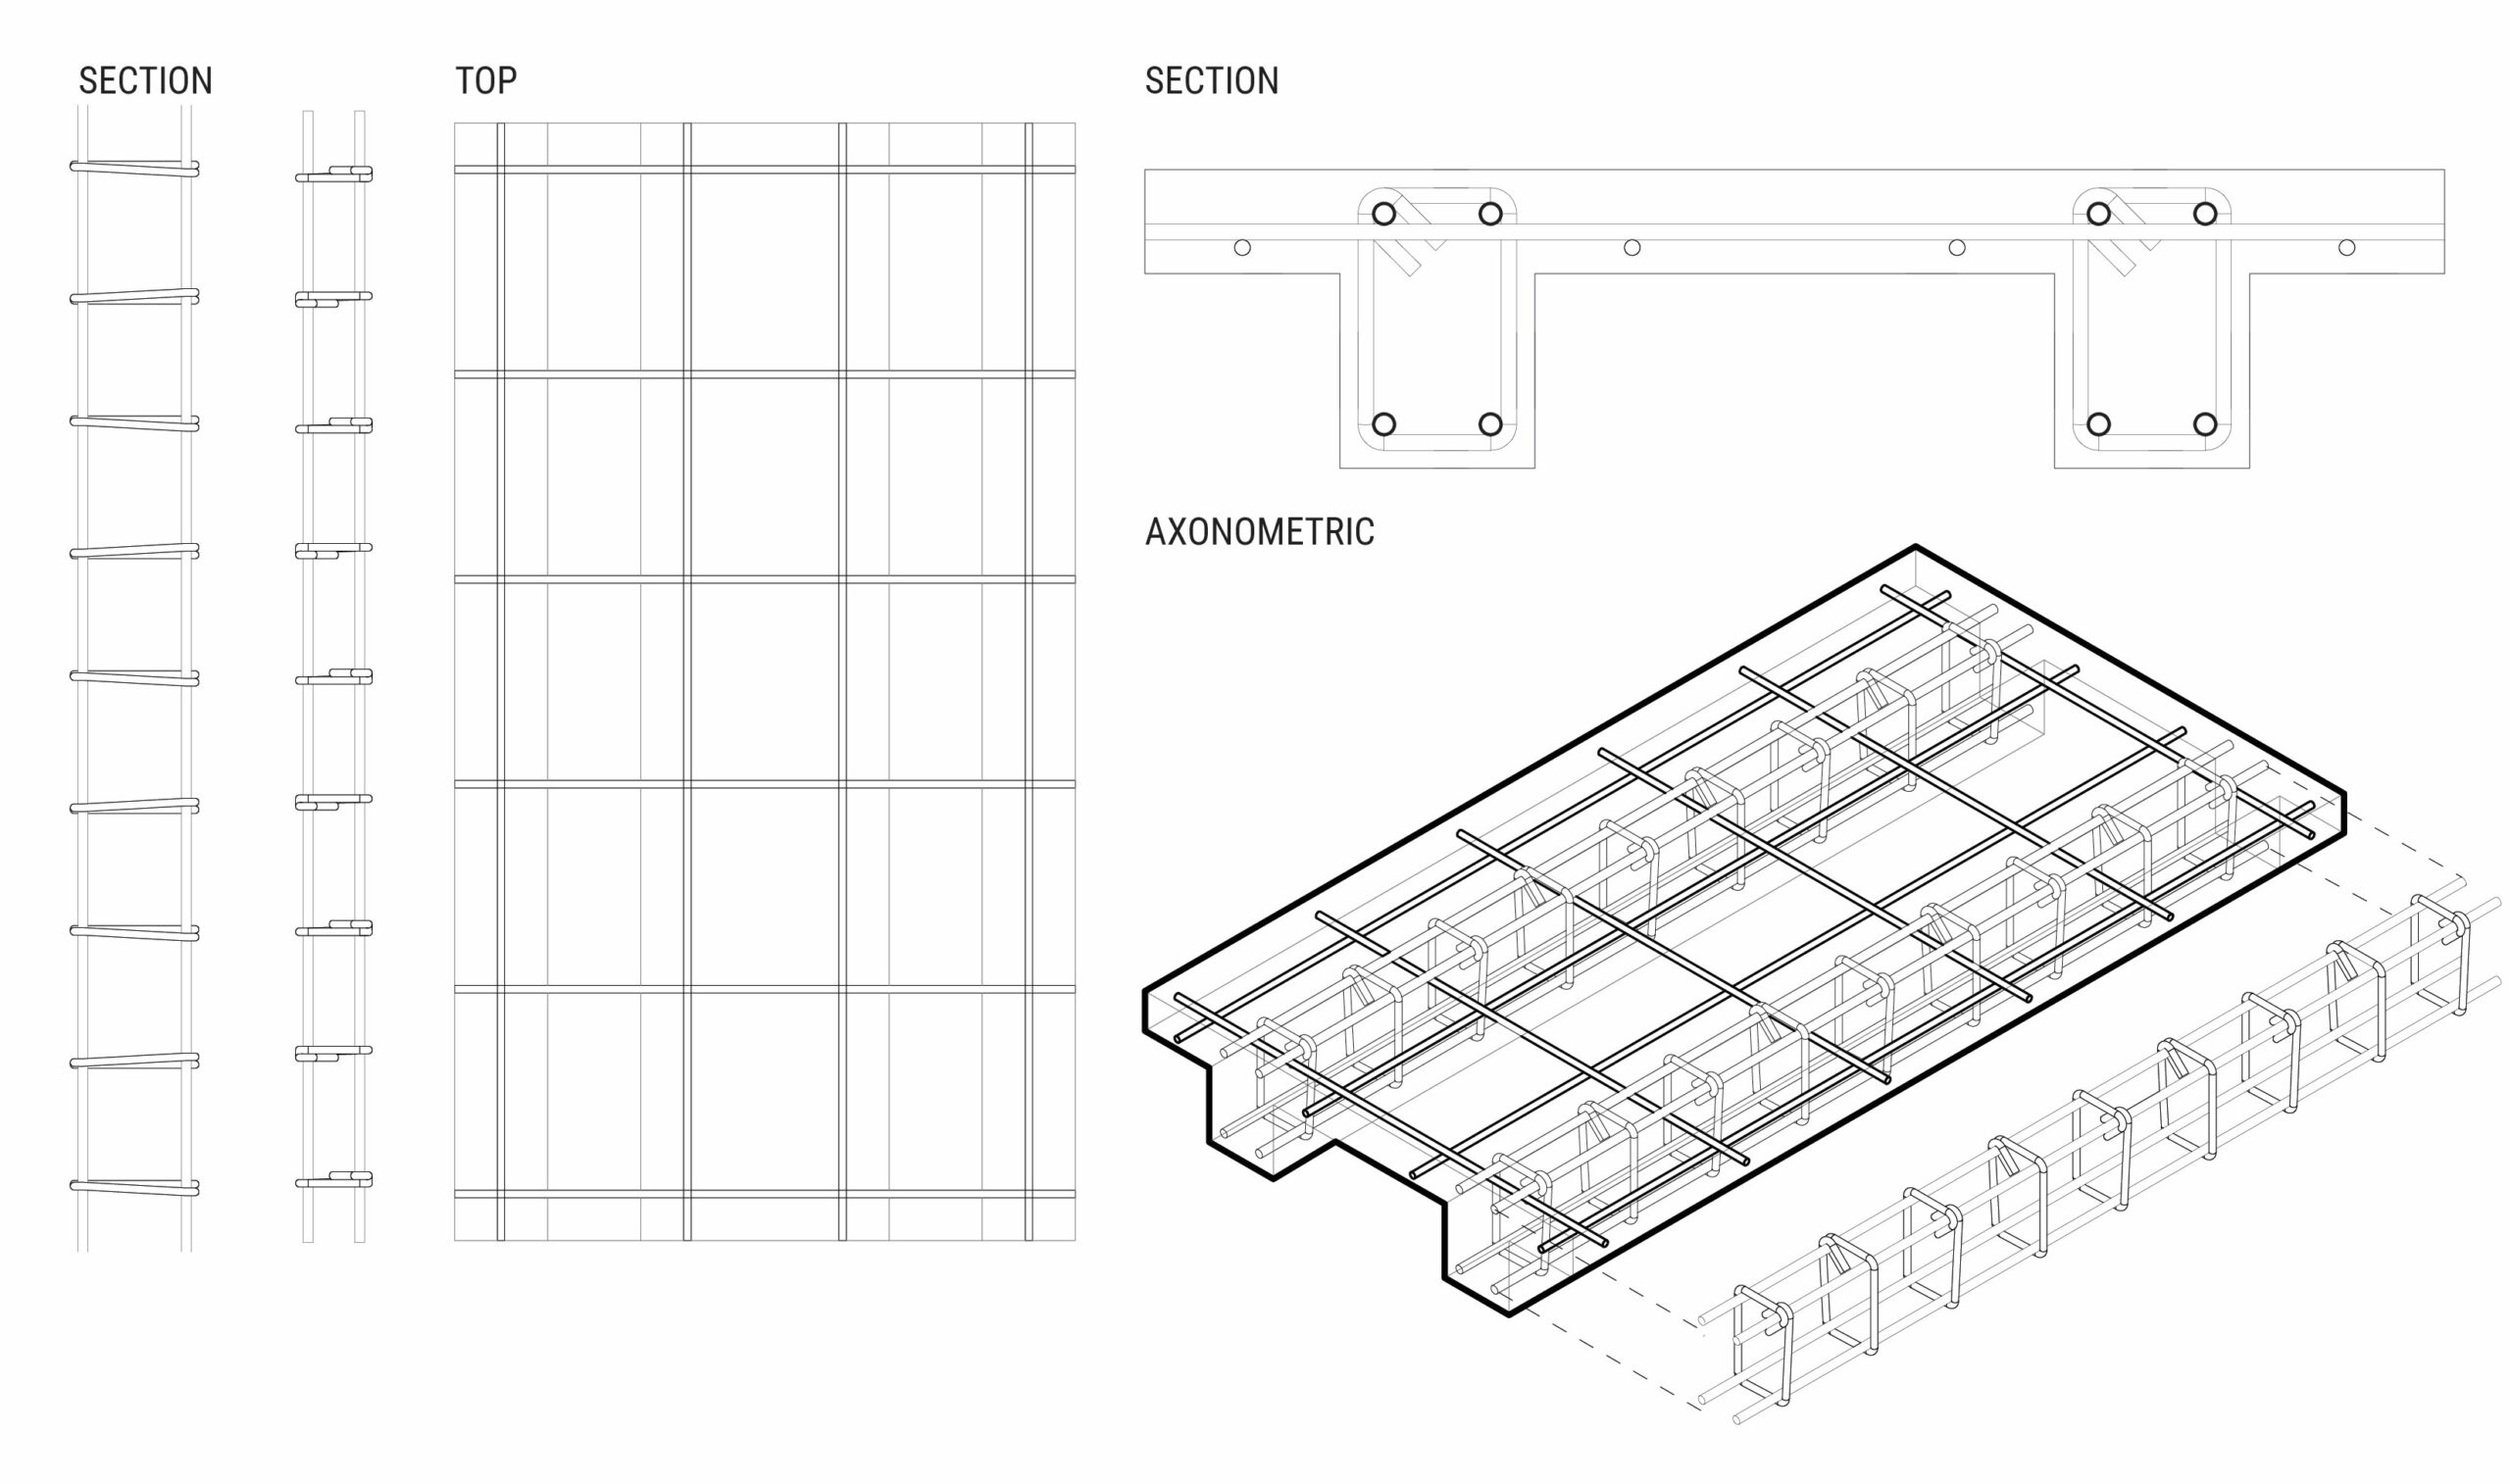
This transition establishes the foundation for a precast ribbed slab system, where geometry, material grading, and reinforcement collectively enable structural performance.
Scaling Up: Design Proposal and Network Systems
Design Process
Design Catalogue
Design Proposal
Architectural Slab and Representation
Fabrication and Assembly
Designing the Mold and Final Prototype
Network System
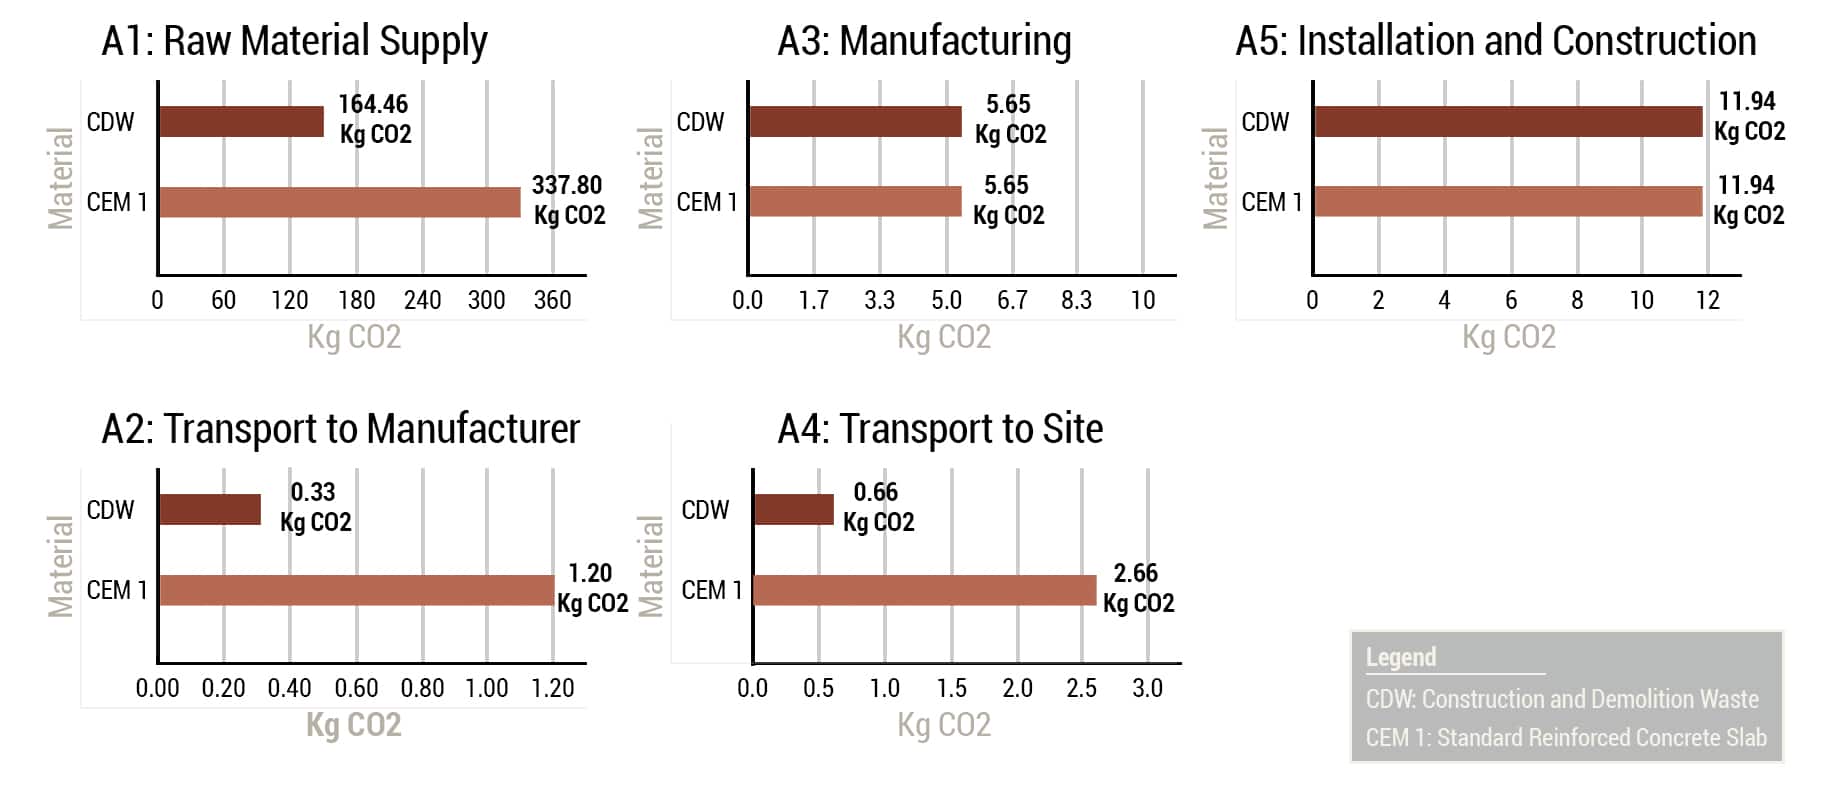
Carbon as a Managed Asset
This chart compares the “Upfront Carbon” emissions of a CDW slab against a conventional concrete slab across life cycle stages A1 to A5. The primary reduction occurs in Raw Material Supply (A1), where the CDW slab significantly outperforms conventional concrete by avoiding the production of virgin cement and aggregates in favor of reused materials. While manufacturing and installation (A3 and A5) remain comparable, the CDW system achieves further savings in Transport (A2 and A4) by replacing traditional fuel-based logistics with minimal or non-mechanized transport methods.
Barcelona Upstream and Downstream Flows
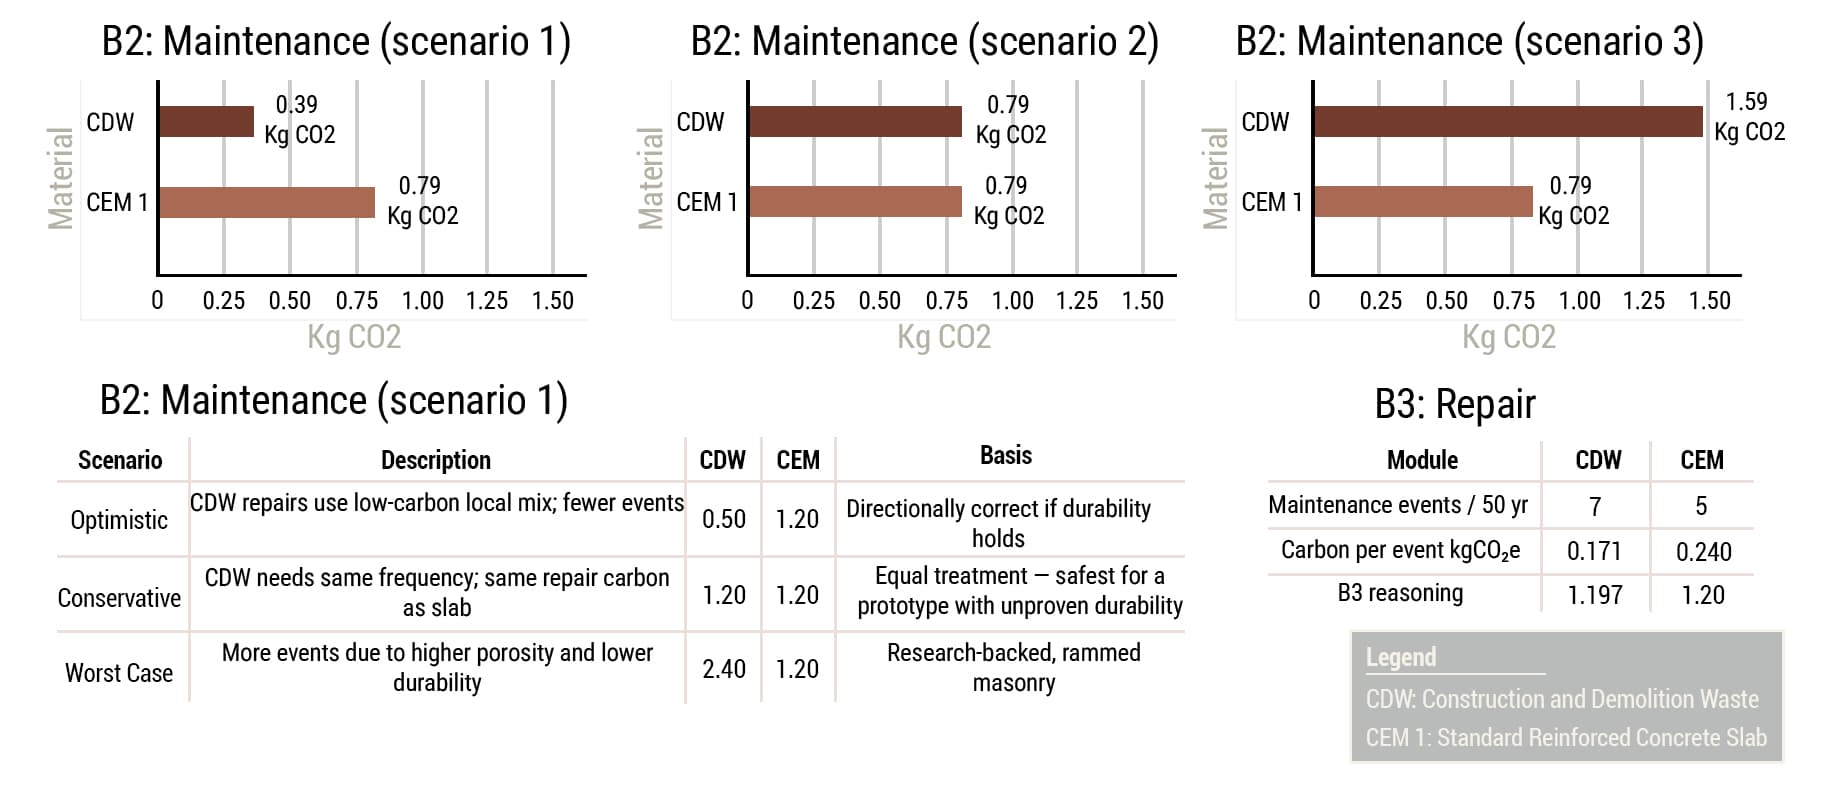
Long-term environmental performance is heavily dependent on durability assumptions. This figure analyzes three distinct maintenance scenarios: in the Optimistic Scenario, CDW performs better through lower-carbon repair strategies and localized materials. While the systems are comparable in a neutral scenario, the Worst Case highlights potential durability concerns that could require more frequent interventions. However, across all scenarios, the carbon cost per repair event remains lower for CDW, demonstrating that localized material loops can buffer the impact of maintenance over time.
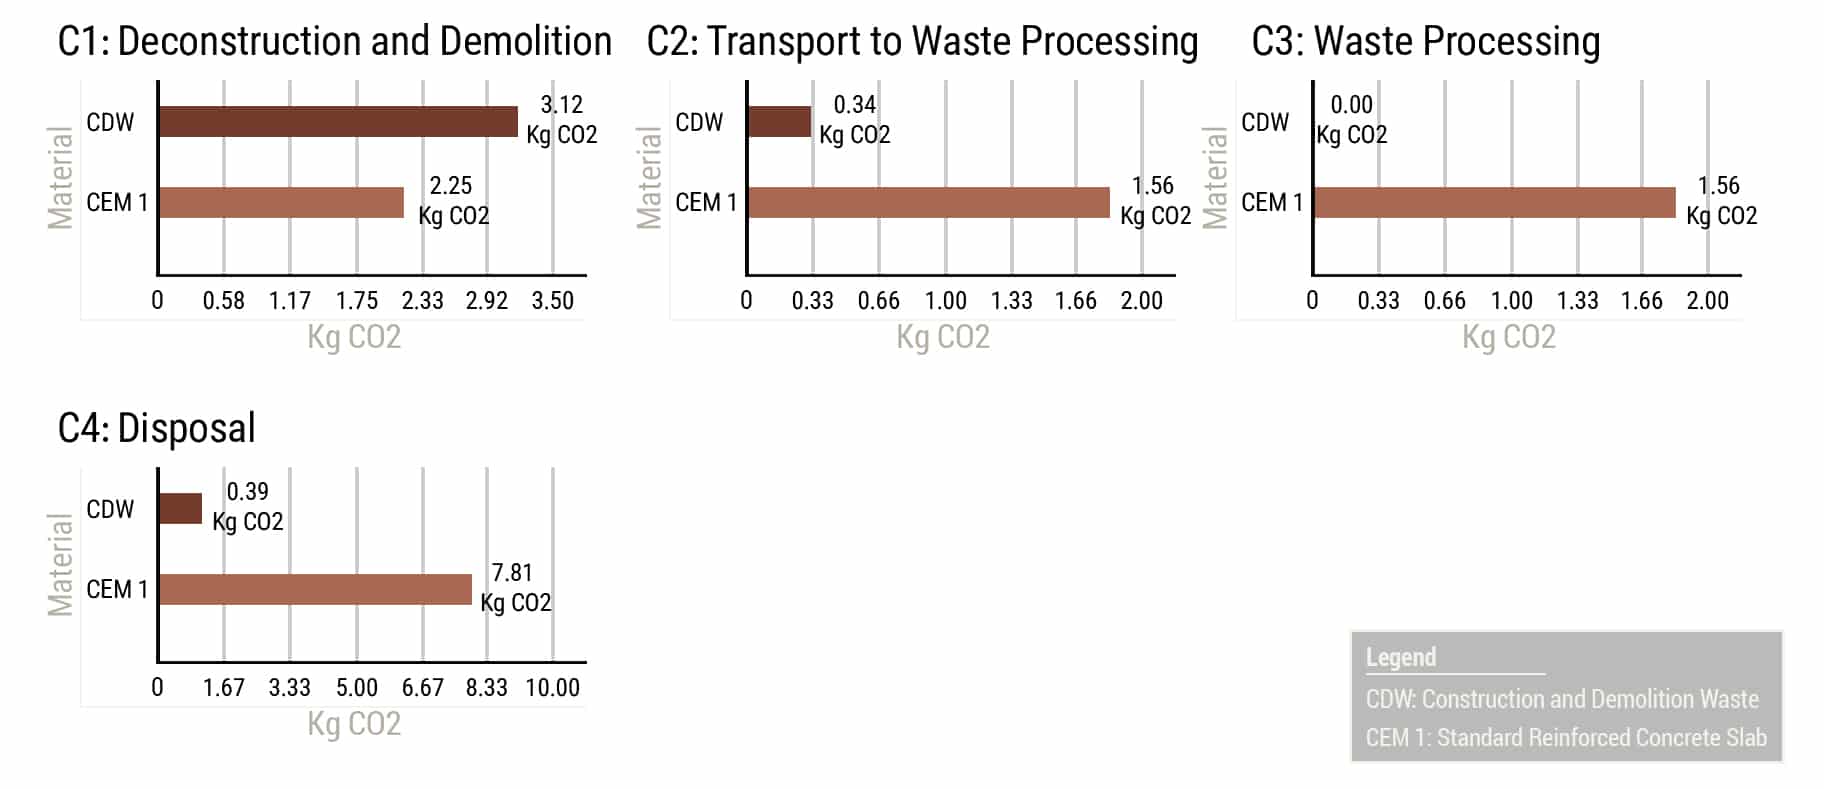
Barcelona Upstream and Downstream Flows
The end-of-life phase reveals a strategic shift in carbon intensity. Although the CDW slab shows slightly higher emissions during Deconstruction (C1)—due to the additional effort required to recover and sort materials—it achieves massive savings in Processing and Disposal (C3–C4). By designing for circularity, the CDW system avoids the intensive industrial processing and high landfill-related emissions typical of conventional concrete, effectively turning potential waste back into a secondary resource.
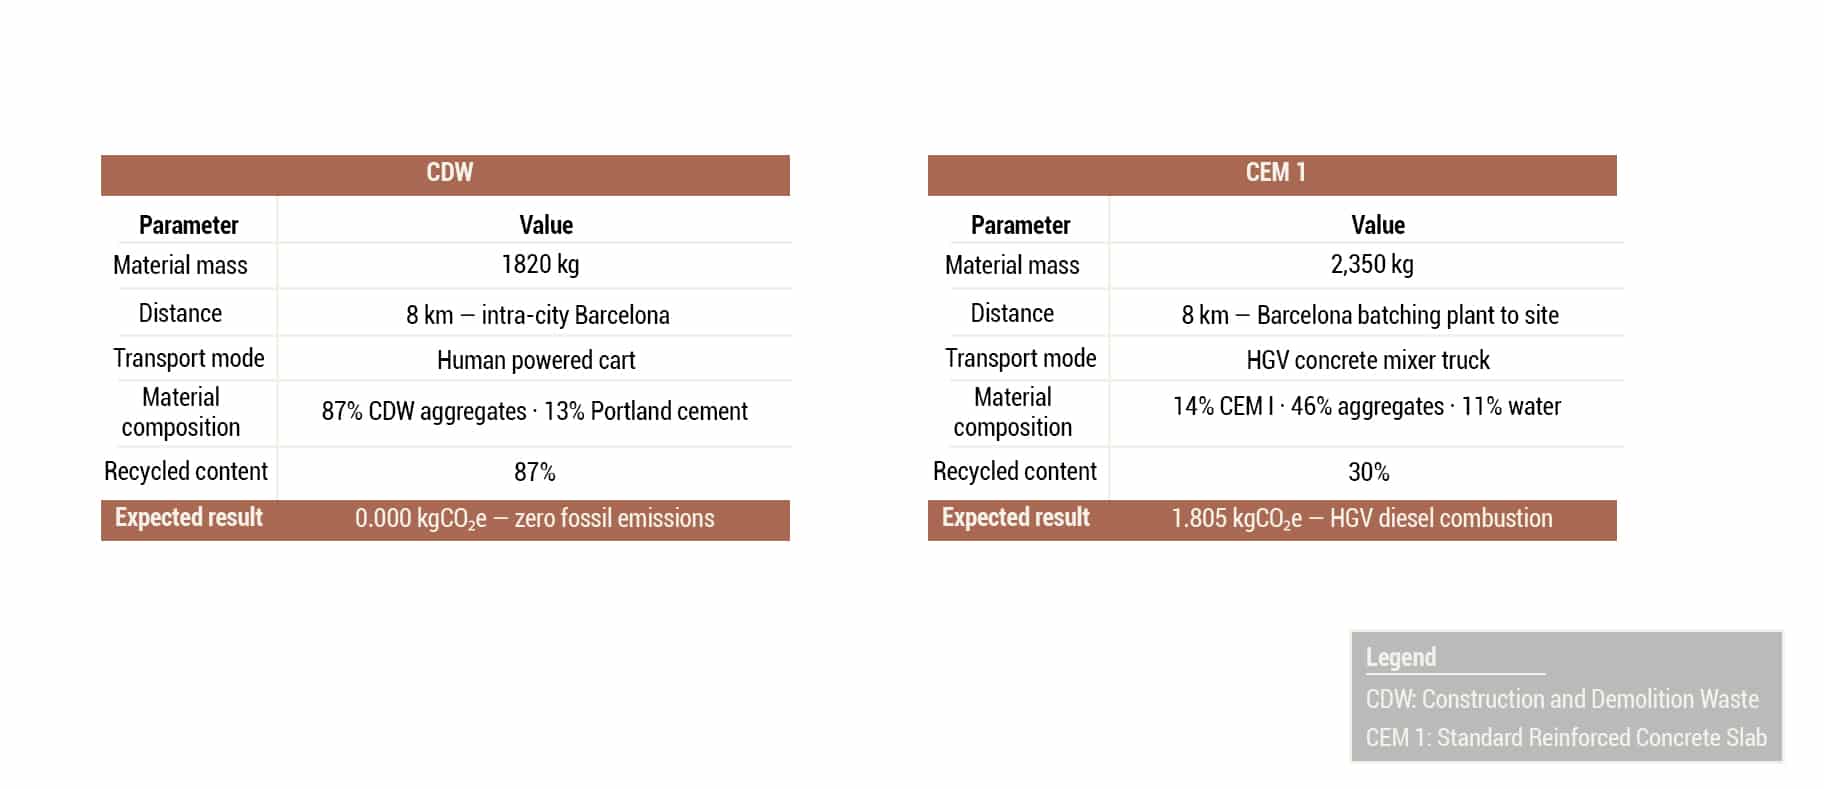
Transport to Waste Processing fossil emission parameters
This comparison highlights the “hidden” driver of transport emissions: the mode of movement. While the distances traveled are similar (8 km), the CDW model utilizes human-powered carts for intra-city transit, resulting in effectively zero fossil emissions. In contrast, the conventional slab relies on HGV concrete mixer trucks and diesel combustion. This data proves that even within the same urban radius, the transition from mechanized to non-mechanized logistics is a key factor in achieving a carbon-neutral supply chain.
Systemic Impact Validation
D Category: Beyond the System Boundary
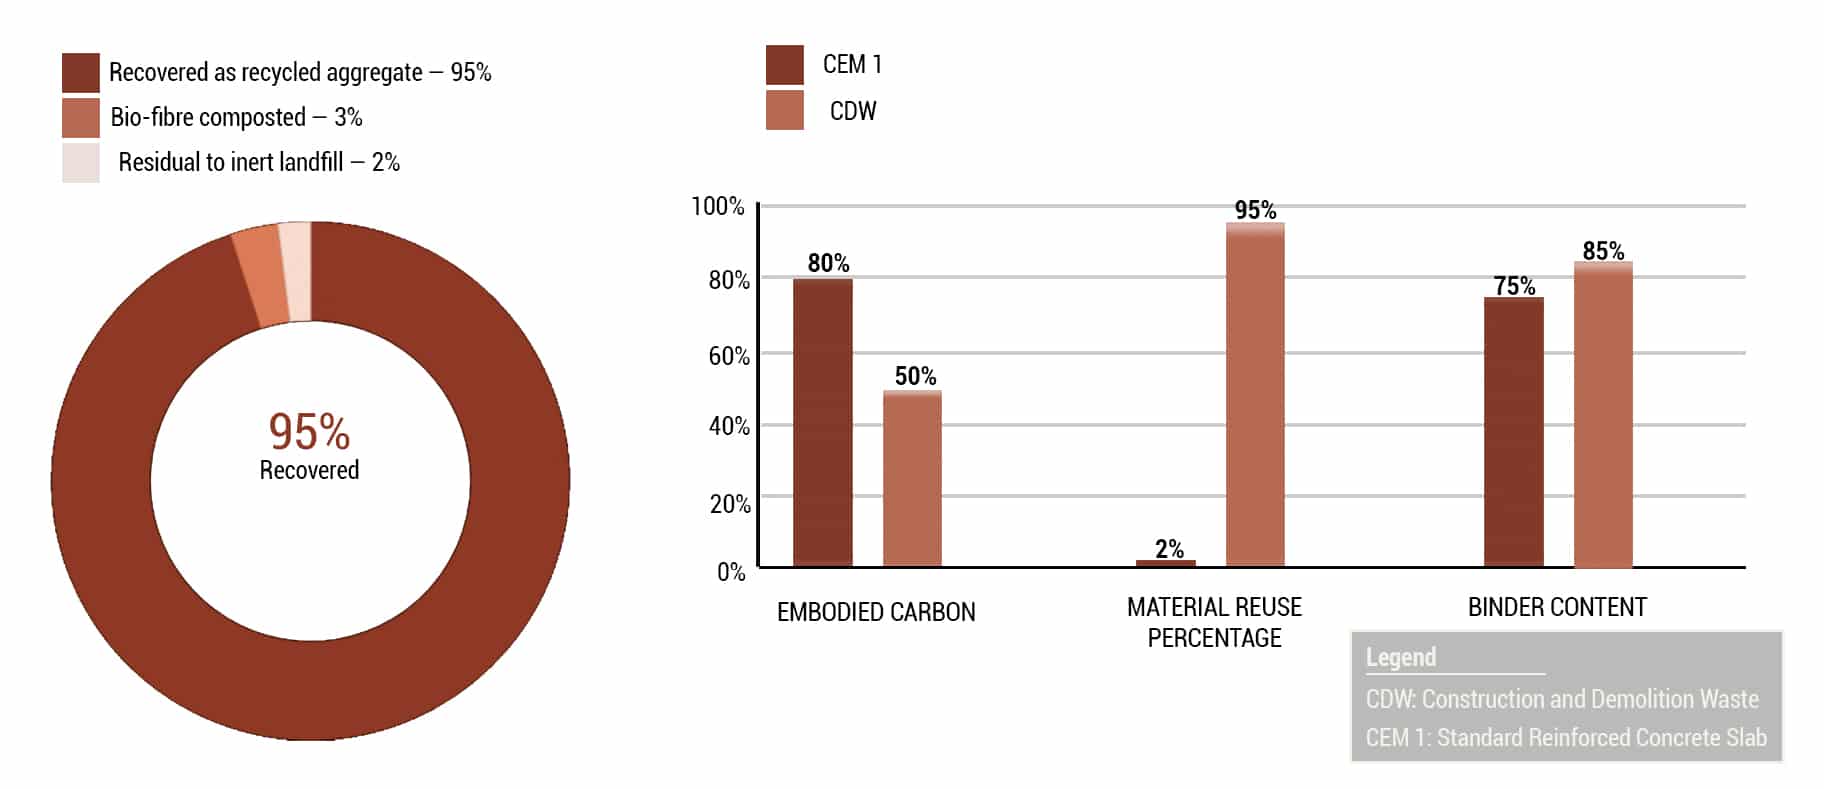
To validate the systemic impact of these materials, we look beyond the immediate project boundary to evaluate recovery potential. The CDW system achieves a remarkable 95% material recovery rate, with the vast majority of the slab being diverted from landfills to be reused as aggregate. When compared to the linear model of conventional concrete, the CDW approach demonstrates lower embodied carbon and higher binder efficiency, confirming that treating carbon as a managed asset through circular flows significantly improves overall environmental performance.
Next Steps
Scaling the System
Industrial Scalability
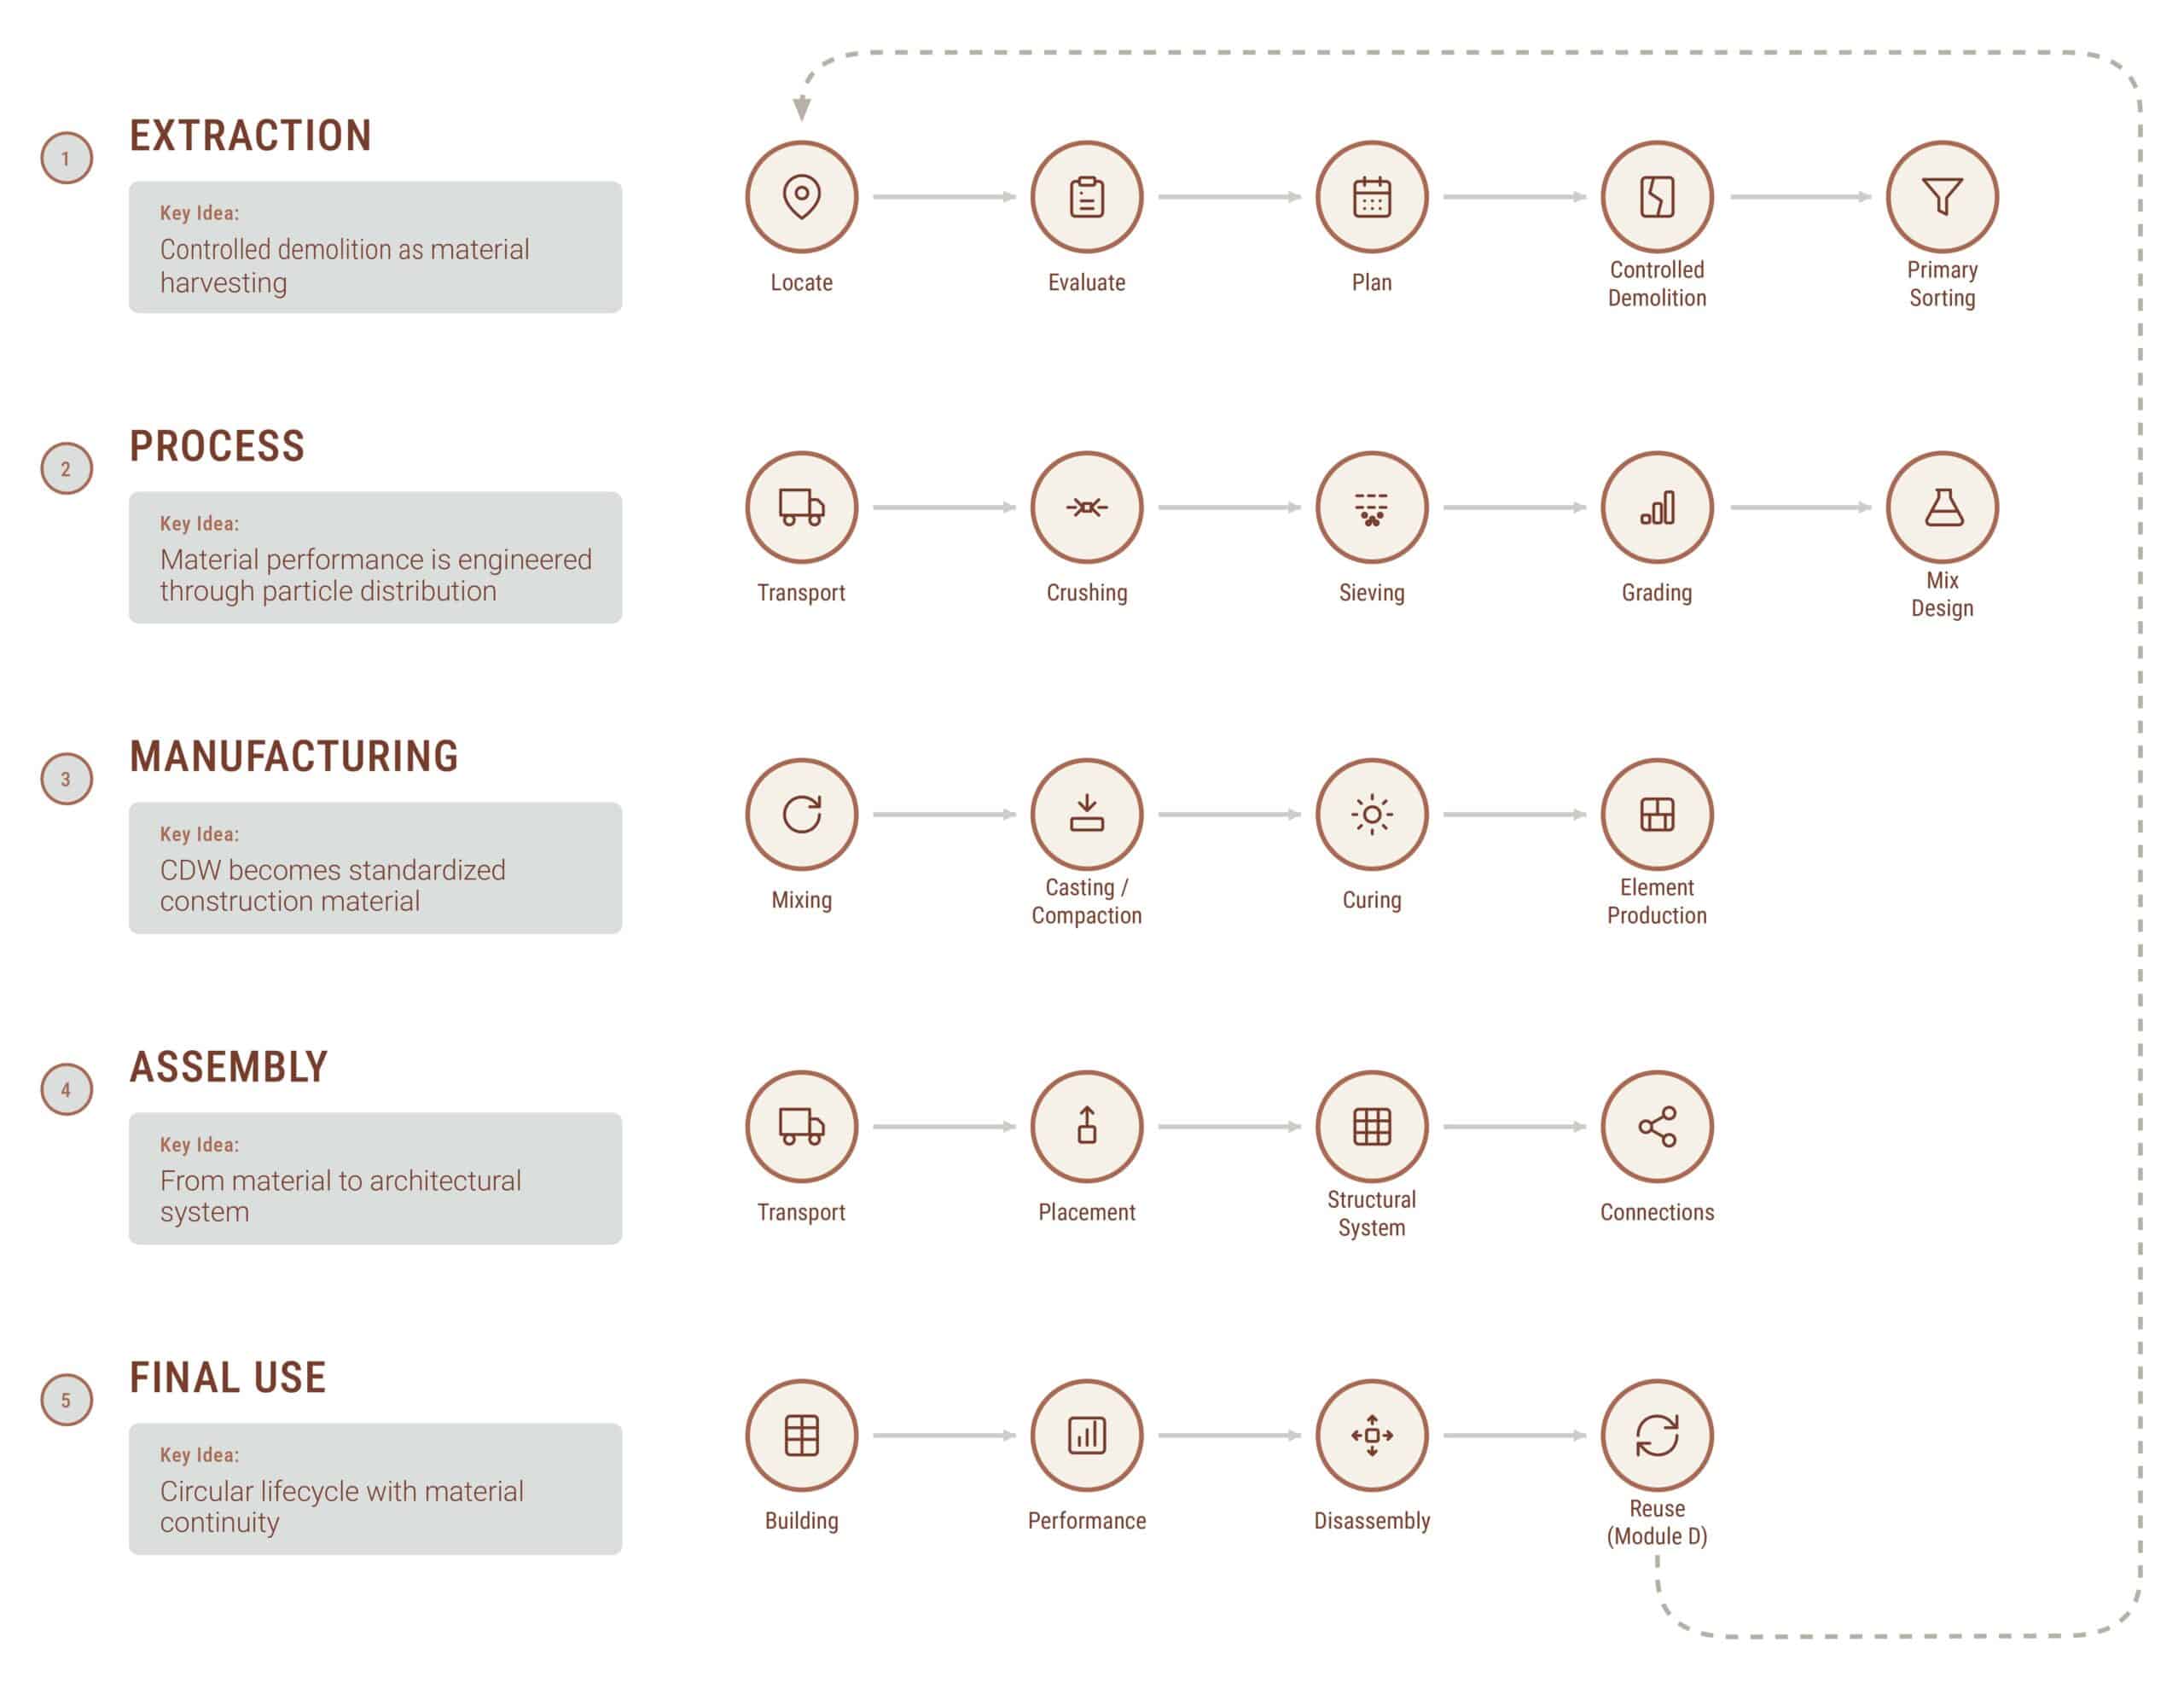
The project expands into a full lifecycle framework structured across five stages: extraction, processing, manufacturing, assembly, and final use. CDW is redefined as a continuously circulating material resource rather than waste.
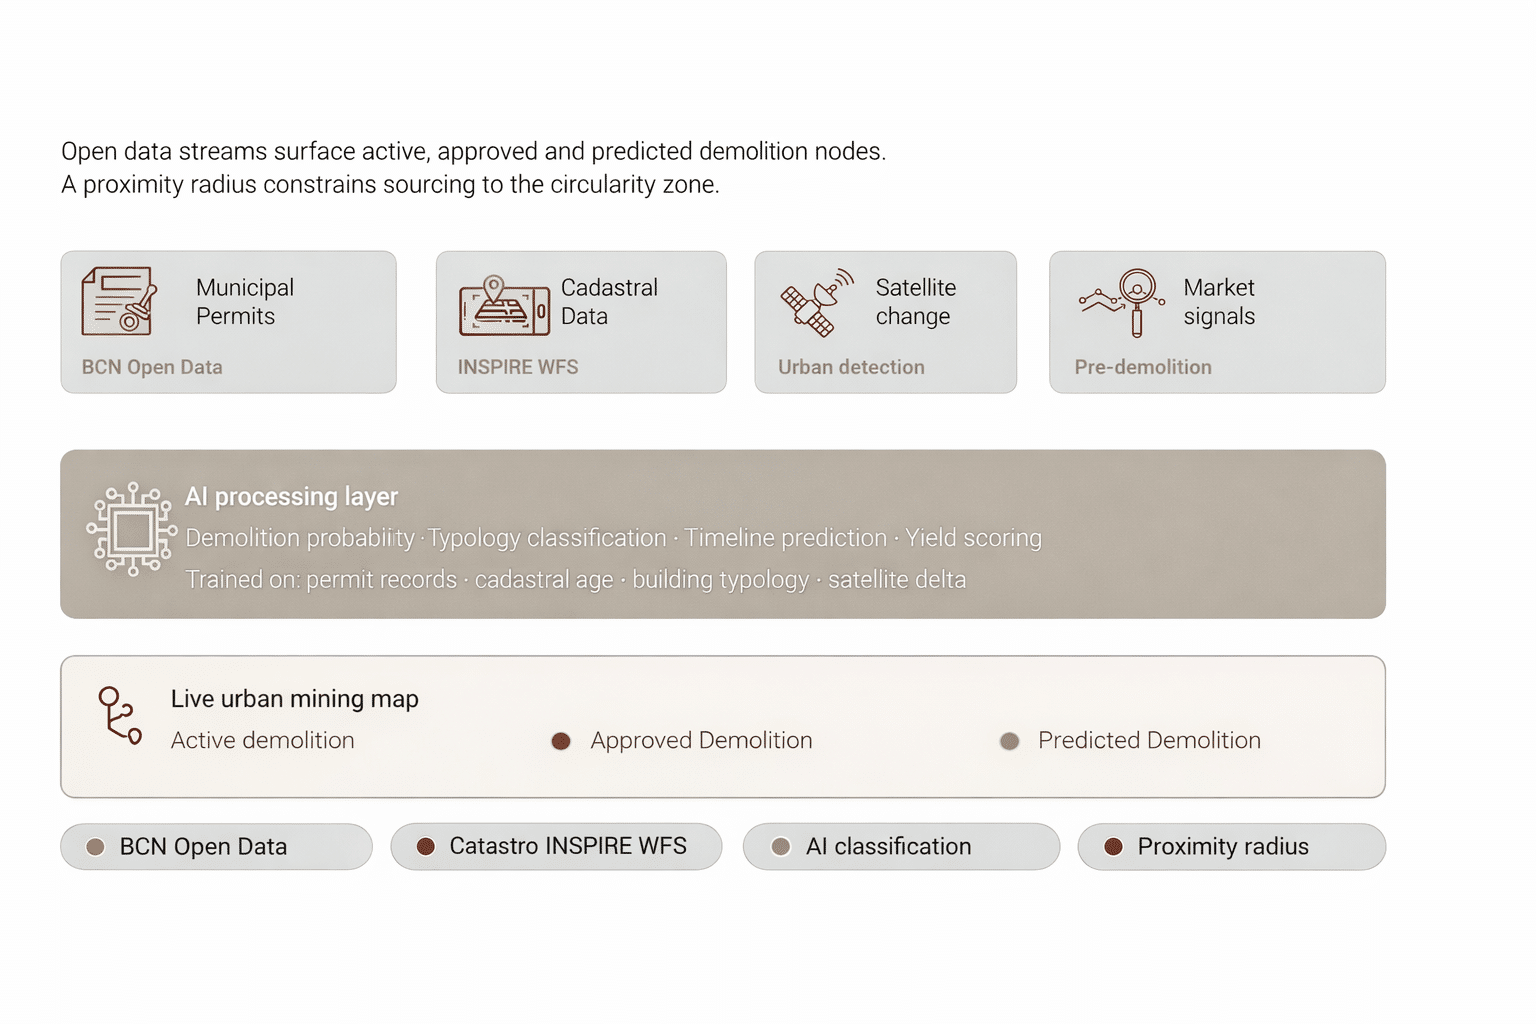
Step 1: Data-Informed Sourcing
Detect and Locate
Material sourcing begins with identifying demolition sites using open data, satellite inputs, and permit records. This establishes a data-driven urban mining system, constrained by proximity to enable local reuse.
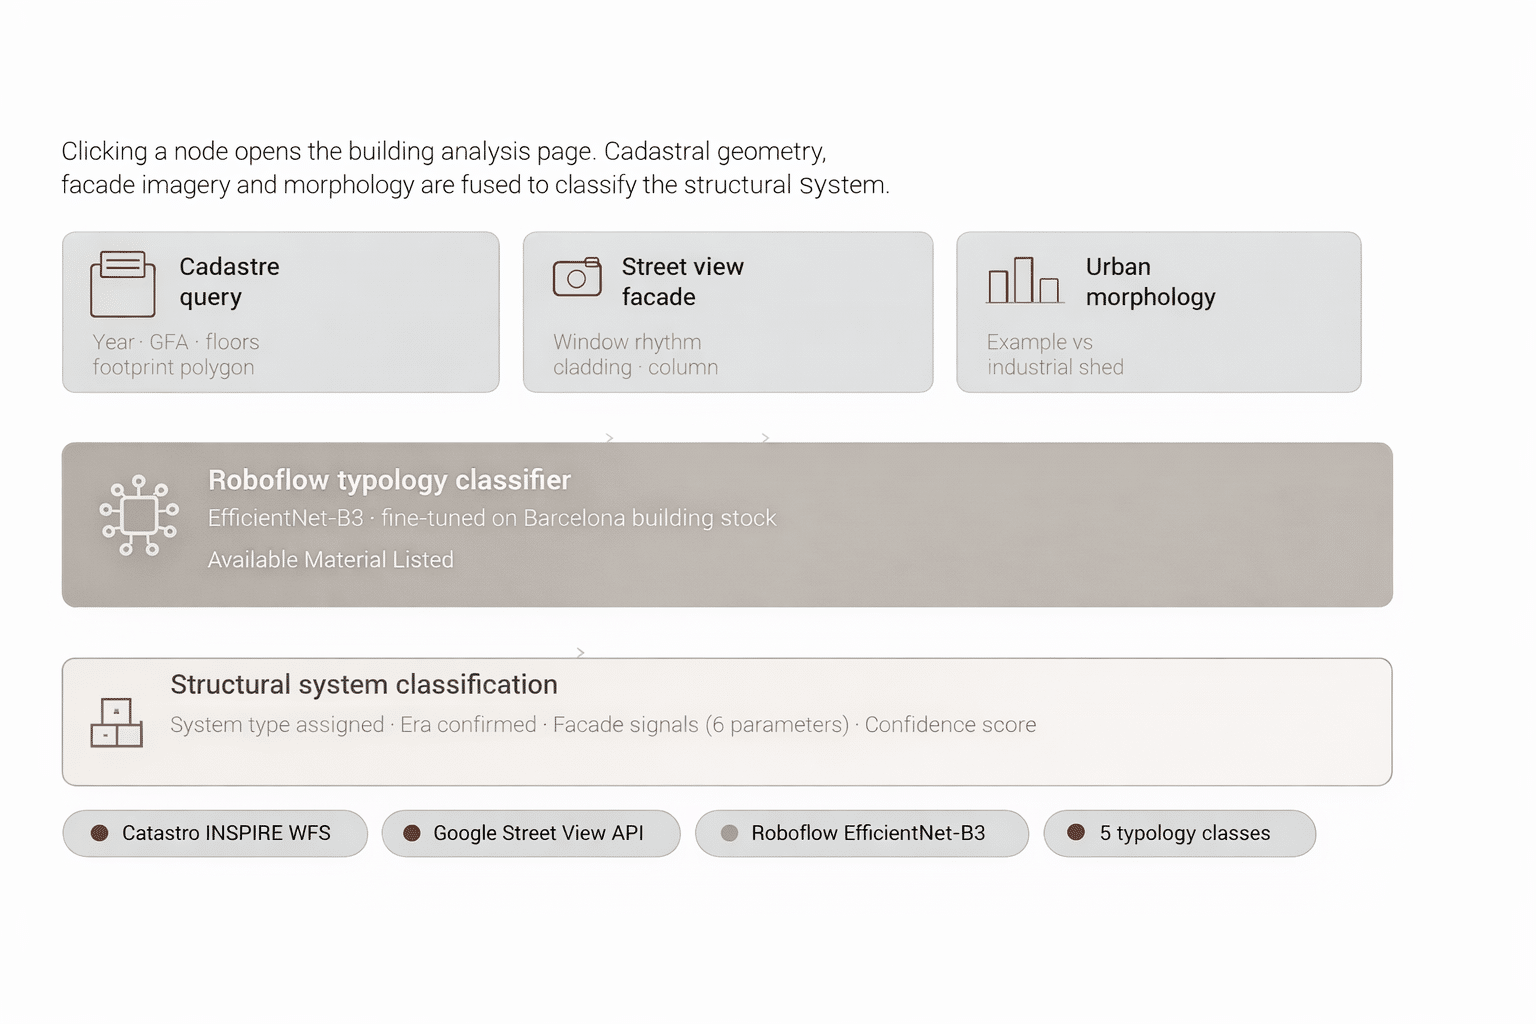
Step 1: Data-Informed Sourcing
Analyse Building
Each building is analyzed to estimate material composition and structural typology. Cadastral data, street imagery, and AI-based classification enable prediction of recoverable material quantities.
Step 1: Data-Informed Sourcing
Interface
This workflow is integrated into a digital platform that connects sourcing, analysis, and material planning. It enables informed decision-making at an urban scale, linking demolition to construction demand.
Step 2: Material Design
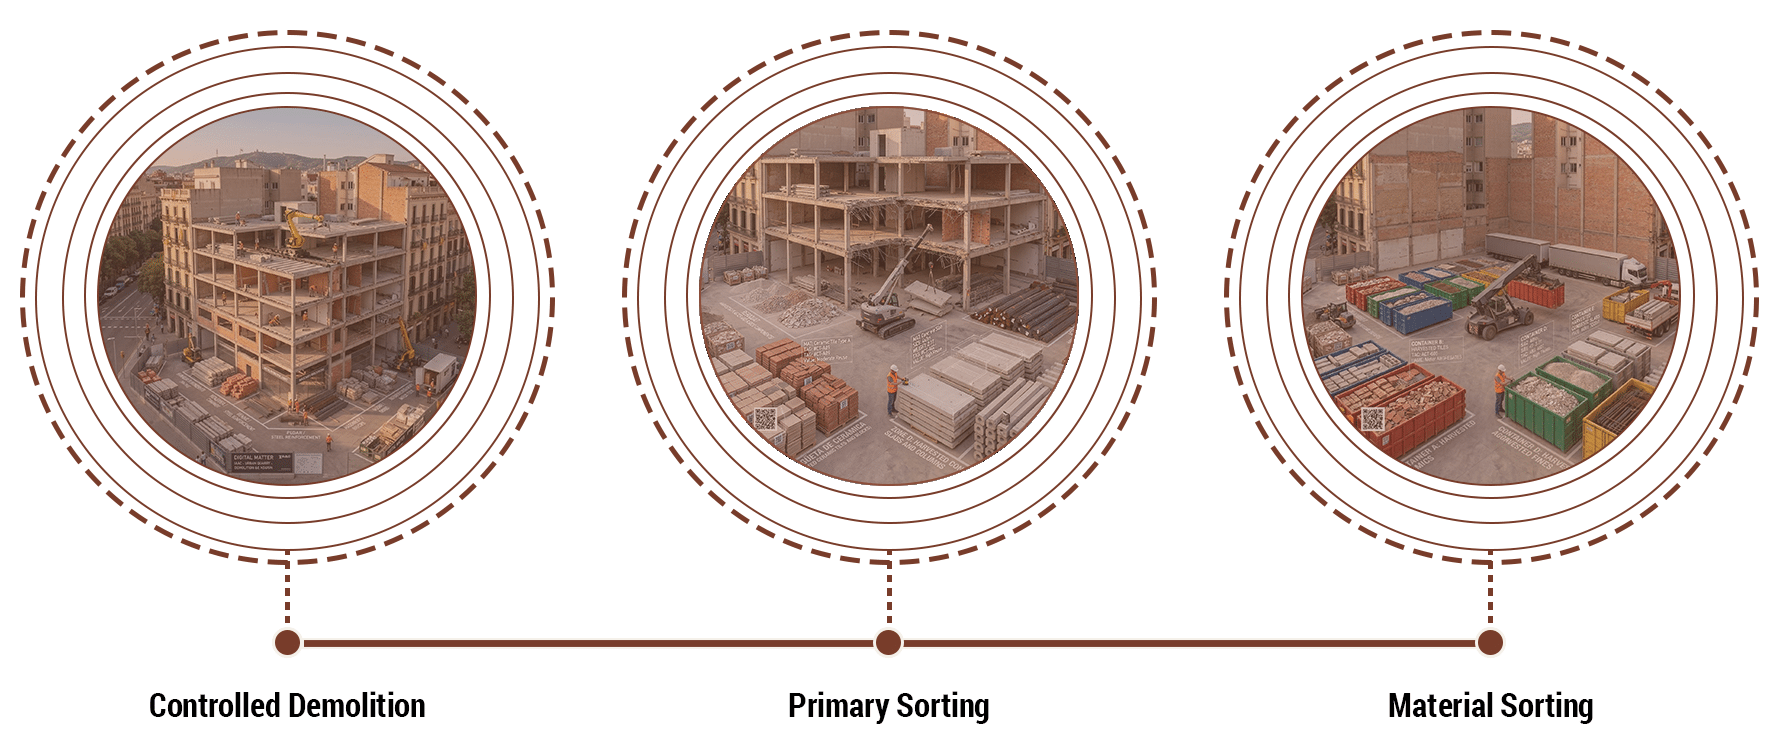
Controlled Demolition and Sorting
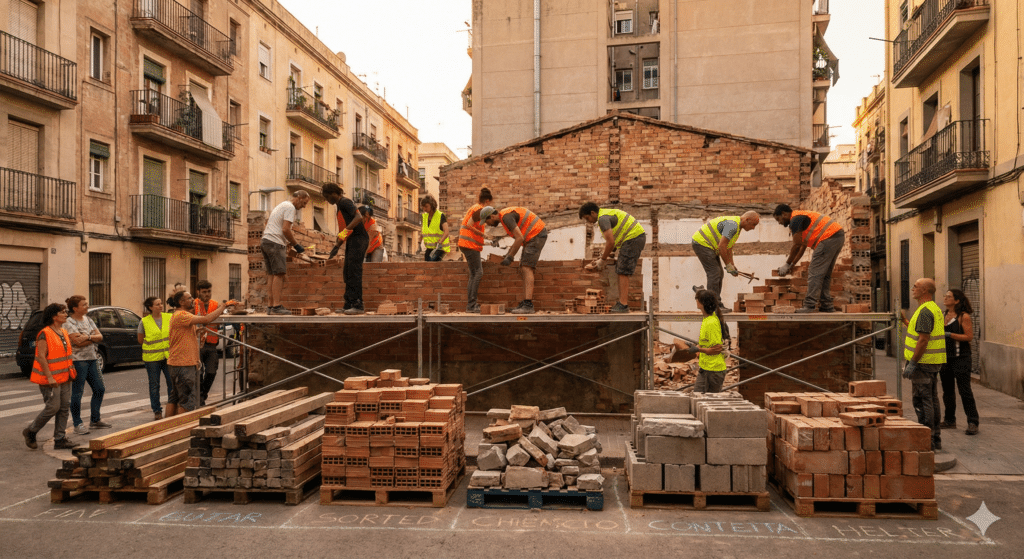
Demolition is reframed as a controlled extraction process. Materials are separated at source through primary sorting and further refined into categorized streams for processing.
Step 2: Material Design
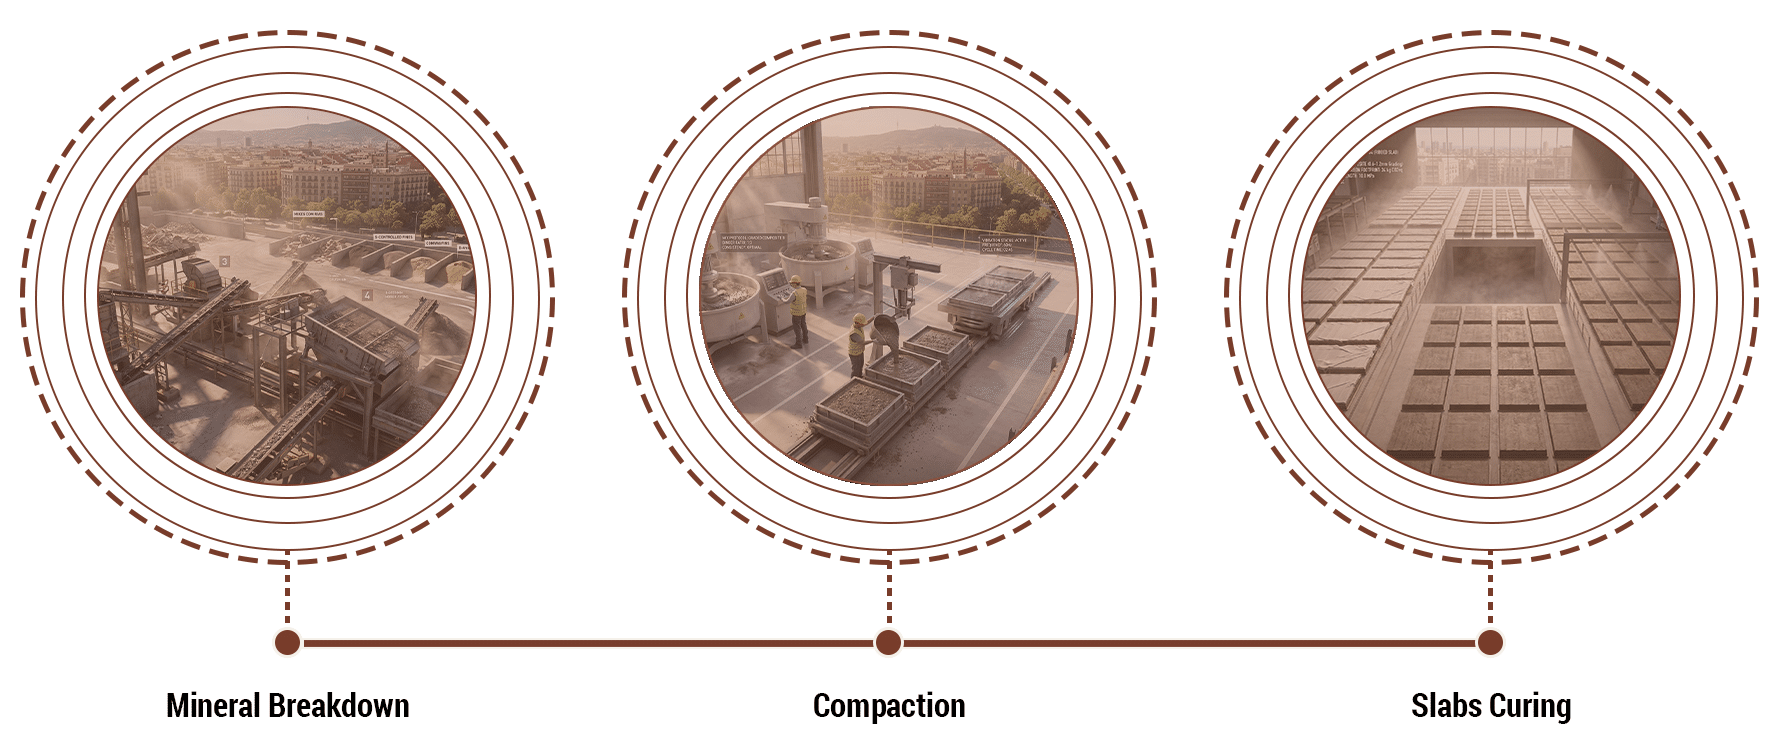
Mineral Breakdown Performance
Materials undergo crushing, grading, and controlled compaction. Performance is engineered through particle distribution, followed by casting and curing into structural components.
Step 3: System Design
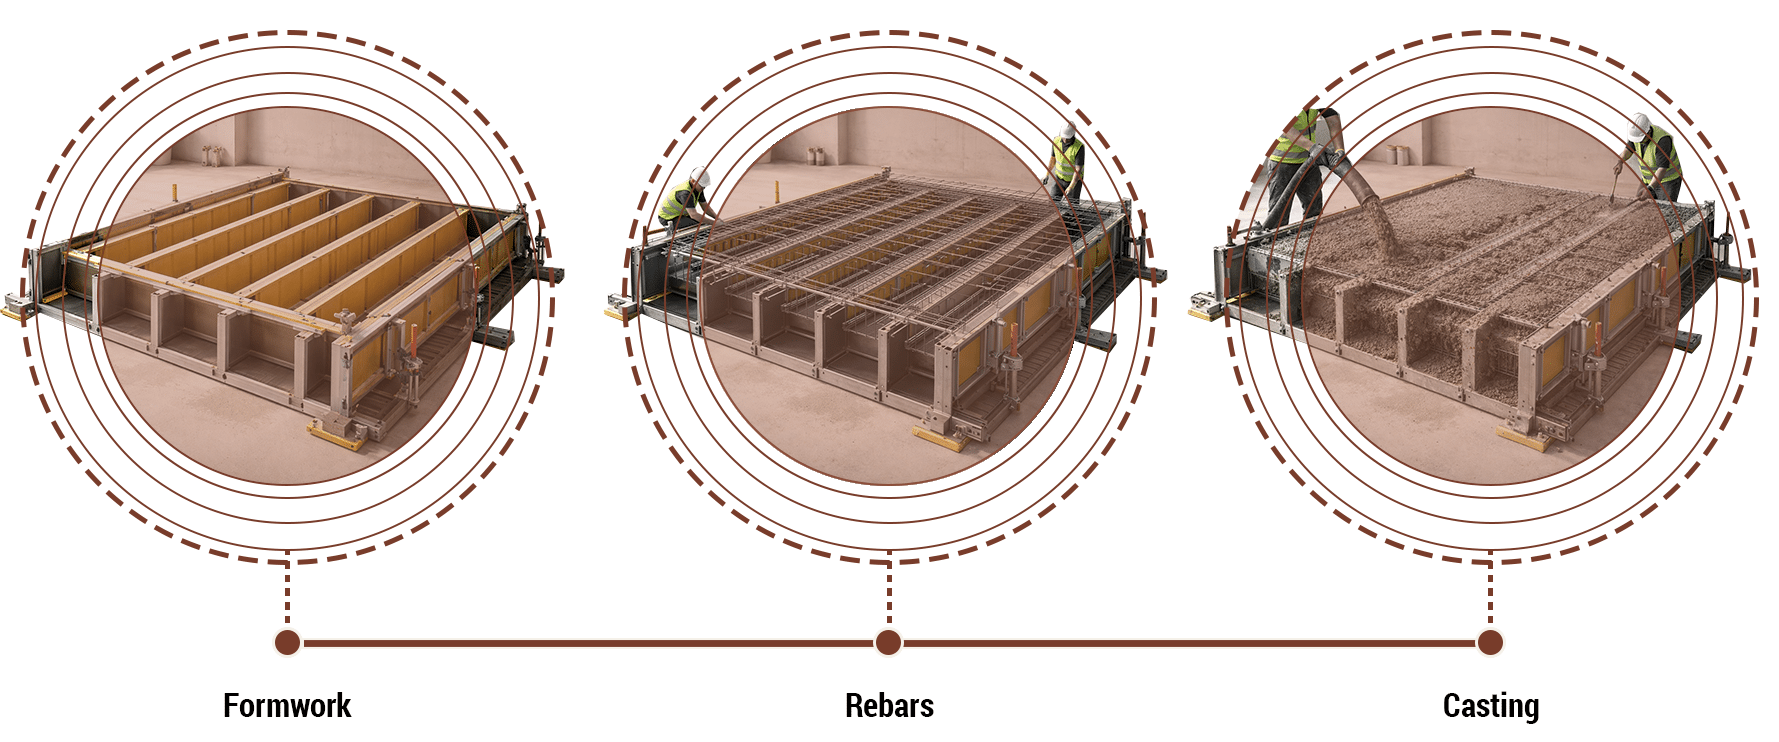
Manufacturing and Fabricating Systems
The system transitions into standardized production. Precast ribbed slabs are fabricated using reusable formwork, integrated reinforcement, and controlled casting techniques.
Step 4: Structural Logic
Assembly
Prefabricated elements are transported and assembled on site. The system relies on dry connections, geometric interlocks, and mechanical joinery, enabling efficient construction and future disassembly.
Step 5: Final Output
AI Visualisations
The resulting system is both structural and circular, allowing materials to retain value across multiple lifecycles.
Video
