
In recent years, the built environment industry has been significantly affected, with the issue of adequate ventilation and indoor air quality (IAQ) rising to prominence. In order to ensure the safety of their occupants and the general public, buildings such as schools, restaurants, offices, and others are putting in a lot of effort to adjust to the shifting guidelines and regulations for occupants’ assurance and safety. Contaminant management strategies, occupant thermal comfort, and air quality all depend on ventilation. (Masoso & Grobler, 2010)
Recently concerns are increasing over the air quality inside buildings due to its effect on occupants’ health and comfort. The inside air quality is highly affected by the percentage of Co2 present in it. Co2 inside buildings as high level can cause nausea, dizziness, headaches, and fatigue to the people working in those spaces (Norbäck et al., 2016). The CO2 from occupants varies with occupant activity levels and is a pollutant that must be removed constantly and maintained within acceptable levels. To remain as an acceptable level of Co2 inside a space, Co2 simulation with feedback devices can help alert people of the unseen threat they live in (Wargocki & Da Silva, 2012; Toftum et al., 2016; Geelan et al., 2018). CO2 simulation helps detect the level of Co2 to then apply a solution to decrease the percentage of Co2 in the air and improve the air quality. (Geelan et al., 2018) Below are some solutions that can help in decreasing the Co2 level:
- CO2 monitoring machine and natural ventilation
- Computational Fluid Dynamics (CFD).
- Responsive openings to the level of CO2 in the air.
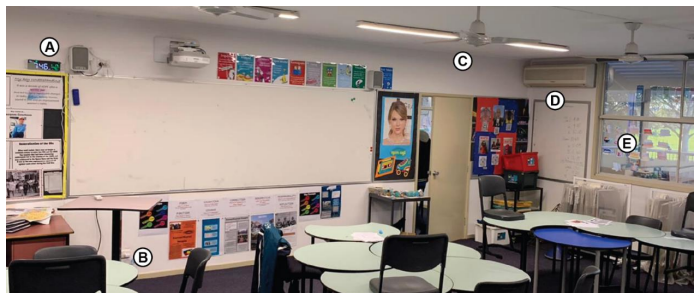
This article discusses Studying the behavior of people. The field study was conducted in a naturally ventilated school building. The purpose of which was to test the effect of CO2 education and CO2 feedback devices on the occupants’ natural ventilation behavior. The field study was carried out at Cornish College in the suburbs of Melbourne, Australia. The study included measurements of CO2 levels in five classrooms named R26, R27, R28, R29, and R31, each with about 60m2 of floor area. All classrooms were naturally ventilated with between 3 to 11 operable windows and 1 or 2 doors; all rooms except R31 were equipped with a split-system, remote-controlled air-conditioner; all rooms except R28 had 2 to 3 ceiling fans (see Figure 1). There were about 18 to 25 students aged 13 to 15 in each classroom. The school hours were 9 a.m. to 3:35 p.m. Mondays to Fridays. (Yu,Farrant and Marschall, 2022, Page 2).
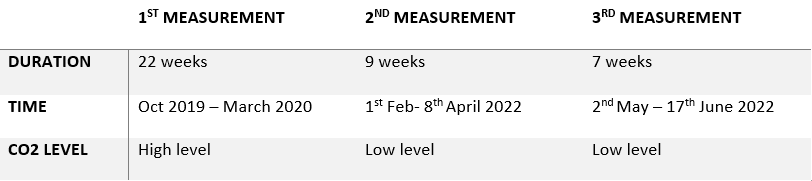
The study included three measurement periods with two interventions in between (see table 1). After the first measurement and the Victoria’s lengthy COVID lockdowns, the schoolteachers were informed by the about the poor IAQ that resulted from the first measurement and were asked to increase ventilation by opening the windows and doors more often. Also, the state’s Department of Education and Training had put out “COVID Safe” guides to reduce the risk of COVID-19 transmission, that included a call to operate windows and doors more frequently to increase ventilation. (Yu,Farrant and Marschall, 2022, Page 2-3)
Additional measurements were taken after the first measurement, in the other two separate measurement periods. In between these two periods we created a second intervention in which we installed CO2 feedback devices in the classrooms. This intervention is referred to as “Feedback” by us. This included an orientation session to the school’s teachers and students about the significance of adequate CO2 levels as a predictor of COVID transmission and how to interpret the devices’ feedback. (Yu,Farrant and Marschall, 2022, Page 3)
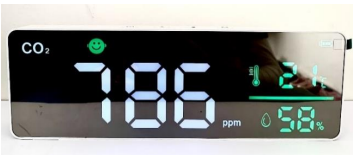
Figure 3 shows the CO2 feedback devices utilized in this study. In each classroom, they were mounted above the whiteboards. Each device has a CO2 sensor with a range of 400 – 5,000 ppm, a relative humidity sensor, and an internal temperature sensor. The instruments show the measured values with big numbers that change every 1.5 seconds. The presentation likewise incorporates an emoji that changes its look and variety relying upon the ongoing CO2 level. In addition, posters about the feedback devices were hung in each classroom following their installation. (Yu,Farrant and Marschall, 2022, Page 3).
Results:
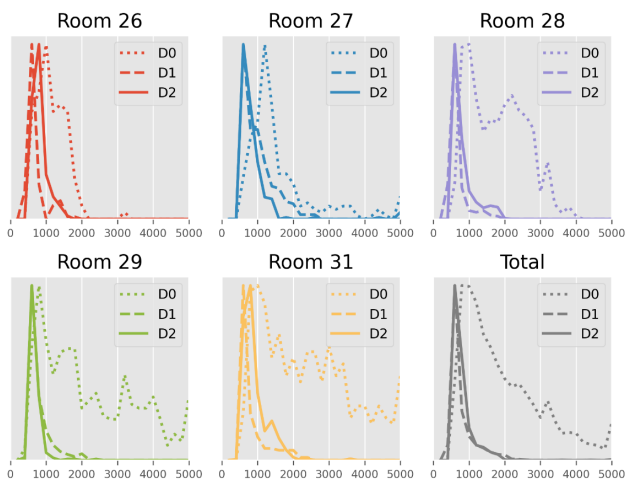
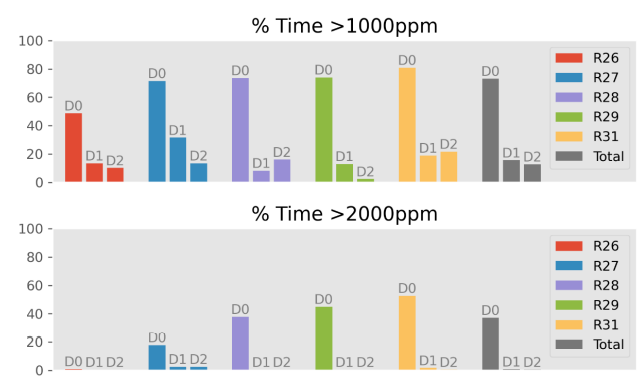
Figure 4 shows histograms of CO2 levels for each classroom and each dataset; Figure 5 shows the percentages of occupied hours where each classroom exceeded 1,000 ppm and 2,000 ppm, for each dataset.(Yu,Farrant and Marschall, 2022, Page 5)
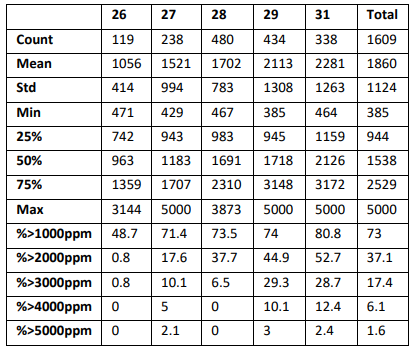
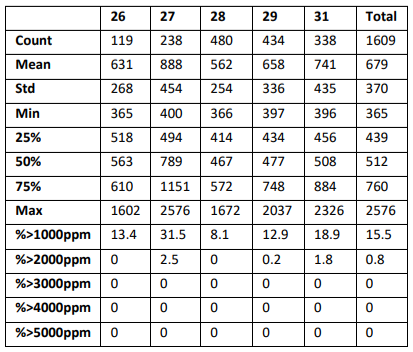
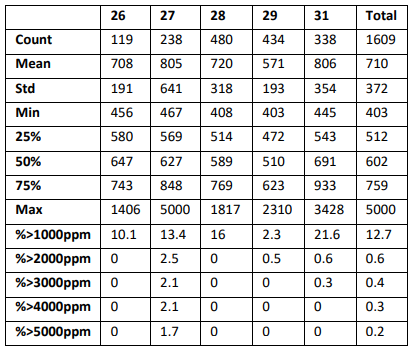
Table 2-4 shows the results in tabulated form. The first measurement period, the indoor CO2 levels across all monitored classrooms exceeded the recommended ASHRAE threshold of 1,000 ppm 73% of the occupied period; they exceeded 2,000 ppm 37% of the time, 3,000 ppm 17% of the time, and 5,000 ppm 2% of the time.The CO2 concentration levels in the five classrooms varied with mean values ranging from 1,056 ppm for R26 to 2,281 ppm for R31. In the second measurement, the first post-COVID lockdown dataset, the indoor CO2 levels across all analyzed classrooms exceeded 1,000 ppm 16% of the time. This is a 78% decrease relative to Dataset 0. CO2 levels now rarely exceeded 2,000 ppm and never exceeded 3,000 ppm. In the third measurement, the second post-COVID measurement during which the occupants received real-time visual feedback on the indoor CO2 levels, these now exceeded 1,000 ppm only 13% of the time. This is a further relative reduction of 19% compared to the previous second measurement, although R28 and R31 saw slight increases in CO2 levels. The values across all classrooms still rarely exceeded 2,000 ppm. (Yu,Farrant and Marschall, 2022, Page 4)
Conclusion
findings suggest that window users in Victoria schools have increased significantly as a result of COVID awareness. It too outlines that CO2 criticism gadgets are a compelling apparatus to additionally further develop window activity conduct. It suggests that school buildings in temperate climates can use natural ventilation as a sustainable operation method with education and real-time feedback.(Yu,Farrant and Marschall, 2022, Page 7)
Limitation of the study
- Volume: ceiling height were not considered
- Direction : will the direction and window location affect?
- Data Collection Period: The comparison should have been on the same months
- DATA 0: 5 months DATA 1: 2 Months DATA 2: 2 Months
References
Farrant, T., Yu, C. and Marschall, M.G. (n.d.). IMPACTS OF COVIDSAFE PRACTICES AND CO2 FEEDBACK DEVICES ON CO2 LEVELS IN CLASSROOMS. In: 26th International Clean Air and Environmental Conference. CLEAN AIR CONFERENCE ‘CASANZ22’. Australia: CASANZ (Clean Air Society of Australia and New Zealand).
Geelen, L.M.J., Huijbregts, M.A.J., Ragas, A.M.J., Bretveld, R.W., Jans, H.W.A., vandoorn, W.J., Evertz, S.J.C.J. and vanderzijden, A., 2008. Comparing the effectiveness of interventions to improve ventilation behavior in primary schools. Indoor Air, 18(5), p.416.
Masoso, O.T. and Grobler, L.J., 2010. The dark side of occupants’ behaviour on building energy use. Energy and buildings, 42(2), pp.173-177.
Norbäck, D., Hashim, J.H., Cai, G.H., Hashim, Z., Ali,F., Bloom, E. and Larsson, L., 2016. Rhinitis, ocular, throat and dermal symptoms, headache and tiredness among students in schools from Johor Bahru, Malaysia: associations with fungal DNA and mycotoxins in classroom dust. PLoS One, 11(2), p.e0147996.
Wargocki, P. and Da Silva, N.A.F., 2012. Use of CO2 feedback as a retrofit solution for improving air quality in naturally ventilated classrooms. In 10th international conference on healthy buildings.
