
“Unraveling Urban Growth” is an application developed to analyze and quantify the effects of new constructions on the vibrancy and accessibility of city amenities within 5, 10, and 15-minute travel time ranges. The objective of this application is to facilitate informed decision-making for urban planners, policymakers, and community stakeholders by assessing the impact of new buildings on the vitality of urban ecosystems.
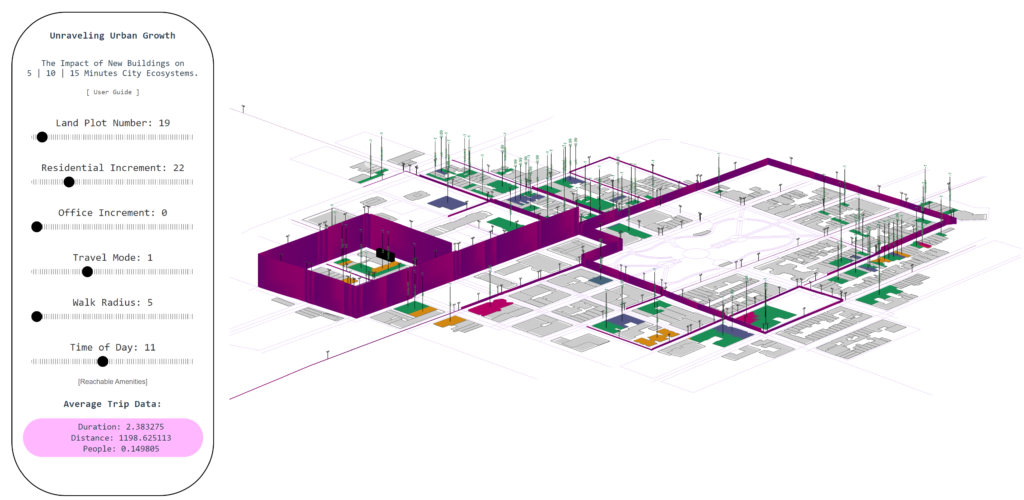
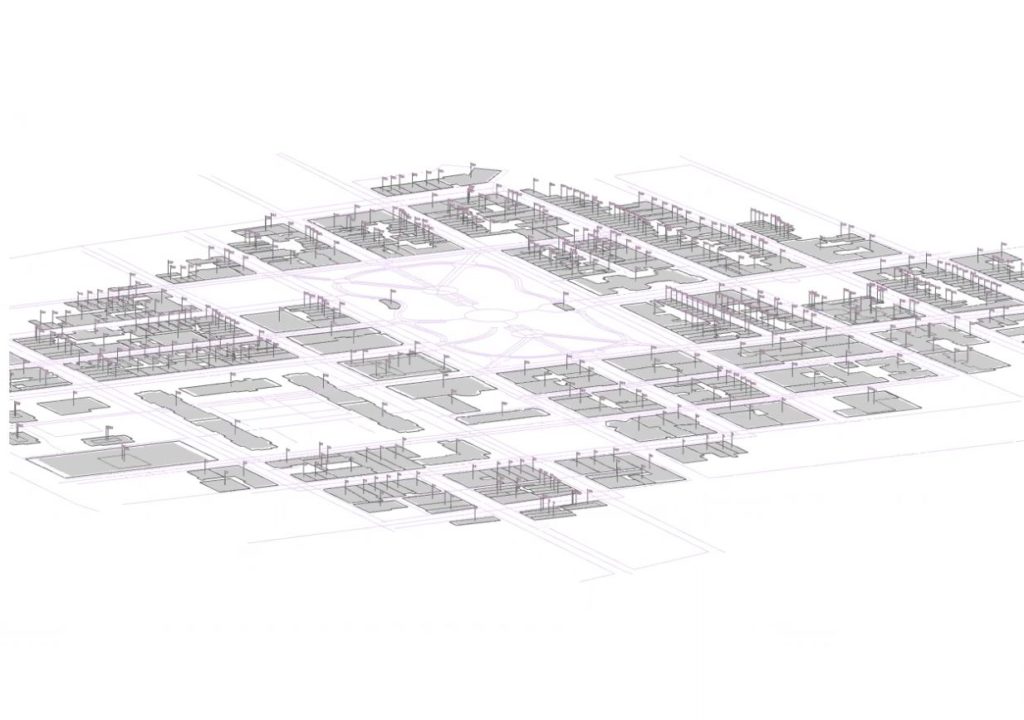
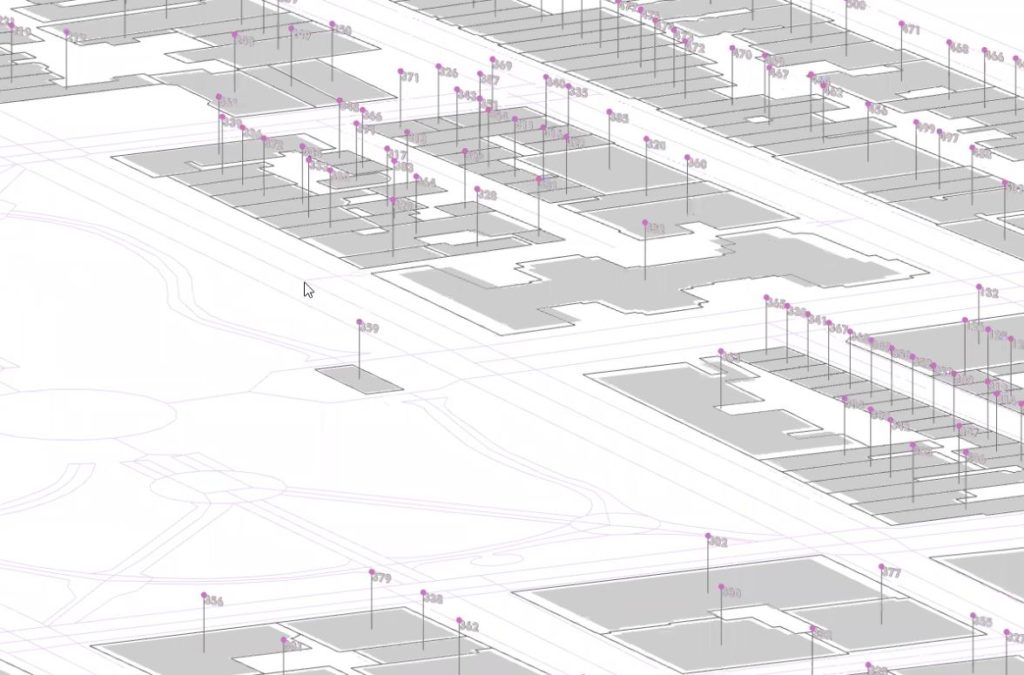
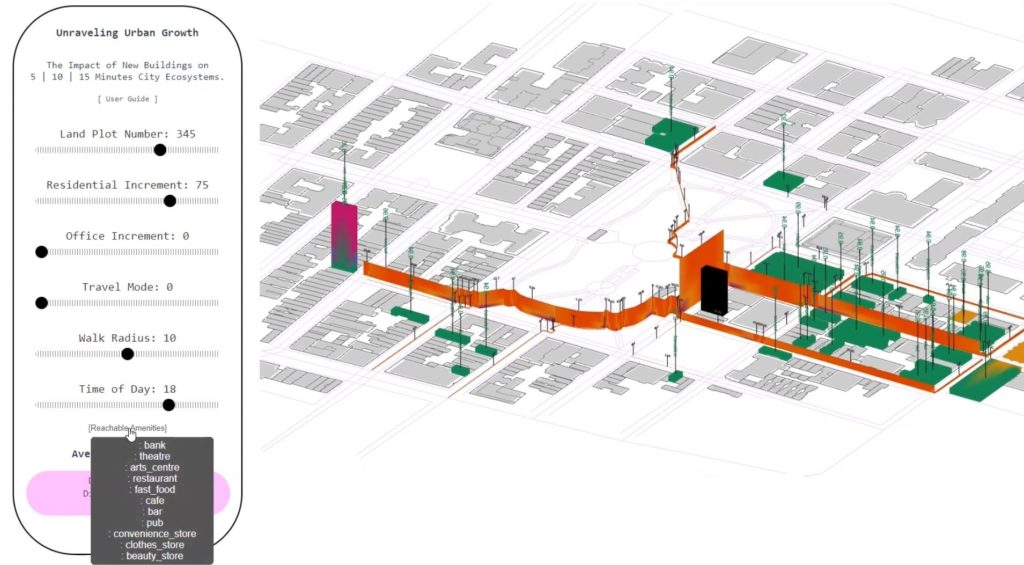
In the application, each land plot is uniquely numbered and can be visualized on the map.
Two core metrics are employed:
- Streetscore: A measure of street vibrancy that calculates Street Hits as the number of people using a street segment during trips, represented by an orange gradient.
- Amenityscore: Evaluates the balance between amenity supply and demand. Amenity Hits are counted as the total visitors to a specific amenity on all trips, compared to the available capacity. Different colors are used to represent different types of amenities.
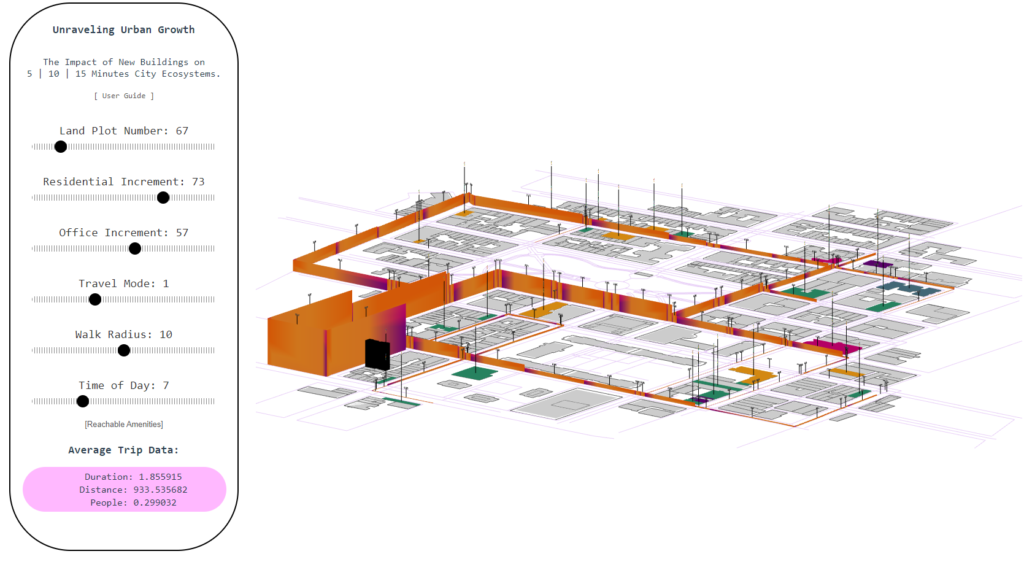
A user guide provides a short description of the necessary steps, while indicator numbers for buildings, amenities, or streets are updated accordingly. The heights of informed geometries change to indicate variations.
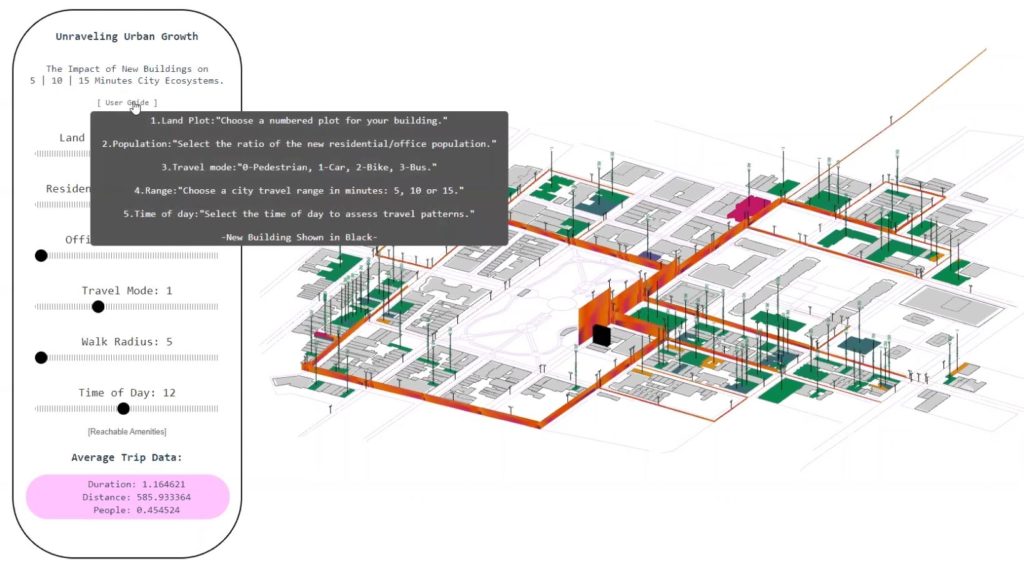
To use the application, users first select a numbered plot for their building, which is marked in black. Next, they choose a ratio of population increment for either a residential or office building. The building height increases as the ratio is adjusted, with surrounding geometries being informed accordingly.
Users can then select a travel mode (0 for pedestrian, 1 for car, 2 for bike, and 3 for bus) and a walk radius (in minutes) of 5, 10, or 15 minutes. The time of day slider allows for the visualization of fluctuations in amenity values throughout the day.
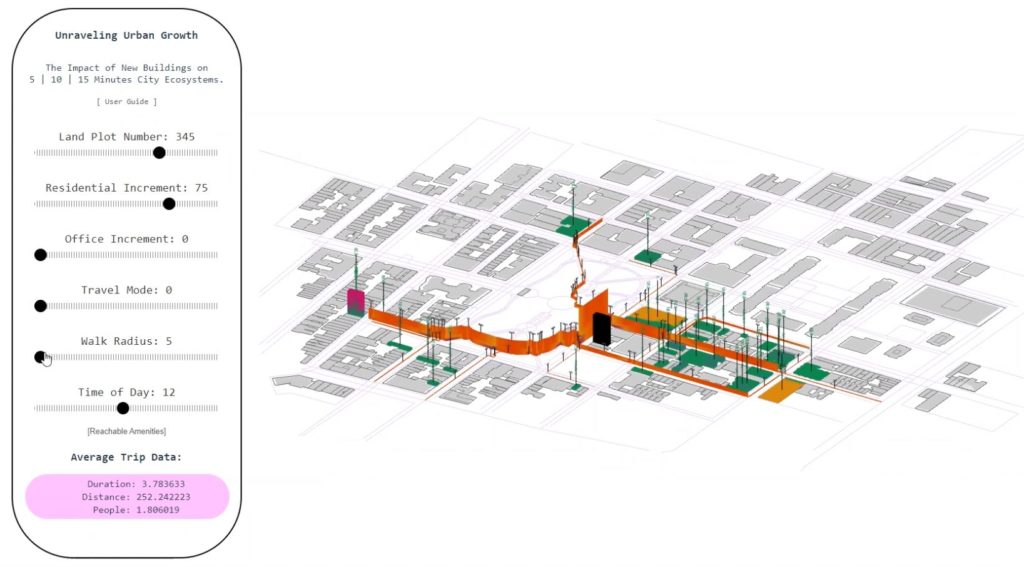
The application also provides a hoverable menu for visualizing the reached amenities metadata of the selected building. When zooming in on the map, the name of the building is displayed in 3D below the indicator. Average trip data, including duration, distance, and people, are available for the simulation.
Potential improvements to the application include incorporating a hover function for displaying land plot numbers and enabling users to change the OpenStreetMap (OSM) data file. These enhancements would enable a more comprehensive visualization of various parameter outcomes.
Preview:
