Climate of Barcelona
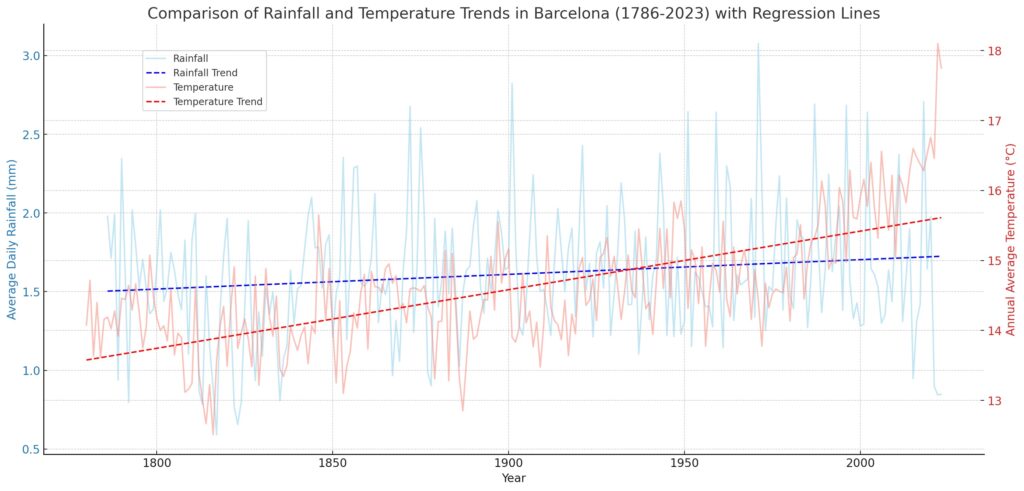
A long-term climatological analysis was conducted using historical weather data to identify and compare trends in rainfall and temperature over a period of more than two centuries. This type of study is valuable for understanding the local effects of climate change, observing weather pattern consistency or changes, and aiding in the development of models to predict future climatic conditions. It can also be critical for urban development planning, agricultural forecasting, water resource management, and environmental conservation efforts. The graph presents a visual comparison of rainfall and temperature trends in Barcelona from the years 1786 to 2023 using datasets retrieved from OpenDataBCN. The blue line represents daily rainfall, measured in millimeters, and the red line indicates the annual average temperature, measured in degrees Celsius. Both sets of data are accompanied by their respective regression lines: a dashed blue line for rainfall and a dashed red line for temperature, illustrating the long-term trends. The rainfall data show variability but no significant trend over time, while the temperature data exhibit a clear upward trend, indicating a rise in average temperatures over the 237-year period. This rise was accelerated after around 1970s.
Rainwater Catchment Potential
The assumptions regarding rainfall, as presented in the table, were derived from the average monthly rainfall data over the past ten years. By applying these figures to the total catchment area, we have calculated the potential water collection capacity.
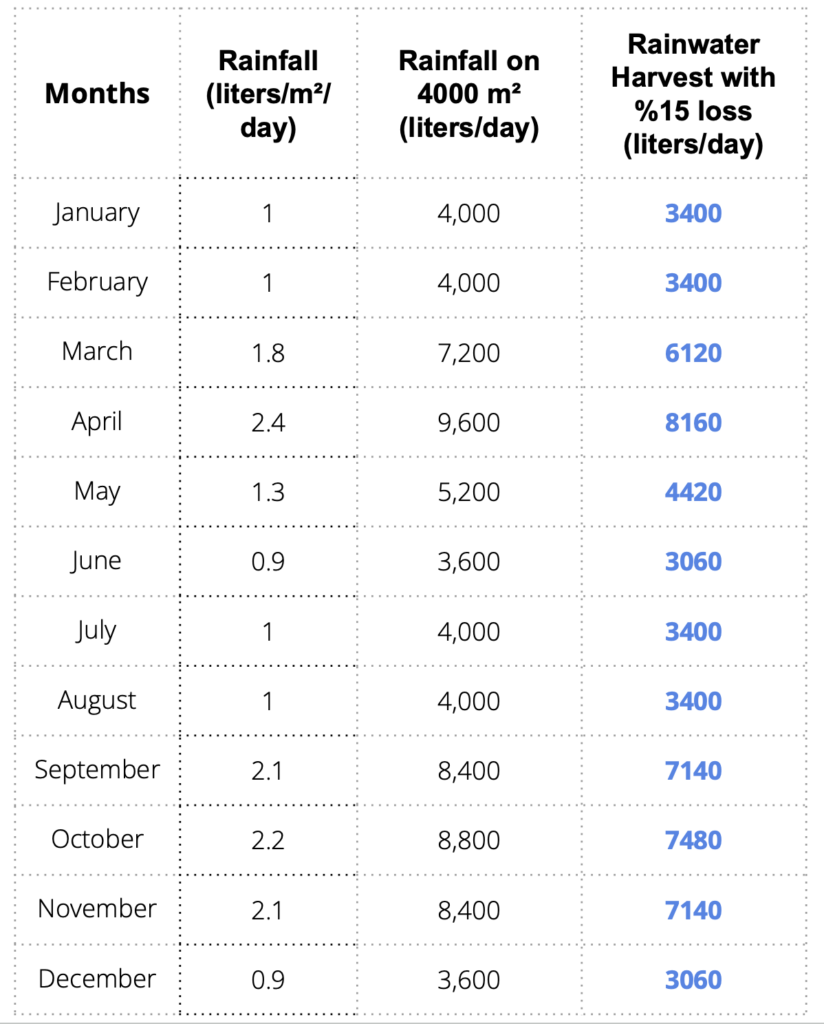
Total Catchment Area : 4000 m²
Avg. Rainfall : 1.5 liters/day
Avg. Potential Catchment : 6000 liters/day
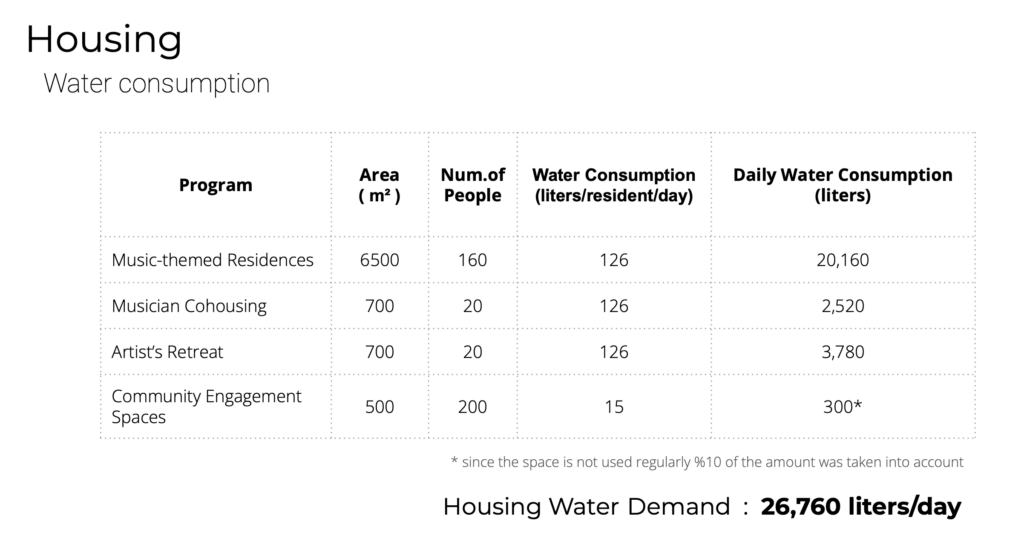
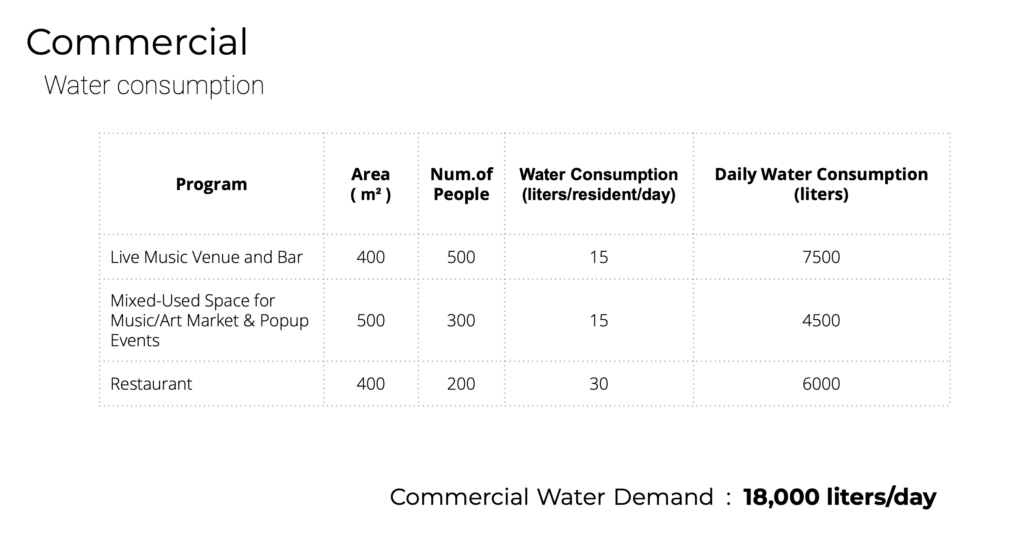
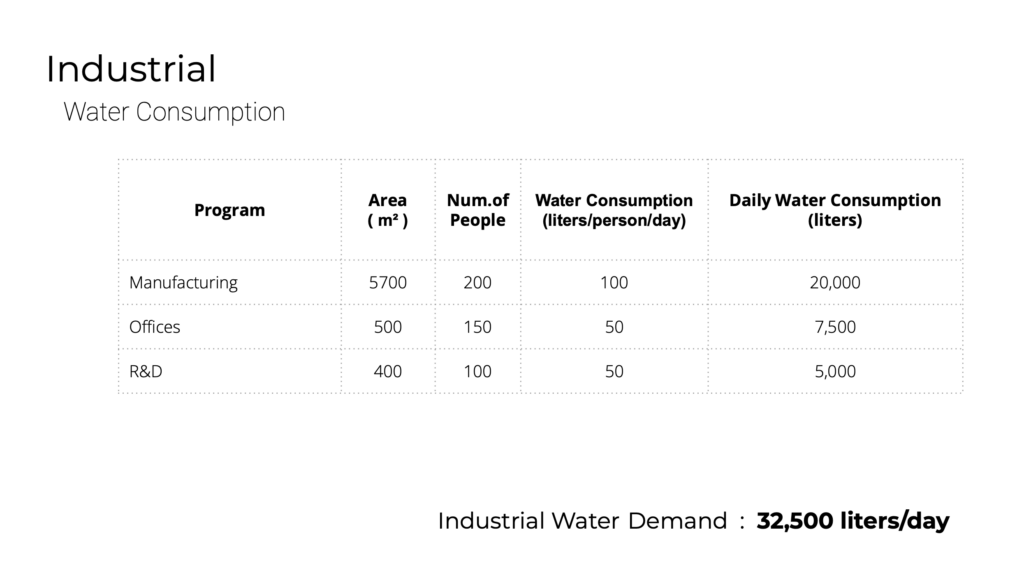
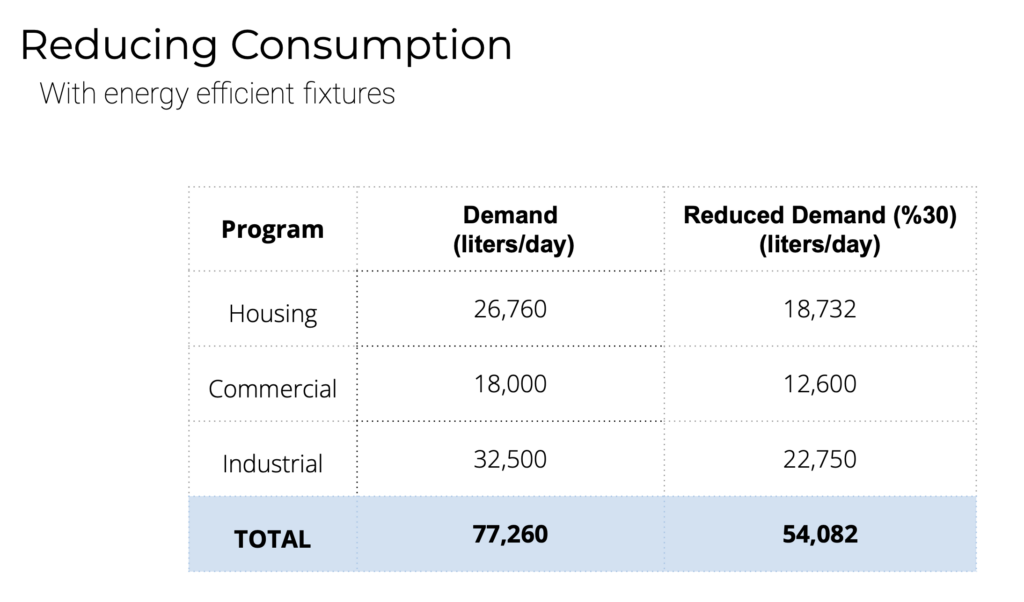
Water Demand
