The Backbone of Modernity – Since its invention in 1842, Portland cement has become a cornerstone of modern construction. Its role in shaping cities, infrastructure, and economies is unparalleled, but this comes at a cost. Cement production is energy-intensive, emits significant carbon dioxide, and has become a key driver of global greenhouse gas emissions
Cement Production and its Environmental Cost
The manufacturing of Portland cement, the most widely used type, is responsible for roughly 8% of global carbon dioxide (CO₂) emissions ASU News. This is primarily due to the energy-intensive process and the chemical reactions involved. Cement is made by heating limestone and clay in a kiln to 1,450°C, releasing CO₂ in two ways:
- Fuel Combustion: Energy required for heating contributes one-third of emissions (Our World in Data).
- Chemical Reaction: The calcination of limestone releases two-thirds of the CO₂ (Our World in Data).
The result is a material critical to modern construction but with a significant carbon footprint: one ton of cement emits over half a ton of CO₂. In 2019 alone, cement production contributed 8% of global greenhouse gas emissions.
Rising Global Demand for Cement
Global urbanization trends, particularly in Asia, are driving an unprecedented demand for cement. For instance, between 2011 and 2013, China used 50% more cement than the United States consumed throughout the entire 20th century according to. This surge is fueled by the proliferation of megacities and large-scale infrastructure projects in rapidly developing economies.
Stick around to explore the geographies and temporalities of global cement production, you can expect to learn about:
- Time series and global distribution of cement production CO2 emissions
- Distribution of cement plants and production capacities on a national scale
- Time Series of the proliferation of cement plants over time
- Spatial relations of cement plants to cities and sites of resource extraction in China
Datasets
For this purpose we worked with four Data Sources.
Dataset 1 contains spatial referenced data for cement plants and it associated suppliers in two sperated sheets. Compiled by researchers of Oxford University in collaboration with Astraea Inc. It is the main source for our exploration.
Dataset 2 provides a time series of the annual emissions of cement per country and serves for the contextualisation of the the exploration.
Dataset 3 is a point referenced city database we utilise for purposes of spatial analysis.
Dataset 4 provides is us with country data for map production
Temporal Trends in Cement-Related CO₂ Emissions
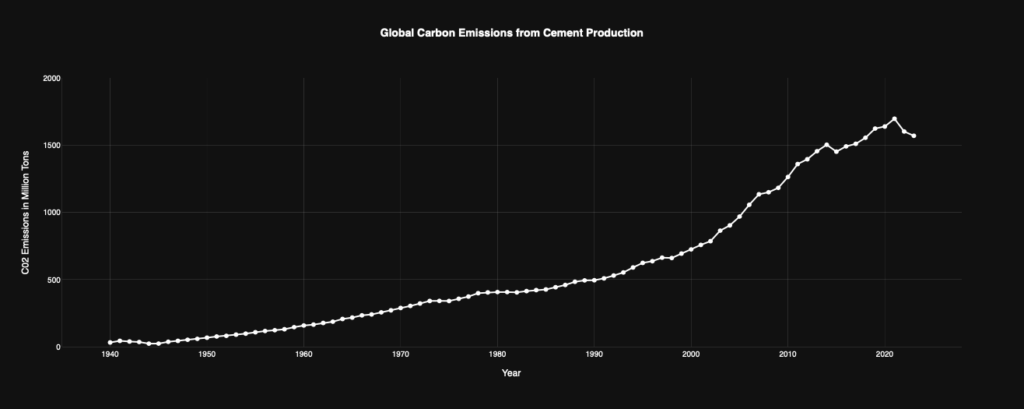
A visualization of global emissions over time reveals key trends:
- Post-WWII suburbanization in the U.S. and European reconstruction drove a significant increasE.
- Since 2000, emissions have surged, largely due to rapid urbanization in Asia, particularly China’s economic boom.
- Periodic declines, such as between 2014–2015 and 2021–2023, correlate with China’s building sector crises and global events like the COVID-19 pandemic.
5. Spatial Dynamics of Cement Emissions
Mapping emissions highlights stark geographical patterns:
- Asia as a Hotspot: China dominates the cement industry, producing nearly 70% of the global volume, followed by significant contributions from India, Vietnam, and other Southeast Asian nations.
- Regional Disparities: Developed regions like Europe and North America have stabilized or reduced production, while developing nations continue to see growth driven by infrastructure needs.
The Top Emitters and Their Trajectories
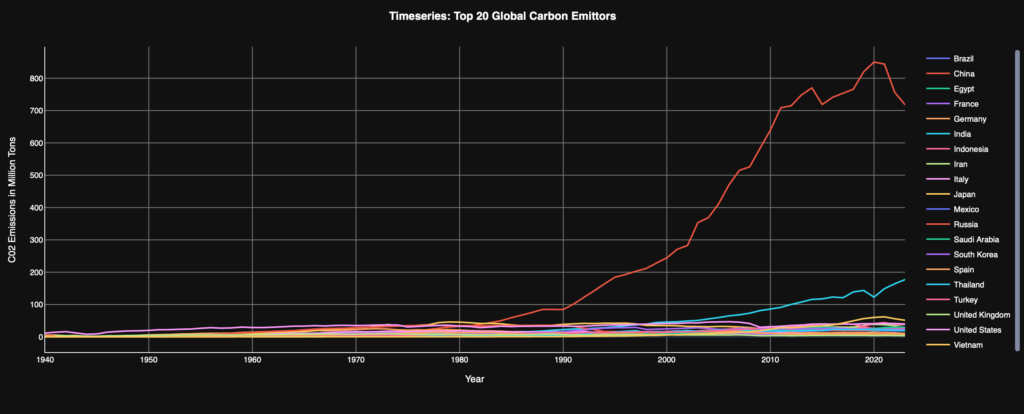
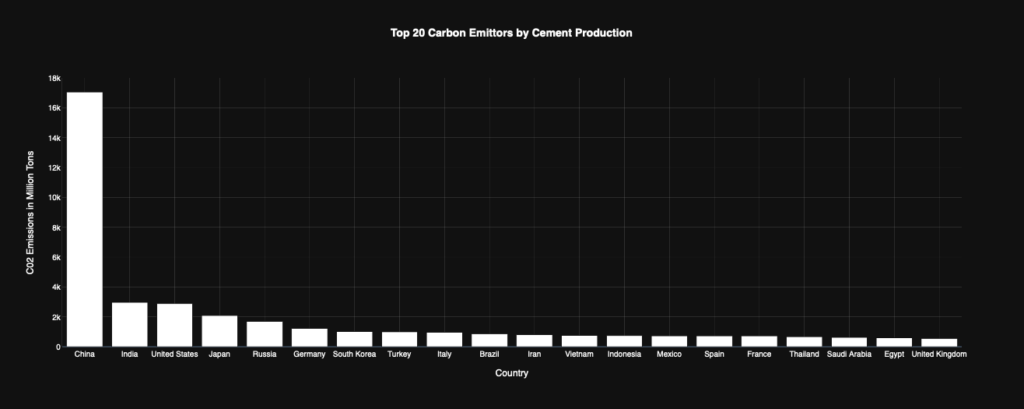
Analysis of the top 20 emitting countries underscores the dominance of Asia in cement-related CO₂ emissions. While these nations are economic powerhouses, their reliance on cement underscores the environmental trade-offs of rapid urbanization. Their spatial development dominate the trend of rising carbon emissions by cement production strongly. On the other side “developed” regions like Europe and North America have stabilized or reduced production.
Regional Trends and Insights into Cement Production
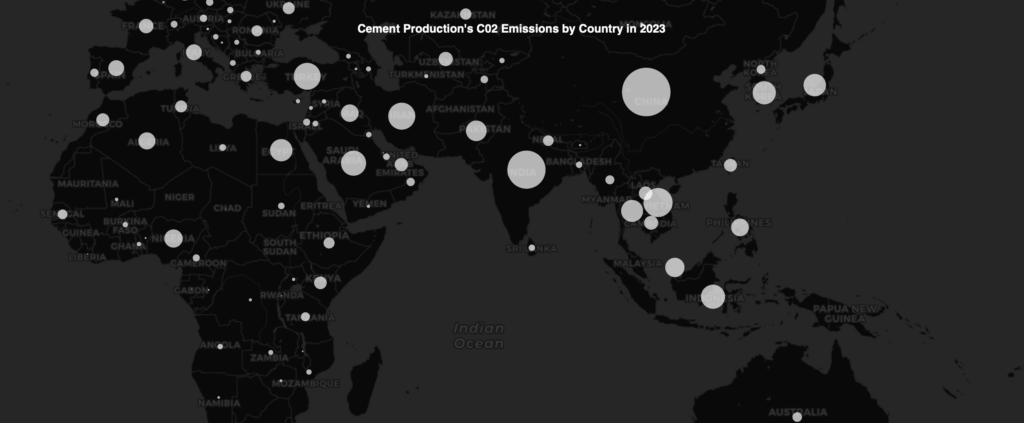
Maps of cement production and CO₂ emissions offer critical insights:
- Geographic Context: They reveal clusters of activity in Asia, illustrating the relationship between industrial centers and urban growth.
- Economic Development: High-emission regions often correlate with booming construction industries and expanding urban footprints.
- Energy Policy: Emissions also reflect energy sources, with coal-heavy production dominating in many regions.
Geographic Distribution of Cement Hotspots in Asia
Southeast Asia plays a pivotal role in the global cement industry, with Vietnam emerging as a dominant player in the region. Vietnam boasts 58 integrated cement plants, significantly outpacing Indonesia, the second-largest producer in the area, which has 15 integrated plants. This strategic dominance positions Vietnam as not only a key regional supplier but also a net exporter of cement.
In the broader Asian context, China remains the linchpin of the global cement industry. With rapid economic development and continuous infrastructure expansion, China accounted for 69.23% of the regional cement market share, fueled by large-scale residential and industrial projects. The Indian Subcontinent, similarly, has experienced tremendous growth in the past decade, underscoring Asia’s critical role in driving global demand.
The Infrastructure Behind Cement Production: An Overview of Our Dataset
Cement Plants Dataset: A Key to Understanding Industry Dynamics
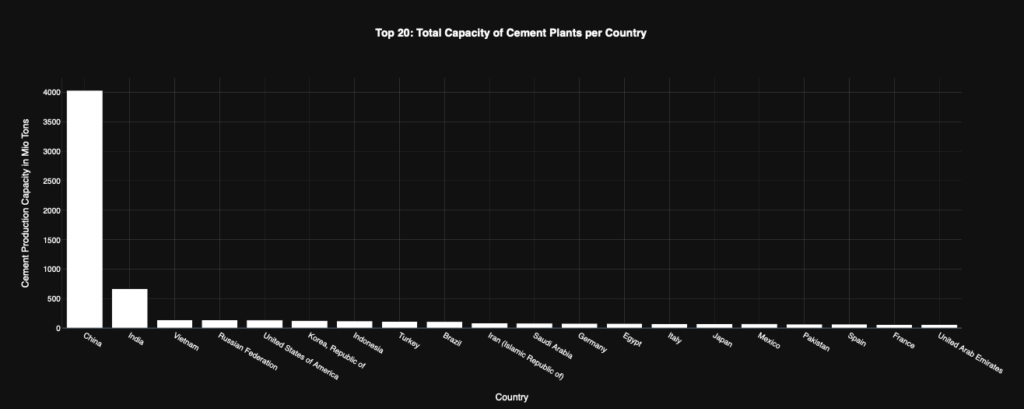
The dataset we will analyze provides a comprehensive view of cement production facilities worldwide. Containing 3,117 rows and 38 columns, it offers rich insights into various aspects of the cement industry. This data is pivotal for examining the geographic, economic, and industrial trends that shape cement production globally. Here is an outline of the critical aspects we aim to explore:
Key Analytical Dimensions
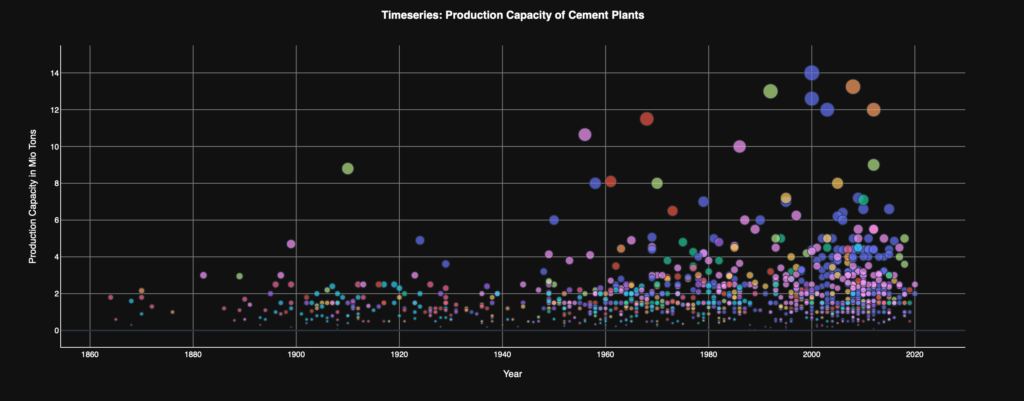
- Cement Plants in Relation to Their Capacity
- We will examine the production capacities of different plants, identifying trends across temporal and national contexts. This analysis will help us understand how production scales have evolved over time and across regions, reflecting infrastructure priorities and economic growth.
- Spatial Distribution and Proximity to Key Centers
- The spatial distribution of cement plants will be mapped to evaluate their locations relative to urban centers, raw material suppliers, and transportation infrastructure. This analysis highlights the logistical considerations in plant siting and their role in regional development.
- Ownership and Corporate Context
- An investigation into the companies owning these plants will shed light on market concentration, industry players’ dominance, and corporate strategies in meeting global demand.
- Material Inputs for Production
- By studying the raw materials utilized in production, we aim to uncover regional variations and their implications for supply chain management and environmental sustainability. This includes assessing the use of alternative fuels and resources.
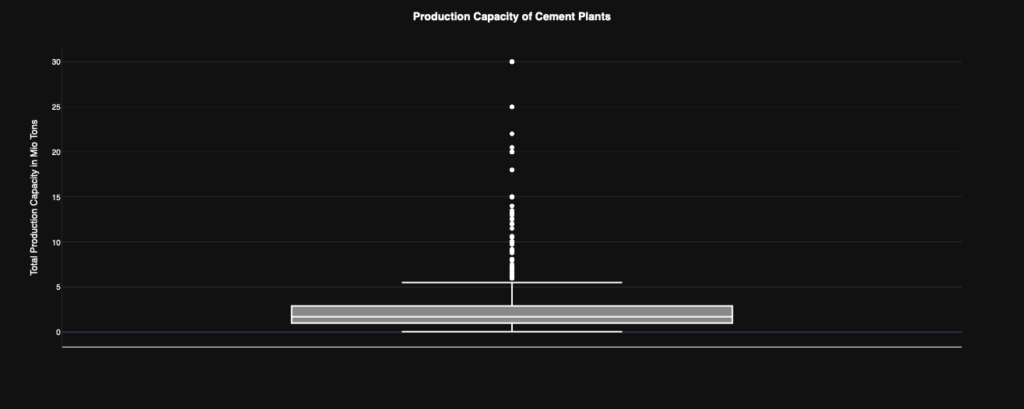
Having that in mind and from analysing the boxplot highlights the overall distribution of production capacity for cement plants worldwide. Key observations include:
- Range and Variability:
- Cement plants exhibit a wide range of production capacities, from small facilities producing as little as 0.05 million tons per year to large-scale operations exceeding 30 million tons annually.
- The median capacity is around 2.4 million tons, with a standard deviation of 2.61 million tons, indicating a moderate concentration around this value while still reflecting significant outliers.
- Notable Outliers:
- The upper whisker, representing high-capacity plants, indicates the existence of mega cement plants, particularly concentrated in countries with large infrastructure projects. These are likely driving global supply, especially in countries like China, which are known for their massive industrial complexes.
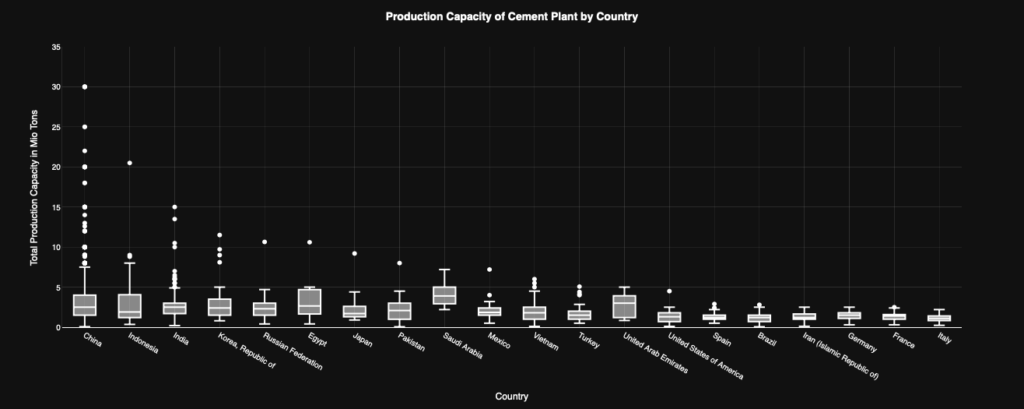
This country-wise boxplot provides a more granular view of production distribution, emphasizing regional disparities and highlighting leading contributors:
- China’s Dominance:
- The graph confirms that China not only hosts the most extensive cement plants but also a significant number of them, consistently exceeding other countries in both capacity and number.
- A majority of China’s plants exceed the global median capacity, reflecting the country’s unparalleled focus on industrialization and urbanization.
- Key Global Players:
- Other countries like Indonesia, India, and South Korea also exhibit a mix of high-capacity plants and mid-tier facilities, showing their importance as regional powerhouses in cement production.
- Developed nations such as the United States, France, and Italy show smaller spreads, as their production has stabilized in response to mature infrastructure and stricter environmental regulations.
- Regional Trends:
- Southeast Asia shows a high concentration of plants operating at a wide range of capacities, aligning with the region’s rapid economic growth.
- Middle Eastern countries like Saudi Arabia exhibit fewer plants but at a relatively high average capacity, reflecting their targeted investments in large-scale projects.
China’s Cement Production Infrastructure: Spatial Analysis and Insights
China’s cement production infrastructure, as depicted in the map, reveals critical patterns in the geographical distribution of cement plants, associated mines, and production capacities. This analysis provides a deeper understanding of how these elements align with regional industrial development and resource availability.
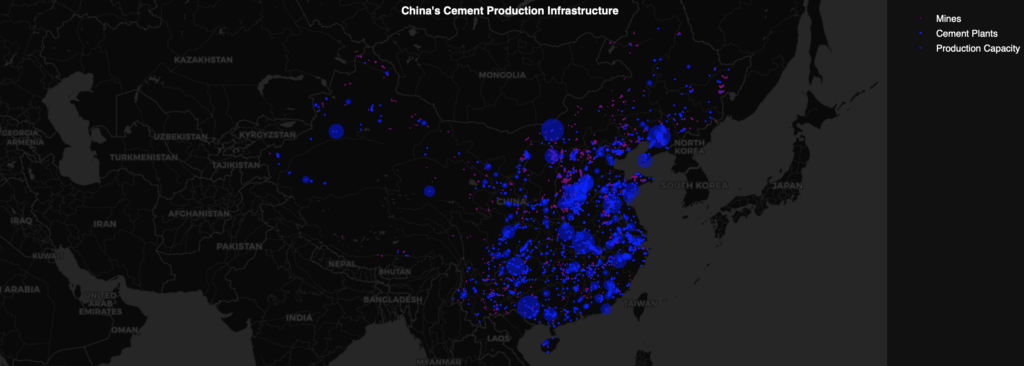
Regional Clusters of Cement Plants and Mines:
- The eastern region of China emerges as the most significant cluster for both cement plants and mines. This area benefits from proximity to major urban centers, port facilities, and economic hubs such as Shanghai, Beijing, and Guangzhou.
- The northeastern provinces, including Heilongjiang and Liaoning, show high-intensity clusters with several high-capacity plants. This is attributed to robust industrial demand and historical investments in heavy industries.
Production Capacity Distribution:
- The map illustrates a clear gradient of production capacity intensifying in the northeast and tapering off in the western regions. This highlights a pattern where infrastructure and resource exploitation are more developed in the eastern provinces, while the western areas, despite their vast landscapes, remain underutilized in terms of cement production.
- Large plants in the northeast dominate the national output, with capacities that often exceed the global averages seen in other regions.
Resource Proximity and Logistics:
- The high density of mines near cement plants in eastern China underlines the efficiency of resource allocation. Close proximity minimizes transportation costs and enhances supply chain efficiency, which is essential for meeting the high demands of urban and industrial development.
- The western and central regions show fewer plants and mines, reflecting logistical challenges and less dense industrial activity.
Urbanization and Infrastructure Development:
- The eastern belt’s dominance is closely tied to China’s rapid urbanization and infrastructure expansion. Cement plants near megacities support massive construction projects such as highways, skyscrapers, and railways.
- The northeast, with its legacy of industrialization, retains its importance due to established infrastructure and the ongoing expansion of modern facilities.
Map 1: Distribution of Limestone Mines in China
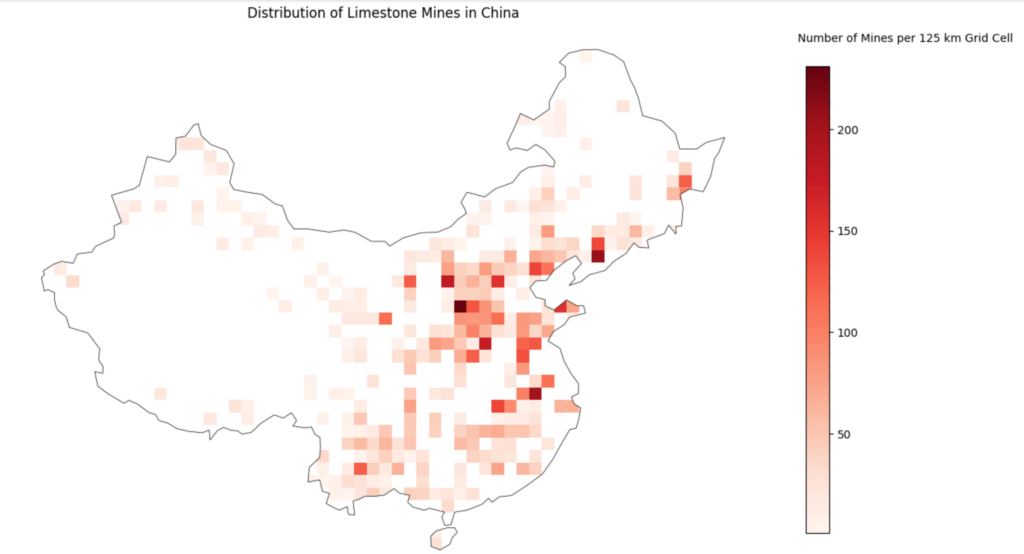
This map highlights the spatial distribution of limestone mines across China, illustrating their critical role as the raw material base for cement production, as previously mentioned. The central region of the country, particularly around Shanghai and extending southward toward Hong Kong, stands out as the primary area where limestone mines are concentrated. This central belt aligns closely with regions rich in geological resources that support industrial-scale mining. The clustering of these mines indicates optimized logistics for supplying cement plants, particularly those in the nearby eastern regions. The strategic positioning of limestone mines in central China minimizes transportation time and costs, enhancing the efficiency of cement production processes to all of China.
Map 2: Distribution of Cement Plants in China
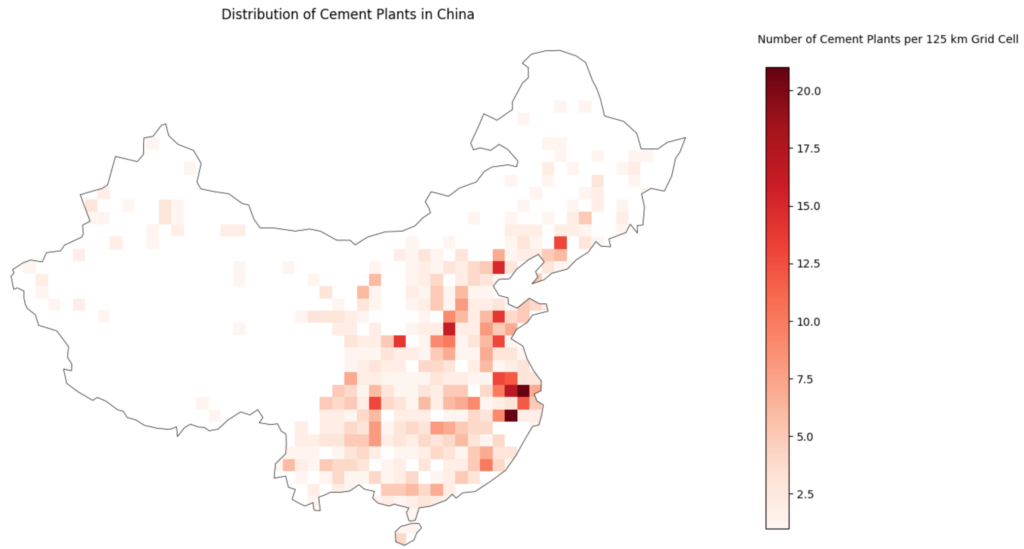
The distribution of cement plants across China underscores the dominance of the eastern part of the country in cement production. This region benefits from its proximity to large urban centers, industrial zones, and transportation networks, which are critical for meeting the high demand for construction materials. Shenzhen, in particular, emerges as a major hub, hosting a dense concentration of cement plants. These facilities cater to the rapid urbanization and infrastructure growth in the region. The strategic placement of plants near limestone mines and along transportation corridors further supports Chin’s economic and operational efficiency.
Map 3: Distribution of Largest Cities by Population China
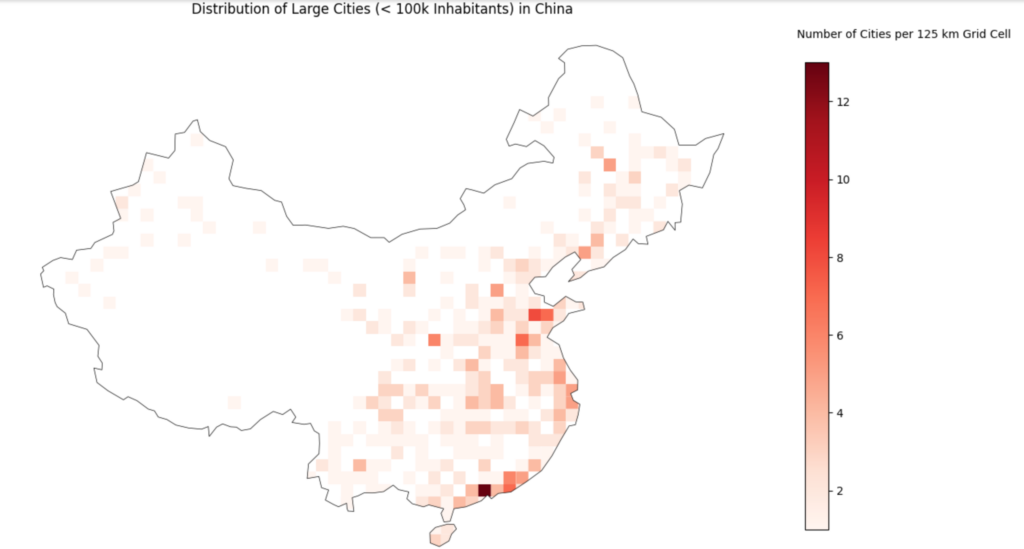
Here data reveals a prominent clustering in the eastern region. Major urban centers such as Shanghai, Shenzhen, Guangzhou, and Beijing dominate this landscape, forming the heart of China’s industrial and economic activity. These cities not only serve as hubs for domestic construction demand but also house some of the country’s largest and busiest ports. Locations like Shanghai, Tianjin, and Shenzhen play a dual role in supporting local development and facilitating cement exports to international markets. These ports ensure that surplus production can reach overseas buyers, emphasizing the global reach of China’s cement industry. This strategic placement links urbanization, industrial production, and international trade, enhancing the economic efficiency of cement production and distribution.
Concluding Remarks
This exploratory investigation impressively reveals the ecological consequences of cement production, illustrating the enormous scale of emissions associated with it. In this context, one can highlight the “dark side” of urbanization. Cities, often perceived as saviors and efficient habitats, rely on a network of dispersed production and extraction sites. With the urbanization of recent decades, this dynamic, along with all its negative consequences, has significantly intensified.
China serves as a prime example of a broader trend in so-called emerging economies, where immense infrastructure projects and urbanization drive the dessemination of prosperity but also shape these consequential processes. When considering Chinese ghost cities, the question inevitably arises: at what cost does this rapid economic growth take place?

