
Parametric and Environmental Data Integration in BIM Workflows
Hyper Building B is a collaborative project developed during the MaCAD 24/25 second-term studio course. As part of the facade team, we were responsible for designing the building envelope and ensuring it harmonizes with the interior program and structural system while maintaining thermal comfort, optimizing views for residential spaces, and generating energy.
During the Integrative Modelling seminar, we explored strategies to apply our panelisation system to the building’s skeleton, informed by environmental data, to enhance both performance and design coherence.
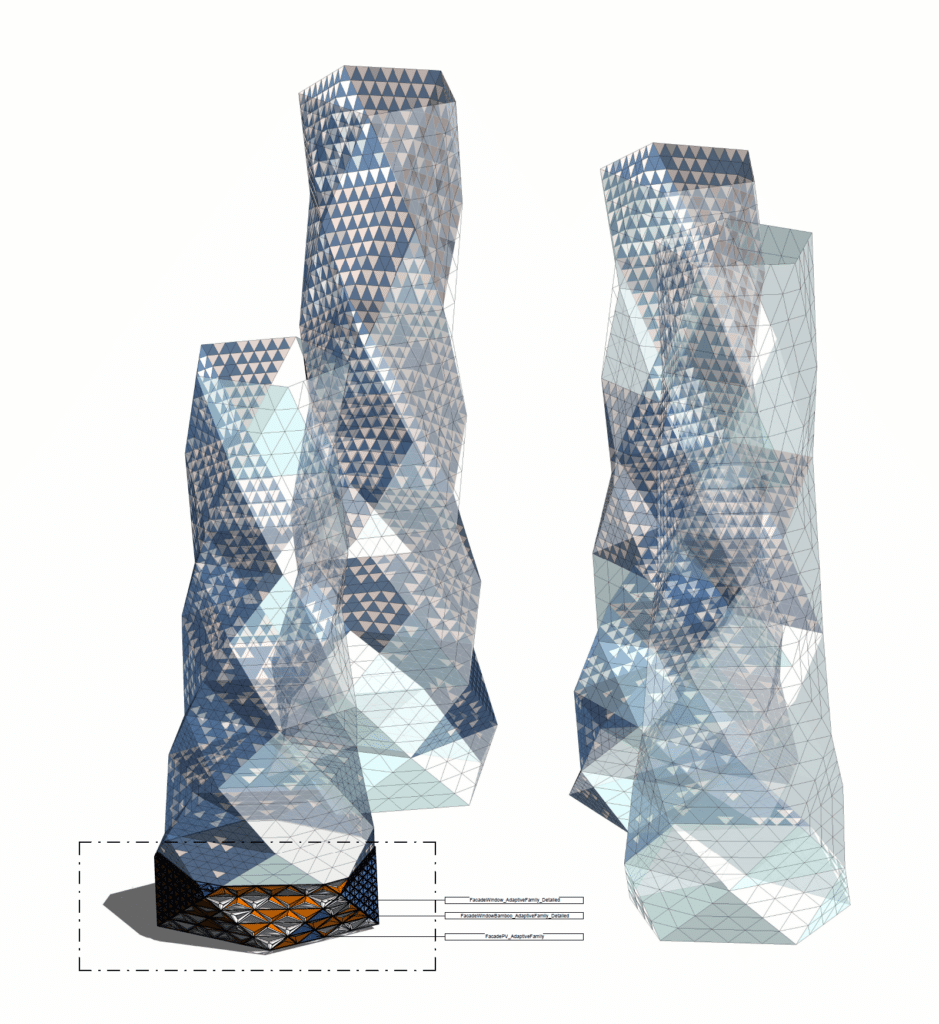
Figure 1: Context Axon
Step 1: Analysis and Panel Subdivision
For our facade strategy, we subdivided the facade into three panel types based on environmental and functional requirements. We analyzed the building’s environmental factors to determine the optimal placement of each panel type, considering:
Thermal comfort to provide shading with a combination of glazed and bamboo panels..
Radiation potential for maximizing energy output with PV panels.
Program requirements to enhance views using fully glazed panels.

Figure 2: Analysis and Panel Subdivision
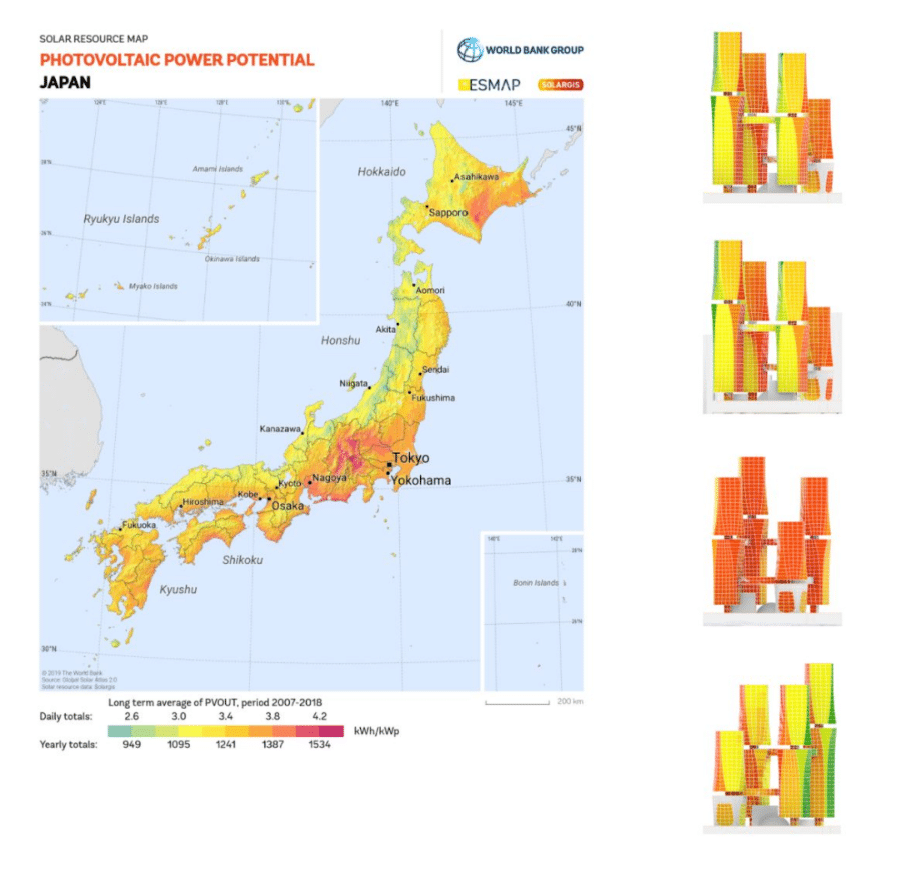
Figure 2: PV Potential in Tokyo
Given that the project is located in Tokyo, we saw a high potential for solar energy generation. This radiation analysis shows the solar exposure on the building’s faces.
We concentrated PV panels on the high-radiation faces to maximize energy output.
Step 2: Creating the Adaptive Panel Families
We then created three adaptive families in Revit, maintaining the same point order as our script. This allows the panels to adjust in size and form depending on their position on the model’s surface. We also assigned materials and their properties, enabling us to track the quantity and total usage for each panel type.

Figure 3: Panels
Step 3: Applying the Panels
We applied the panels using Grasshopper. This axonometric illustrates how the panels are structurally integrated:
- The structural framing is attached to the floor slabs.
- The panels are mounted onto the structural framing.
This approach ensures that the panels align properly with the building’s load-bearing system while maintaining a consistent architectural language.
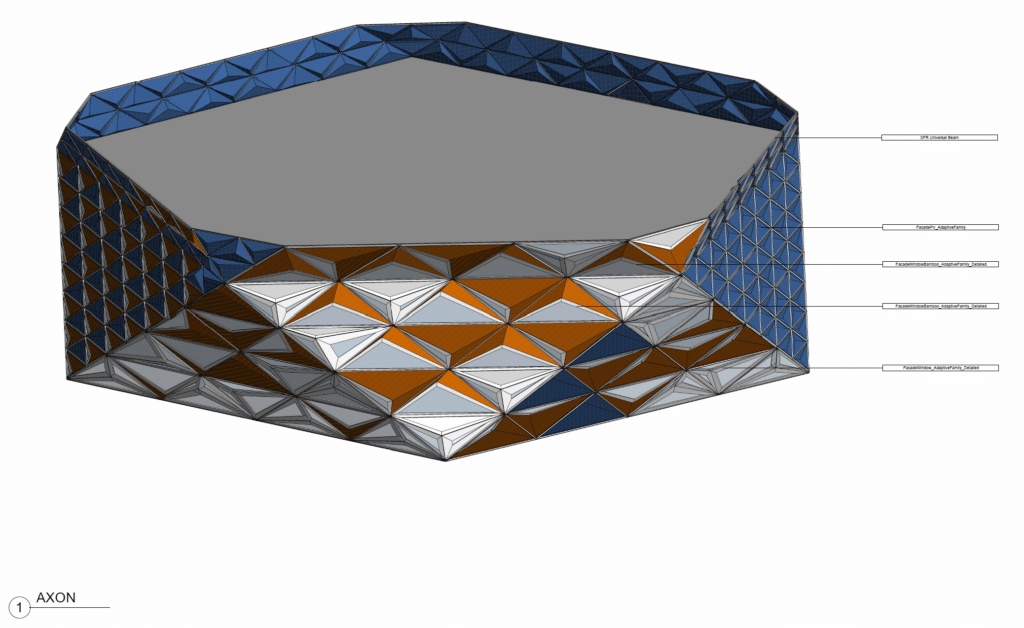

Figure 4: Axon
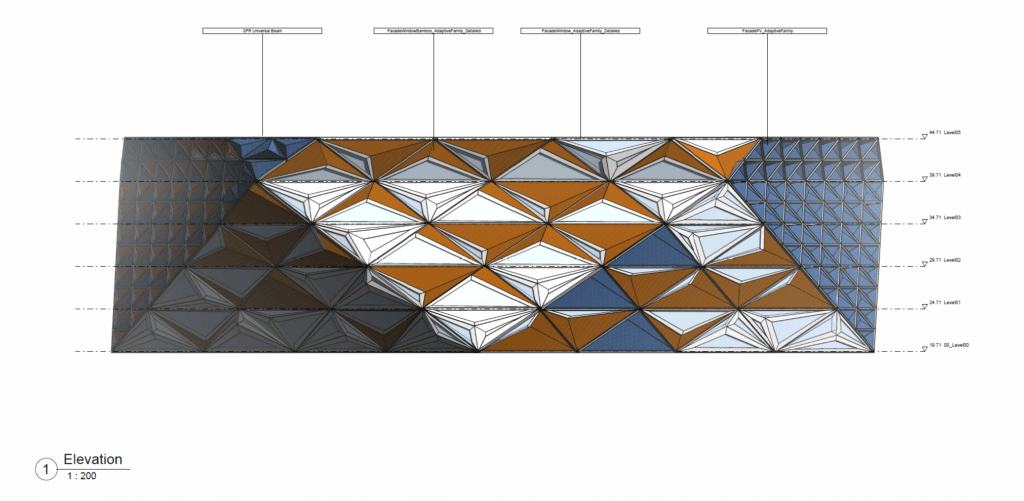
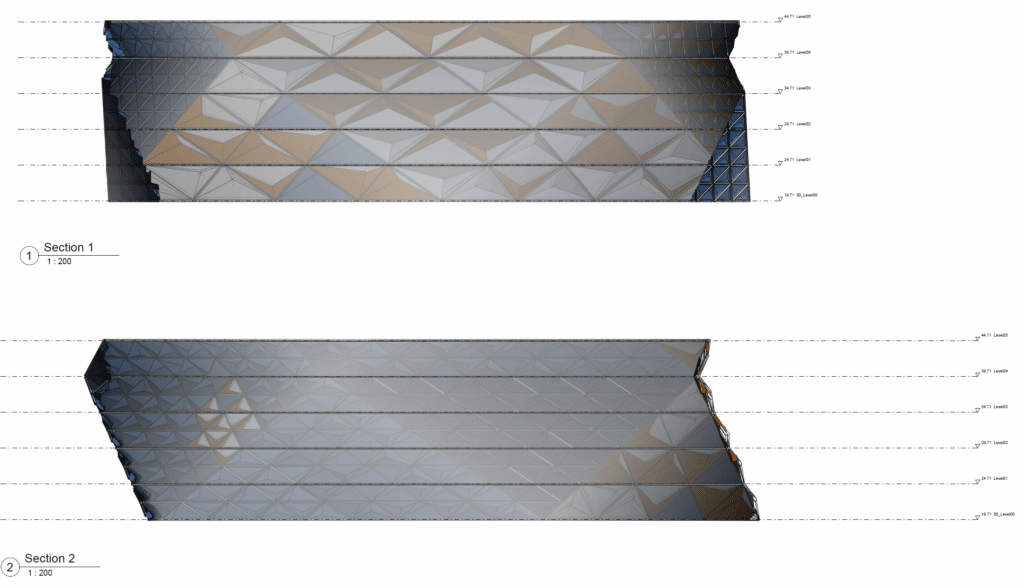
Figure 5: Elevations and Sections
Applying the Data and Creating the Panels
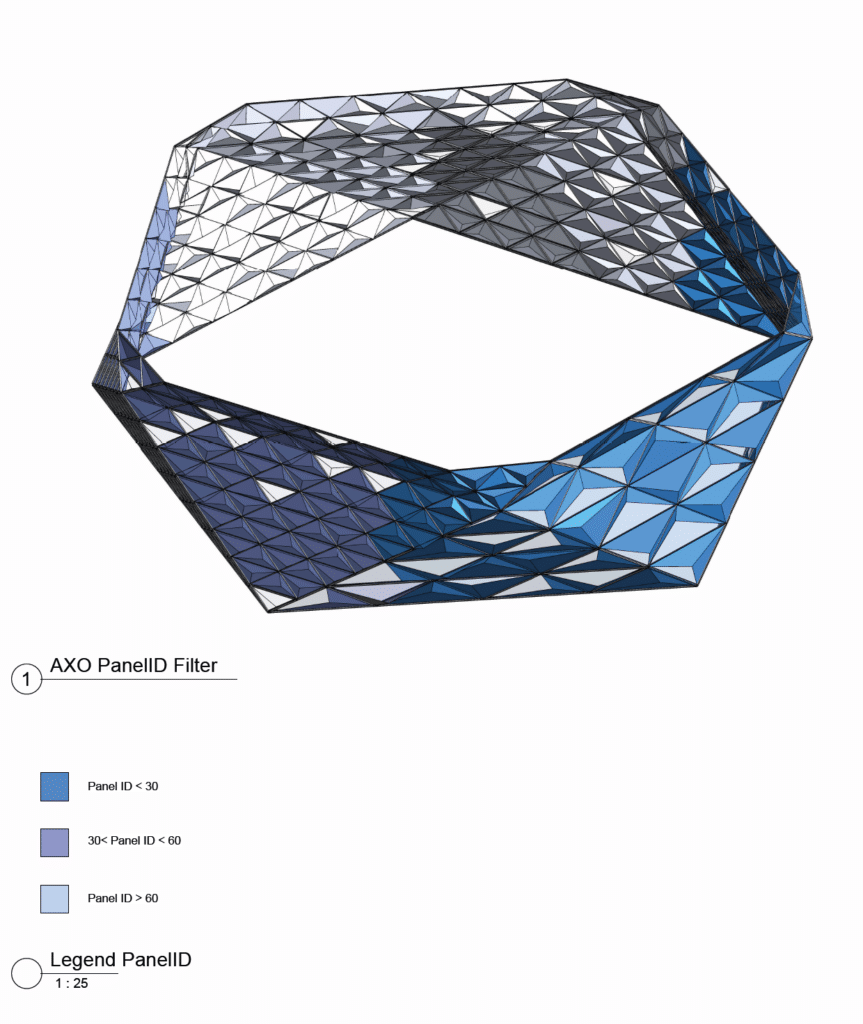

Figure 6: Panels filtered by location
To keep the facade organized, we developed a panel ID system based on the X and Y location of each panel. This allowed us to filter and track panels systematically, which helped streamline both the design and construction process.

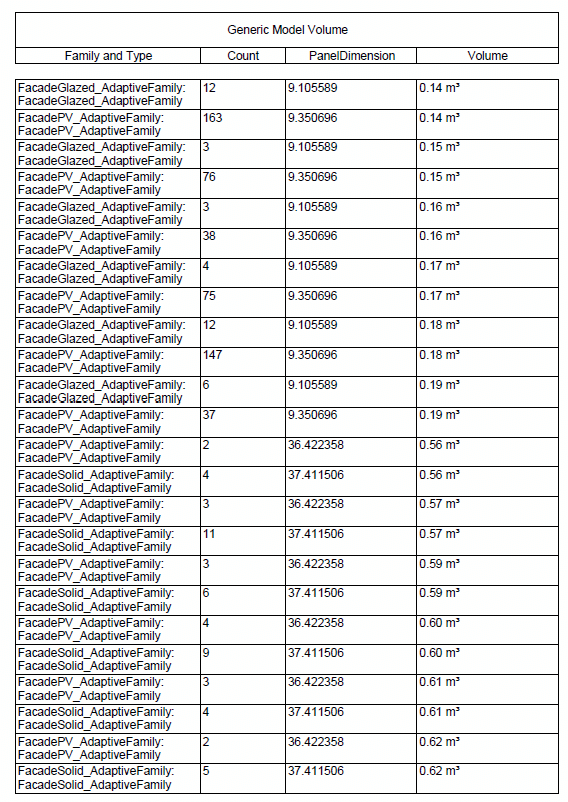
Figure 7: Panels filtered by dimension and volume
We calculated the area and volume of each panel type, which was essential for:
- Accurately estimating material quantities.
- Projecting the energy output of the PV panels based on their size and exposure.


Figure 8: Radiation and Energy Output
We mapped the energy potential of each panel based on:
- Panel efficiency
- Performance ratio
- Exposed surface area
This allowed us to strategically position more PV panels in the highest-performing areas, optimizing the building’s overall energy output.
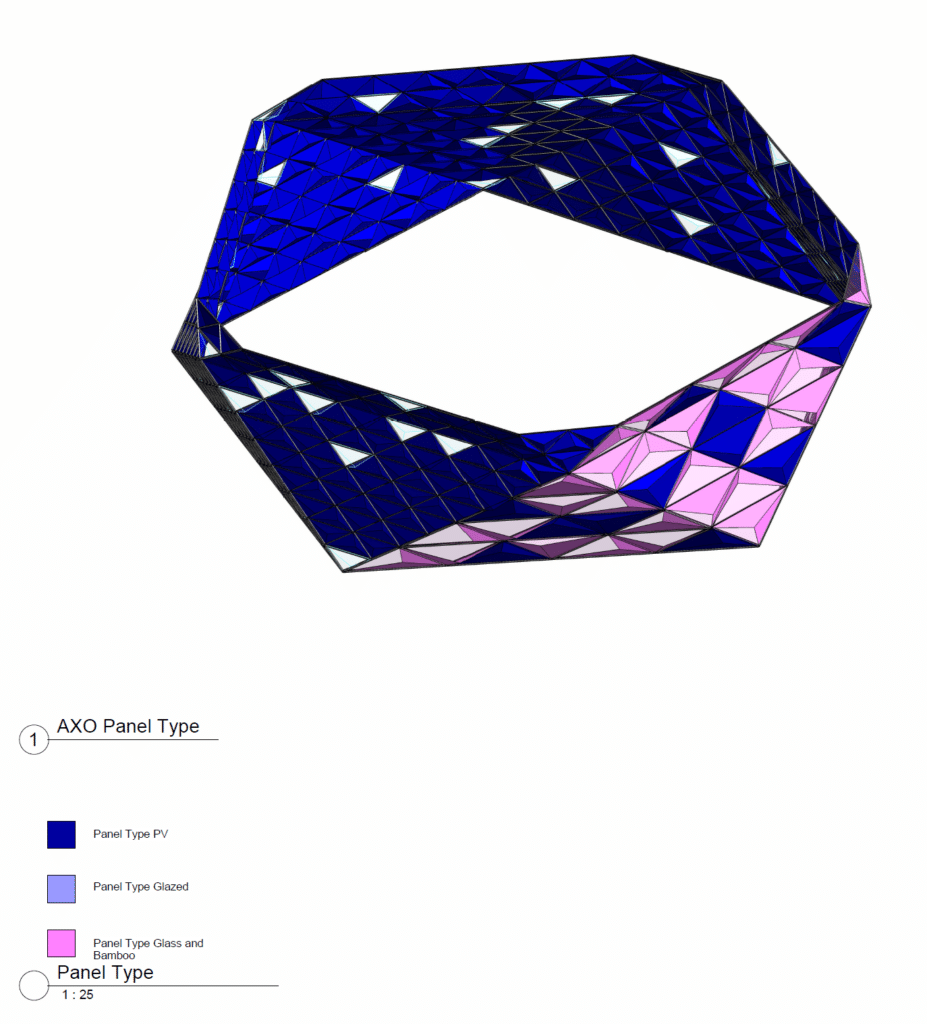

Figure 9: Panel Type
To simplify panel identification and management, we assigned specific colors to each panel type:
- PV Panels
- Full Glazed Panels
- Bamboo Shading Panels
This made it easier to visualize the facade strategy and distribution across the building.


Figure 10: Full Building Panelisation and Filtering based on Type
This is the final building with all panel types in place. The total number of each panel type is shown, confirming that the facade meets both performance and aesthetic goals.
Tools and Workflow
To execute this facade strategy, we used a combination of tools:
- Grasshopper – To subdivide the facade.
- Revit – To capture panel points and create adaptive panels.
- Custom Parameters – Added for energy performance and material properties.
- Grasshopper with Rhino.Inside.Revit – To allocate and place panels.
- Speckle – To manage building massing and data exchange.
This workflow allowed us to automate panel placement and ensure precise alignment with the design strategy.

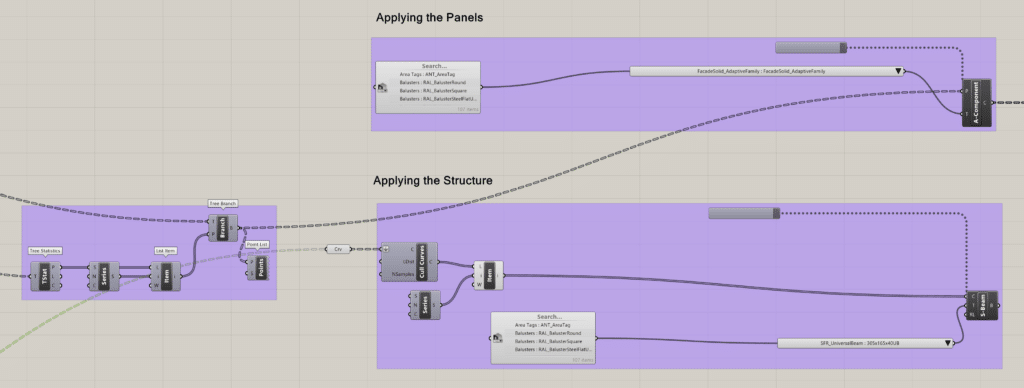


Figure 11: Tools
At the beginning of the semester we tried to apply all our adaptive panels onto the whole building and struggled a bit with this. It really helped to focus on one area. We were able to develop the panels in more detail and adding the material and parameters more efficiently. We were also able to apply a lot more detail through grasshopper.
