
This seminar explored architectural representation as both a design tool and a communicative language. Through drawing, modeling, and visualization exercises, we engaged with abstraction, narrative, and complexity to produce clear, innovative, and visually compelling work. We were encouraged to treat representation as an abstract language capable of expressing spatial and conceptual ideas beyond literal depiction.
We were given 2D drawings of Valldaura Labs’ masia and several of the past MAEBB projects as Rhino files in .3dm format. Each student selected one model and produced: (1) a 2D representation and (2) a 3D axonometric drawing that highlighted any information of our interest. Our chosen information did not need to exist in the original files—we were free to represent concepts such as temperature, sunlight, water flow, or spatial use. As a result, even students working with the same model produced unique outcomes.
I initially attempted to represent water flow in Valldaura’s gardens, as this was the file that my computer could handle most reliably. Water distribution has been a practical issue in our garden, and I hoped visualizing it could clarify the problem and inspire future design interventions. However, two major challenges emerged:
- Difficulty visualizing non-existent data. Creating representations of water flow without a real dataset felt arbitrary, and reference images did little to ease the discomfort of “fabricating” information. The resulting drawings appeared unrealistic and unsatisfactory.
- Severe hardware limitations. My computer struggled with gigabytes of Rhino files—saving, capturing views, and even panning, zooming and rotating were slow and choppy, even in Wireframe and Shaded modes.
Given these constraints, I realized I could work around the technical limitations more easily than the conceptual challenge of imagining data. After all, the exercise was meant to teach us visual representation. It was more important for me to get unstuck on what to visually represent than to worry about the performance of my computer.
Since the purpose of the seminar was to strengthen our visual representation skills, I shifted to a model that offered more concrete information to work with: the Mobile Home (MOCA) project from MAEBB 2023. Its physical dimensions and system components could be measured and analyzed directly in the provided files.
To reduce the computational load, I deleted rather than hid unnecessary components such as screws, hinges, parts of the envelope, and some walls, floors, and windows. They were functional but those details were not important in my representation, and were taking up unnecessary space in my computer’s memory. This allowed me to isolate the elements relevant to my visual analysis and work, albeit slowly, within the limits of my hardware.
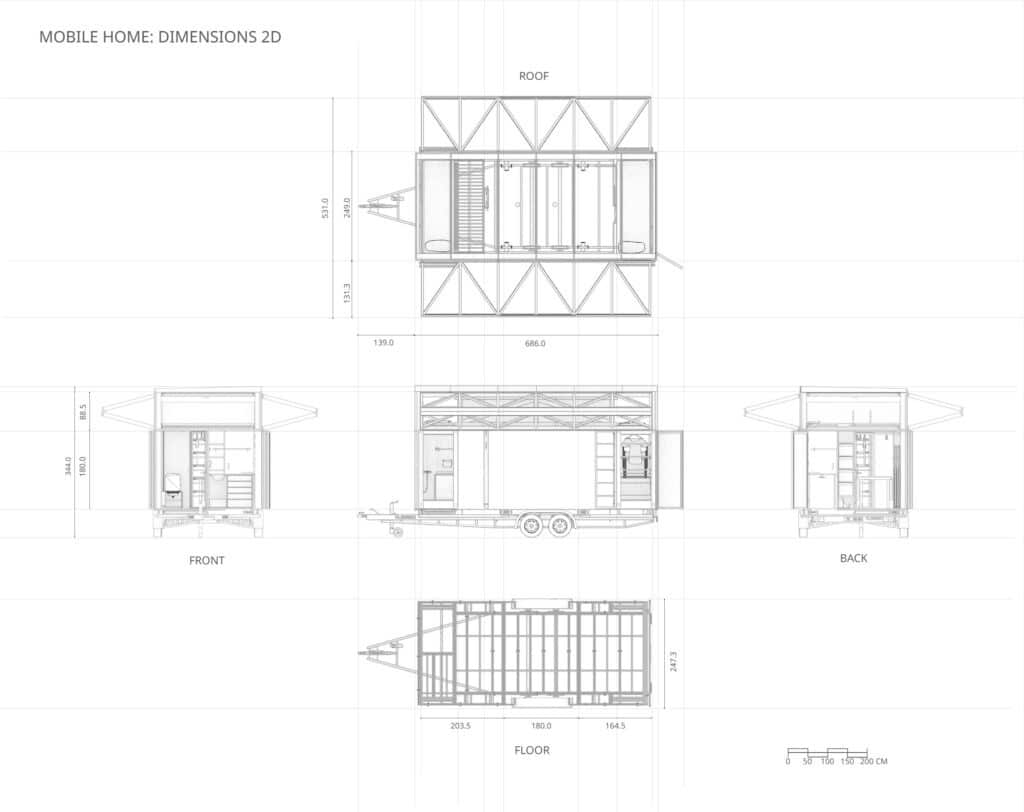
2D Representation
I generated orthographic views from all sides of MOCA and labeled the key dimensions. After finalizing the details in Shaded mode, I rendered the drawings in Monochrome mode to adjust line weights and shadows while maintaining a technical aesthetic. I then exported the drawing to another application to add labels, annotations and the scale.
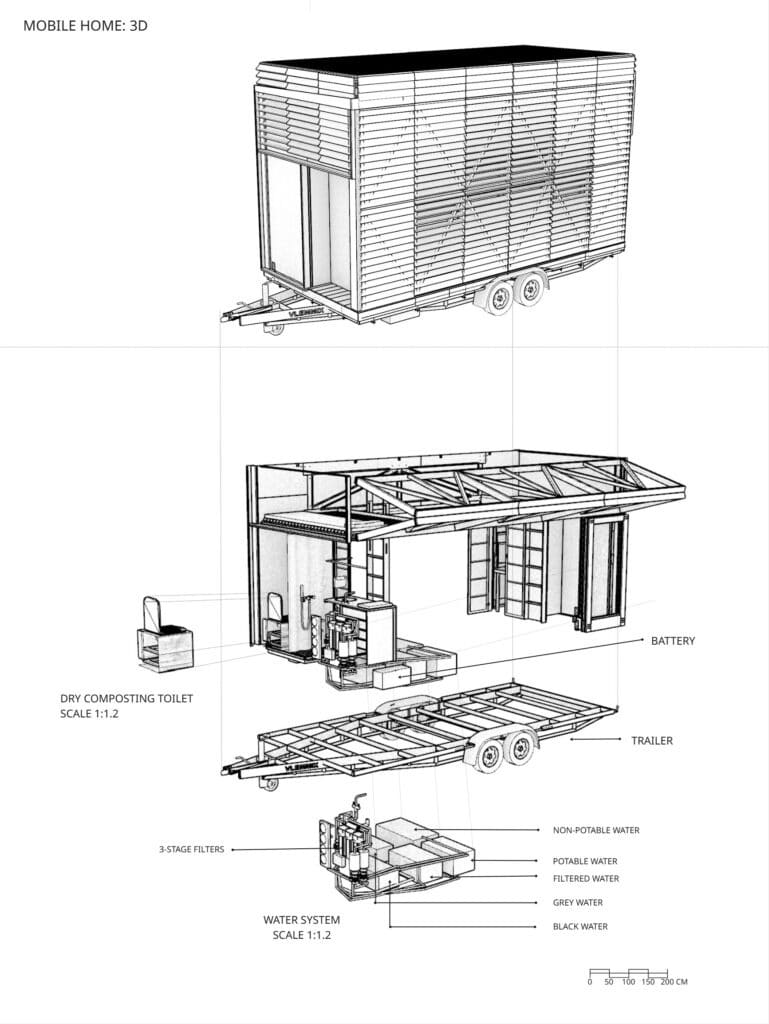
3D Representation
For the 3D axonometric output, I chose to isolate MOCA’s water filtration and toilet systems, enlarging them to a 1:1.2 scale for clearer labeling. I unfolded MOCA’s envelope, opened its windows and doors, and deleted parts of the roof, flooring and walls to reveal its interior. Again, I exported the drawing to another application to add the labels, annotations and the scale.
Lessons Learned
In hindsight, I realized that my greatest challenge might have been shifting from an engineering mindset—grounded in real data and measurable systems—to an architectural mindset that embraces abstraction as a generative tool. Having spent over a decade designing systems, tools and numerical models defined by physical variables (electromagnetic waves, weather data, flood data, etc.), it felt incredibly difficult for me to fabricate information without empirical basis.
Only at the end of the seminar did I recognize that the visual representation skills we practiced could have greatly enhanced the communication of my past technical work. While I produced meticulous and well-articulated graphs, maps, and simulations, architectural representation techniques could have made those outputs more accessible and compelling to audiences outside of my industry. I gained a new appreciation for the patience, attention to detail and level of sophistication required to convey strong architectural messages in as many ways as our imaginations can allow.
Moreover, it would be interesting to explore how Rhinoceros 8 consumes CPU, memory, GPU and power resources. I am curious to find out if understanding the pipelines and protocols that Rhino, as a tool, uses to communicate with my hardware could help optimize my future workflows for, in this case, visualization tasks.
