
Have you ever looked at a complex building and wondered how a machine might understand its layout? In a fascinating project from IAAC MaCAD, researchers built a graph-based analysis and learning pipeline to decode architectural floor plans.
Using “The Interlace” in Singapore as their primary case study, the team demonstrated how converting floor plans into data graphs can unlock deep insights into spatial organization and even allow artificial intelligence to predict room types.
Here is a breakdown of their graph machine learning workflow and what it reveals about the spaces we inhabit.
Buildings as Graphs: The Spatial Analysis
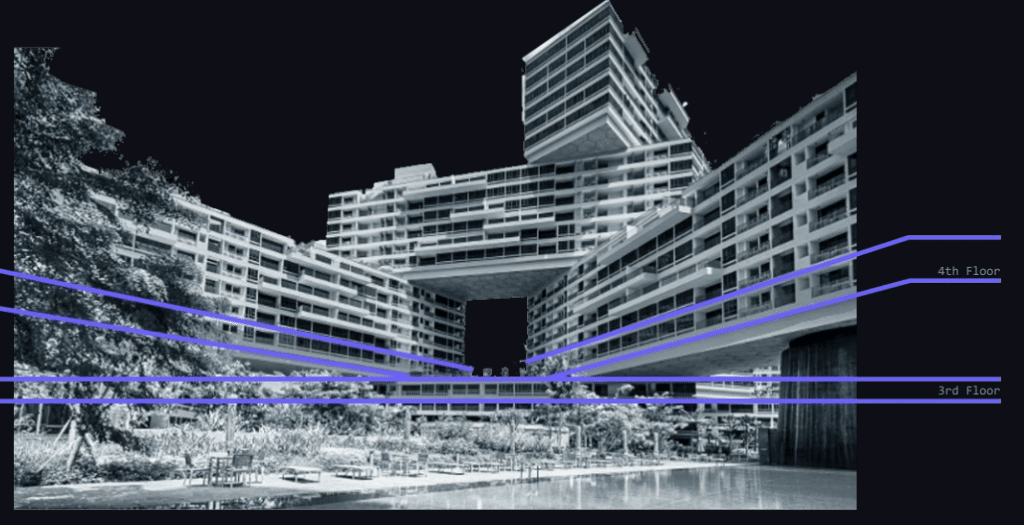
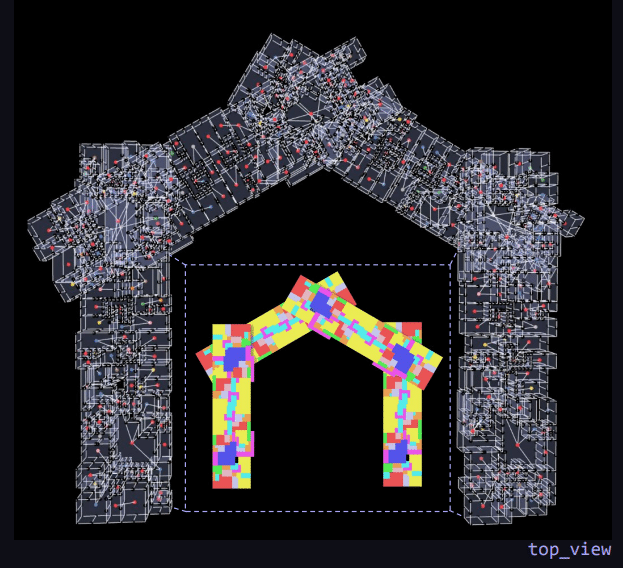
The Interlace is a multi-apartment residential complex characterized by interconnected blocks and courtyards, creating rich spatial relationships. The team focused their efforts on recreating the 3rd and 4th floors of this complex.
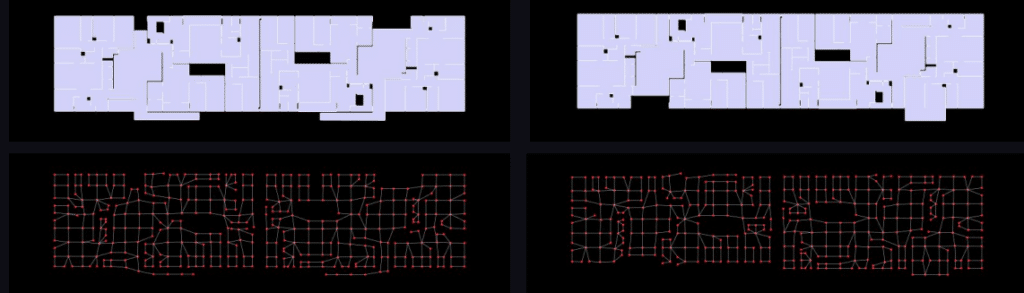
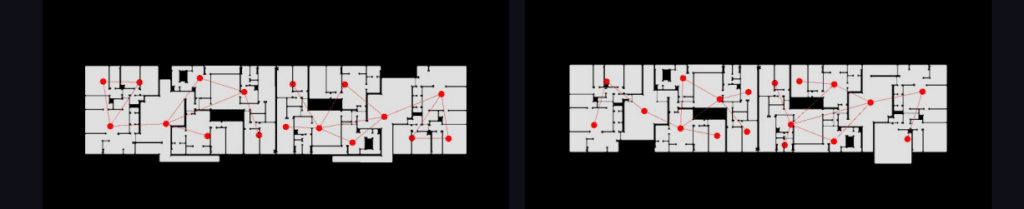
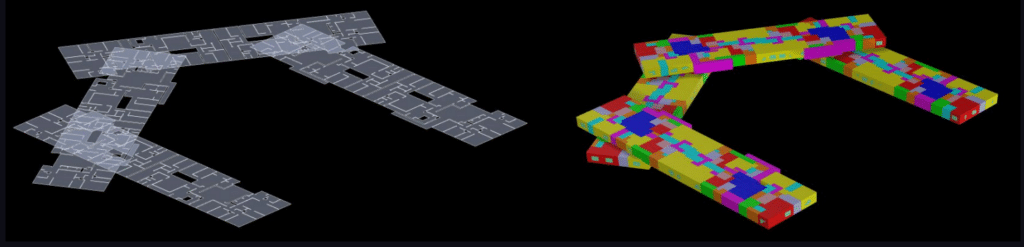
To process the building through a machine learning lens, the physical geometry was converted into a graph structure. In this system, every room acts as a “node” positioned at its geometric centroid, and every door, passage, or adjacency acts as an “edge” connecting them.
This topological structure allowed the team to extract several automated insights:
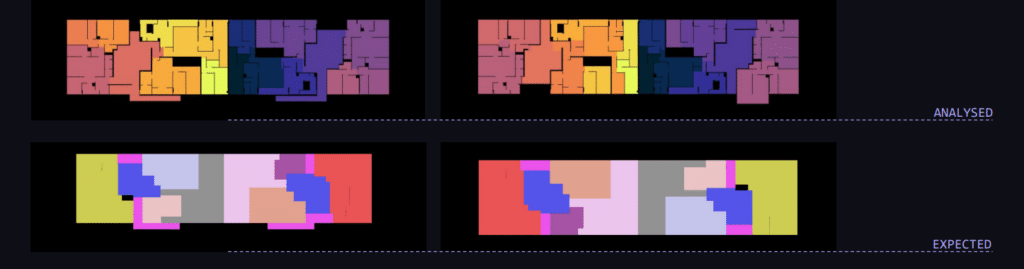
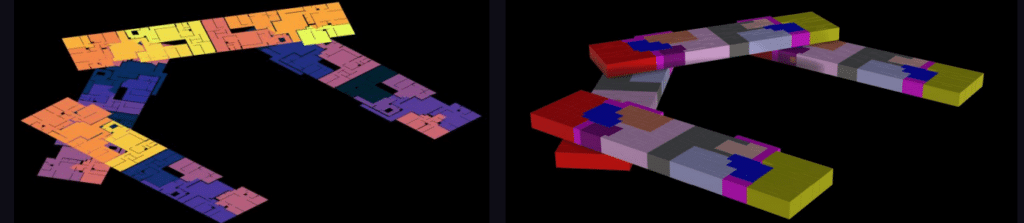
- Community Detection: The graph successfully captured spatial structures that aligned closely with the expected residential organization of the building.
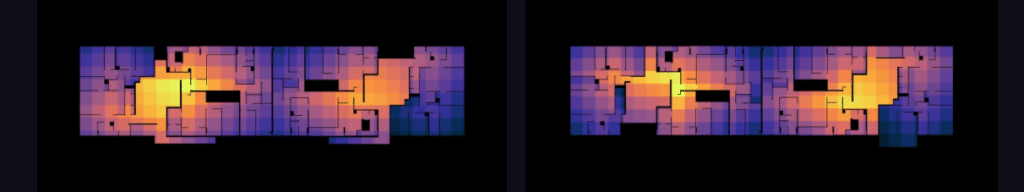
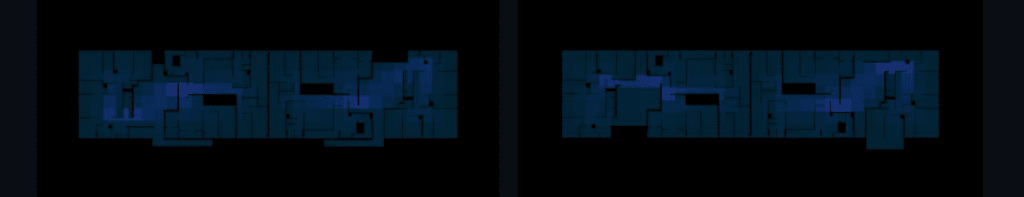
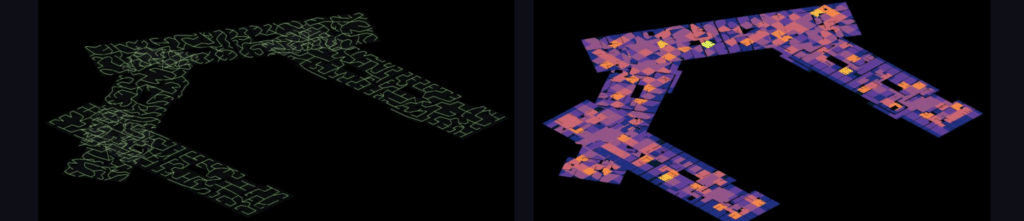
- Visibility Graphs: The analysis proved that the central circulation spine holds the highest visual connectivity, while peripheral rooms and corners remain visually isolated.
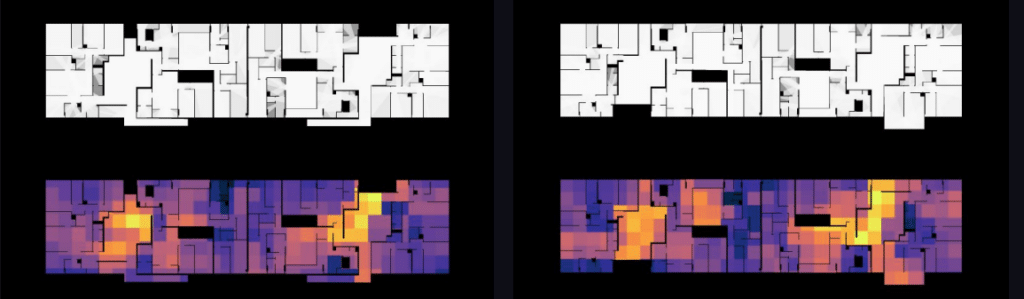
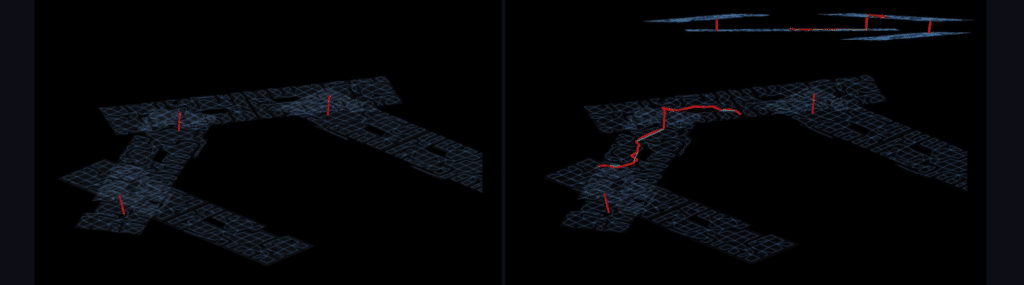
- Centrality Metrics: Betweenness centrality identified critical connector spaces and high-flow bottlenecks, while degree centrality helped map highly connected versus poorly connected spaces.
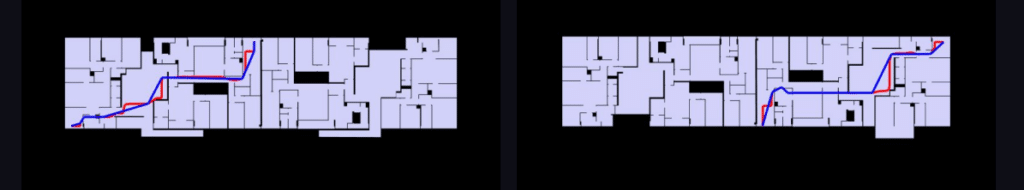
- 3D Expansion: The team also visualized the two floor plates in 3D, calculating cross-floor shortest paths via stair edges and generating a 3D minimum spanning tree.
The AI Challenge: Predicting Room Types
The core machine learning task of the project was node classification. The goal was to feed the room-connectivity graph into a neural network and have it predict the specific room type (such as a bedroom, balcony, or storeroom) out of 9 possible classes.
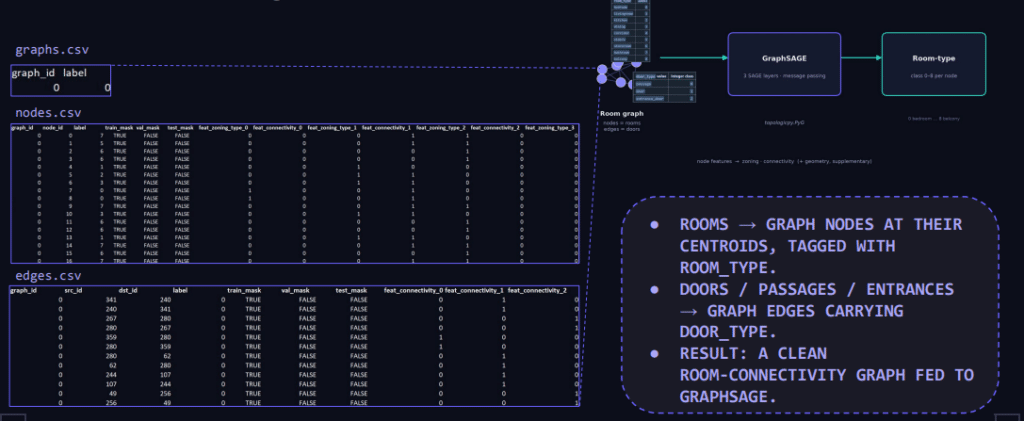
The researchers initially used a pre-trained GraphSAGE model that had been trained on a modified “Swiss Dwellings” (MSD) dataset.
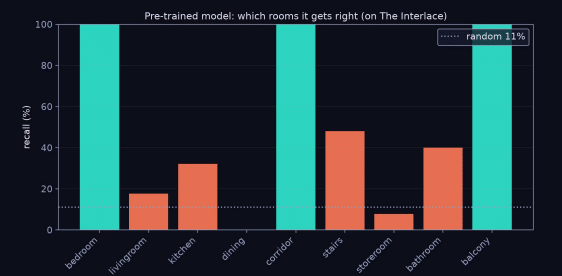
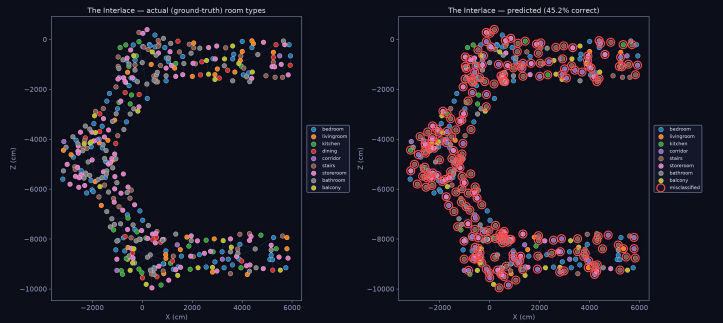
When tested on the 418 unseen rooms of The Interlace, the pre-trained model achieved an overall accuracy of 45.2%. While this is roughly four times better than a random guess of 11%, it highlighted several distinct challenges in architectural machine learning.
Understanding the 45% Accuracy: The Domain Shift
Why did a model trained to understand Swiss apartments struggle to classify a complex in Singapore? The researchers identified four highly plausible reasons:
- Domain Shift: The Interlace is a fundamentally different building type compared to the Swiss apartments in the training data.
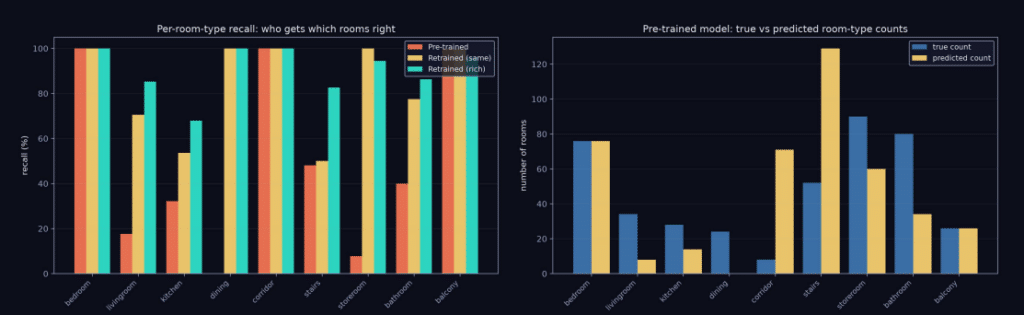
- Class Distribution: The room-type mix varies drastically; for instance, The Interlace featured 90 storerooms and 8 corridors, a ratio unlike the MSD dataset.
- Labelling Definitions: The project’s labels for specific rooms may not have matched how the MSD dataset defined those same room types.
- Building Topology: The Interlace features large, looping corridors, which present a vastly different connectivity structure compared to small, isolated flats.
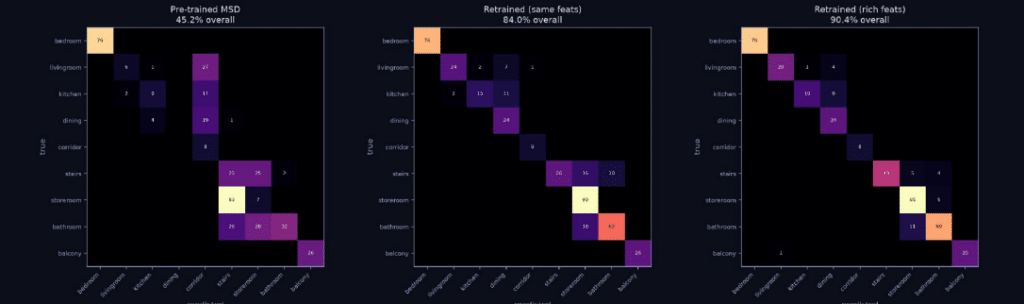
Errors specifically clustered in areas where rooms shared the same zoning class, showing that the model struggled to differentiate spaces with similar public, private, or service functions.
Pushing the Limits: Retraining for Generalization
To understand the true limits of the model, the team ran supplementary tests where they retrained the algorithm specifically on data from The Interlace using a 70/15/15 data split.
- The improvements were significant: Model ConfigurationHeld-Out Test AccuracyNotePre-trained MSD Model: 45.2%
- Baseline test on 418 unseen rooms. Retrained (Same Features): 77.4%
- Retrained on The Interlace data using the original 7 features. Retrained (Richer Features): 85.5%
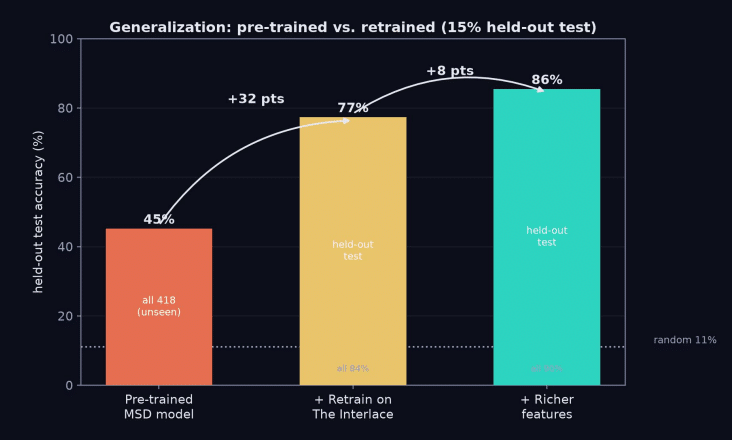
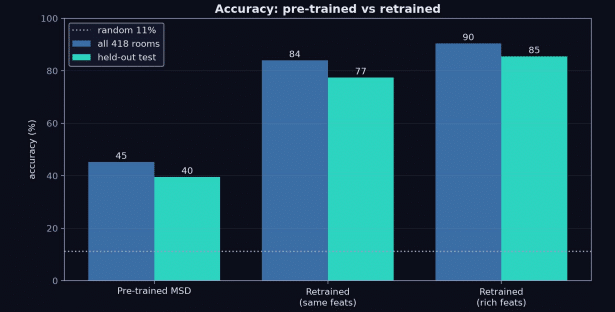
rooms
Added geometric features like area, shape, and connectivity.
Retraining the model with richer features cleared up much of the earlier confusion between spaces like kitchens, dining rooms, and corridors.
Ultimately, this presentation successfully proves that graph representation makes a building’s spatial structure explicitly analyzable. The Interlace stands out as a highly legible, strong case study for the future of graph-based learning in architecture.
