For the Graph Machine Learning (ML) seminar we took a classic New York brownstone and asked how graph ML can read the way a building is organized, and what happens when that organization changes.
Objective:
Our goal was to model an old and a new brownstone layout as spatial graphs in TopologicPy, compare how the redesign changes circulation and spatial hierarchy, and then run a pretrained model on the new layout to classify rooms and, importantly, to see where it succeeds and where it fails.
Timeline:
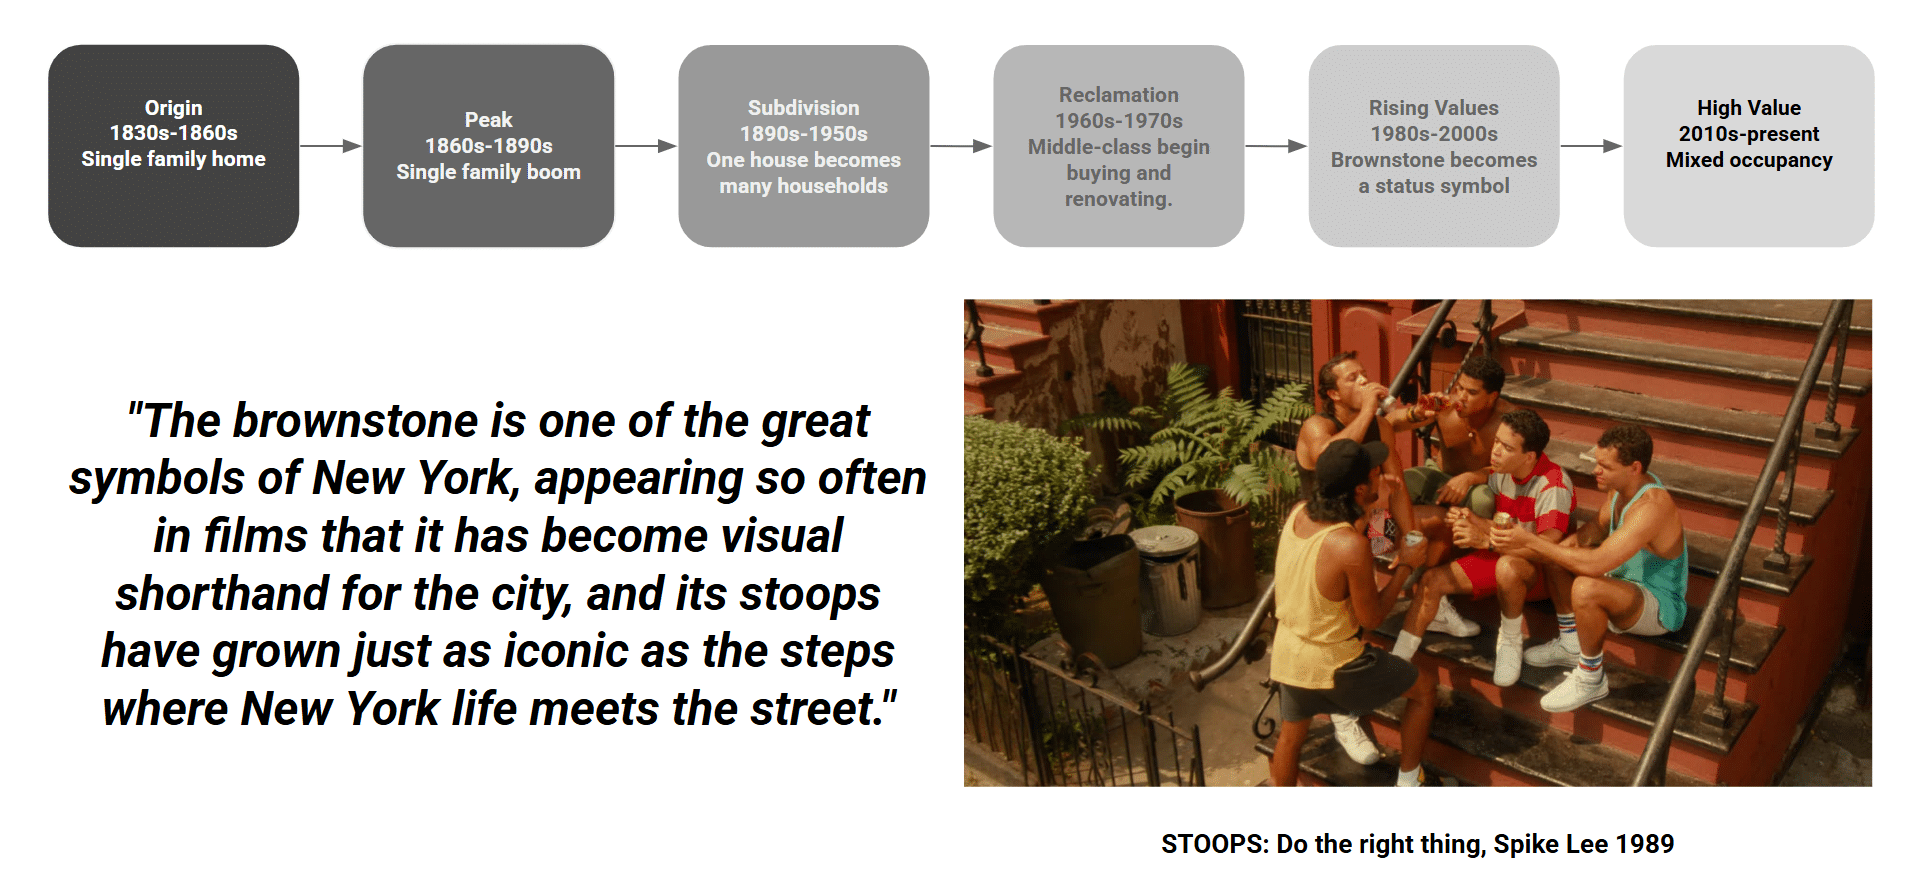
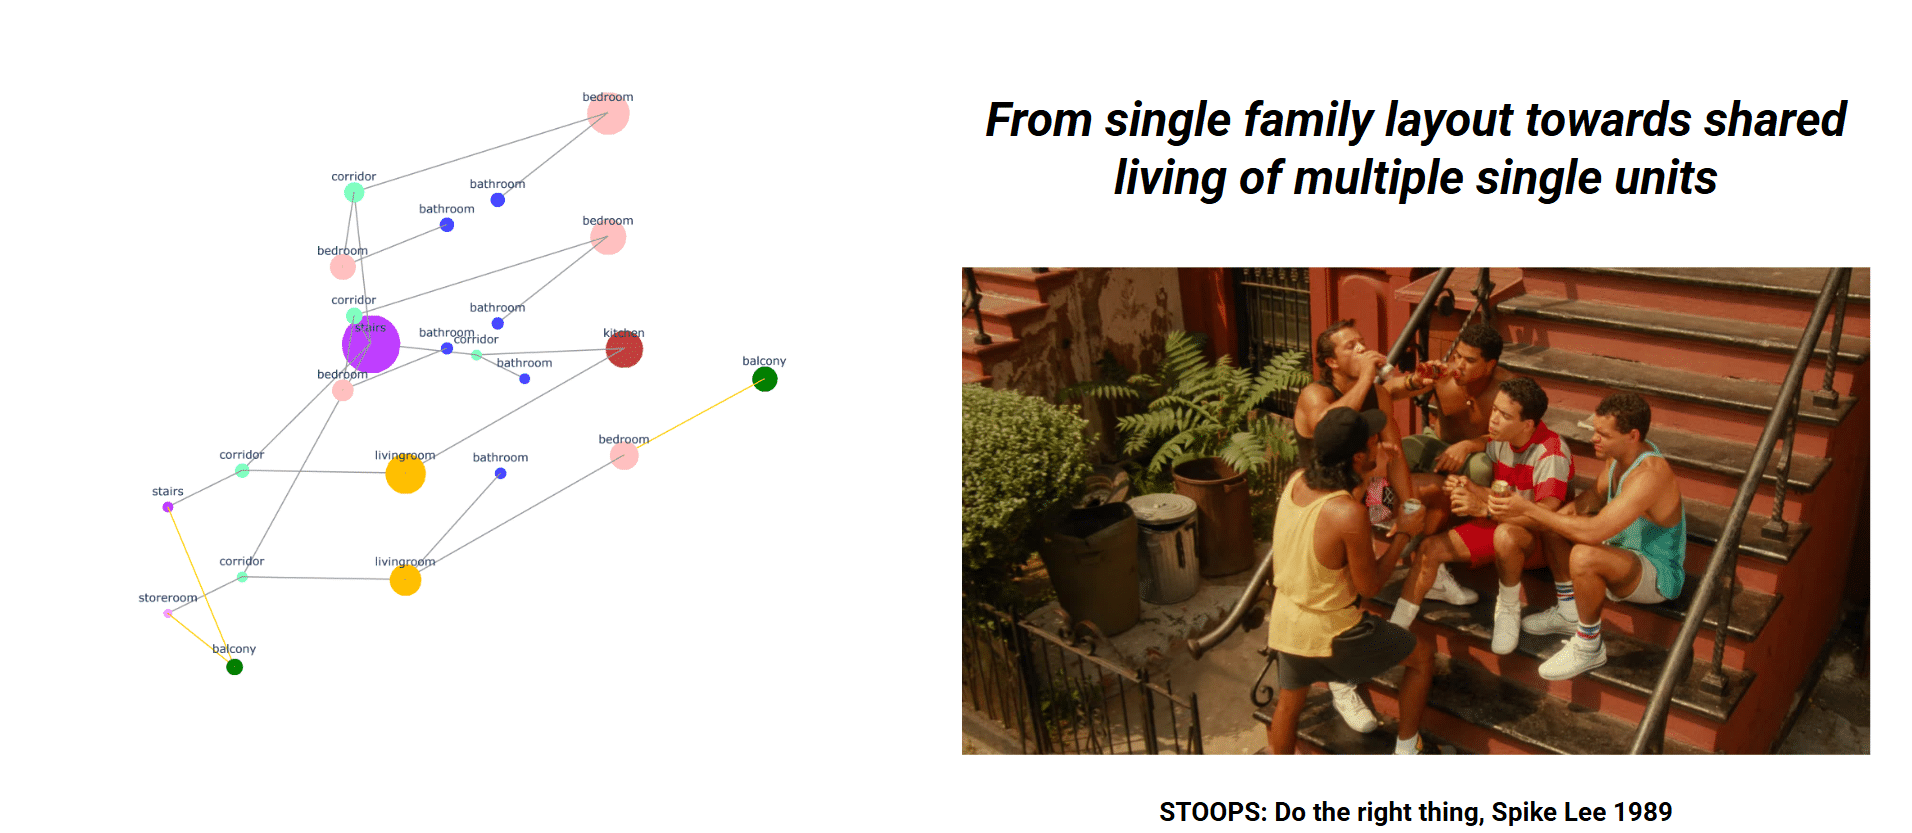
Quick context on why the brownstone matters. It goes through phases from single-family homes in the 1830s, to a building boom, to subdivision into many households, reclamation, rising values, and today’s mixed occupancy. The stoop became iconic, like in Spike Lee’s Do the Right Thing , the threshold where private home meets public street. That shift, from one family to many households sharing a single building, is exactly what our project sets out to read through graphs.
New Layout
From Rhino to Topologicpy
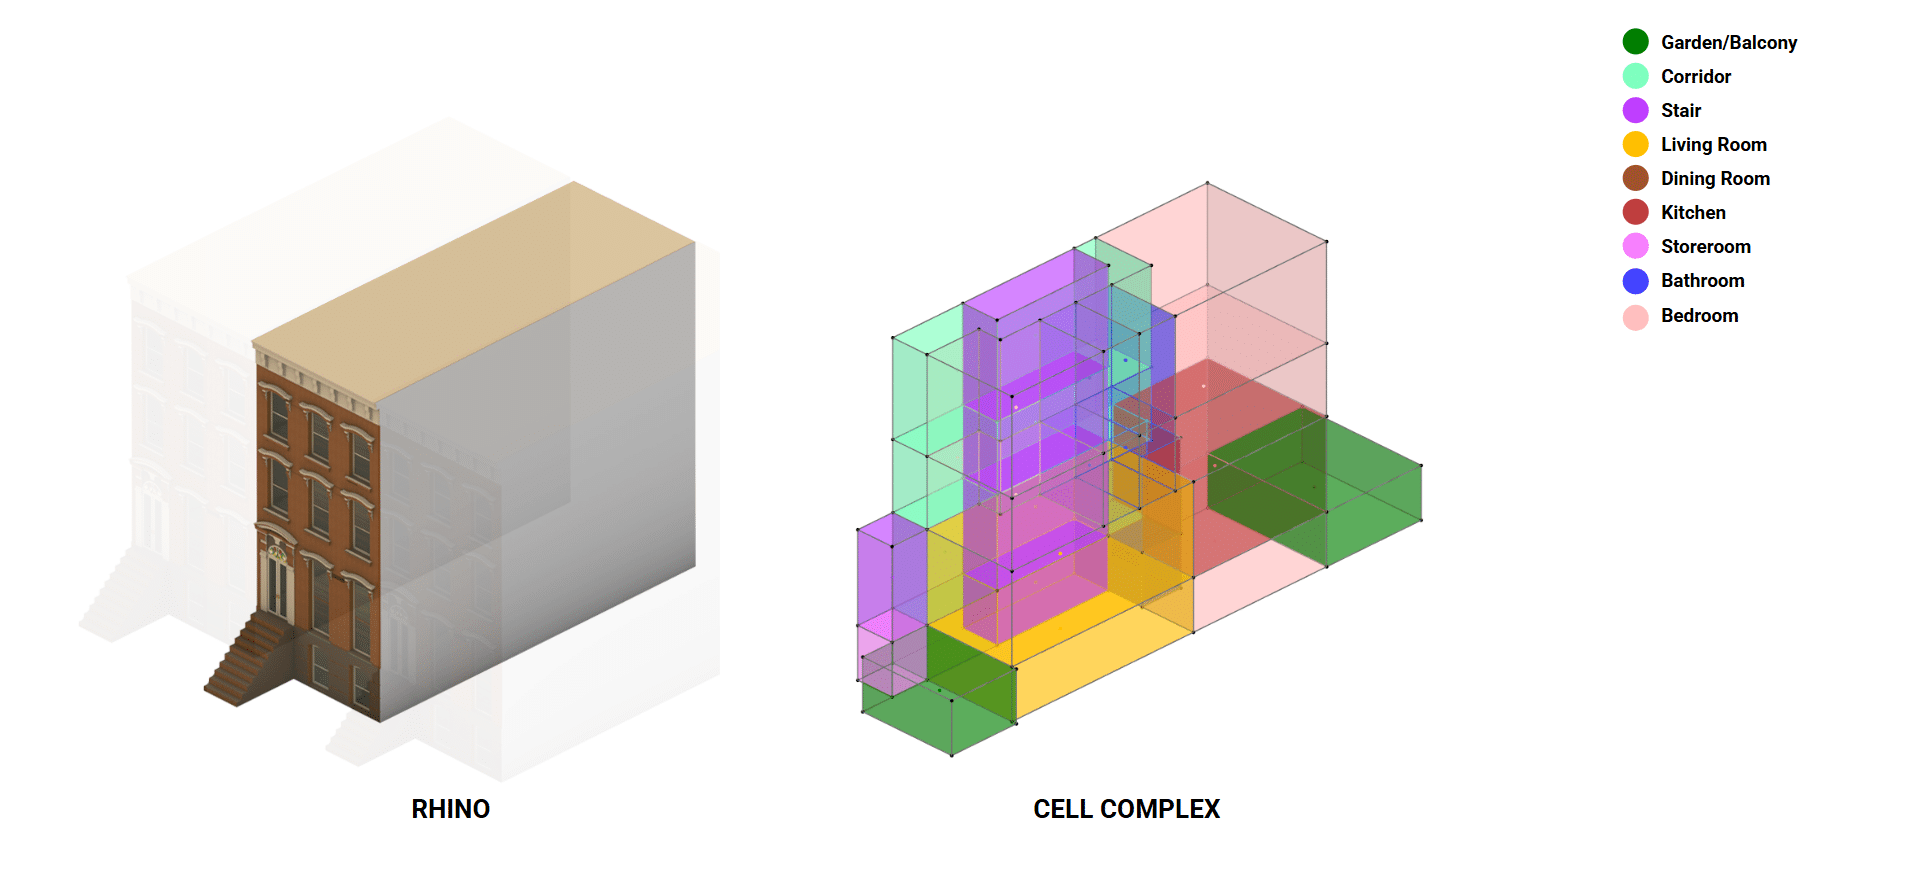
Here’s our workflow. We start with the redesigned apartment modeled in Rhino, then convert it into a Topologicpy cell complex, every room becomes a 3D cell, color-coded by room type.
From Cell Complex to Graphs
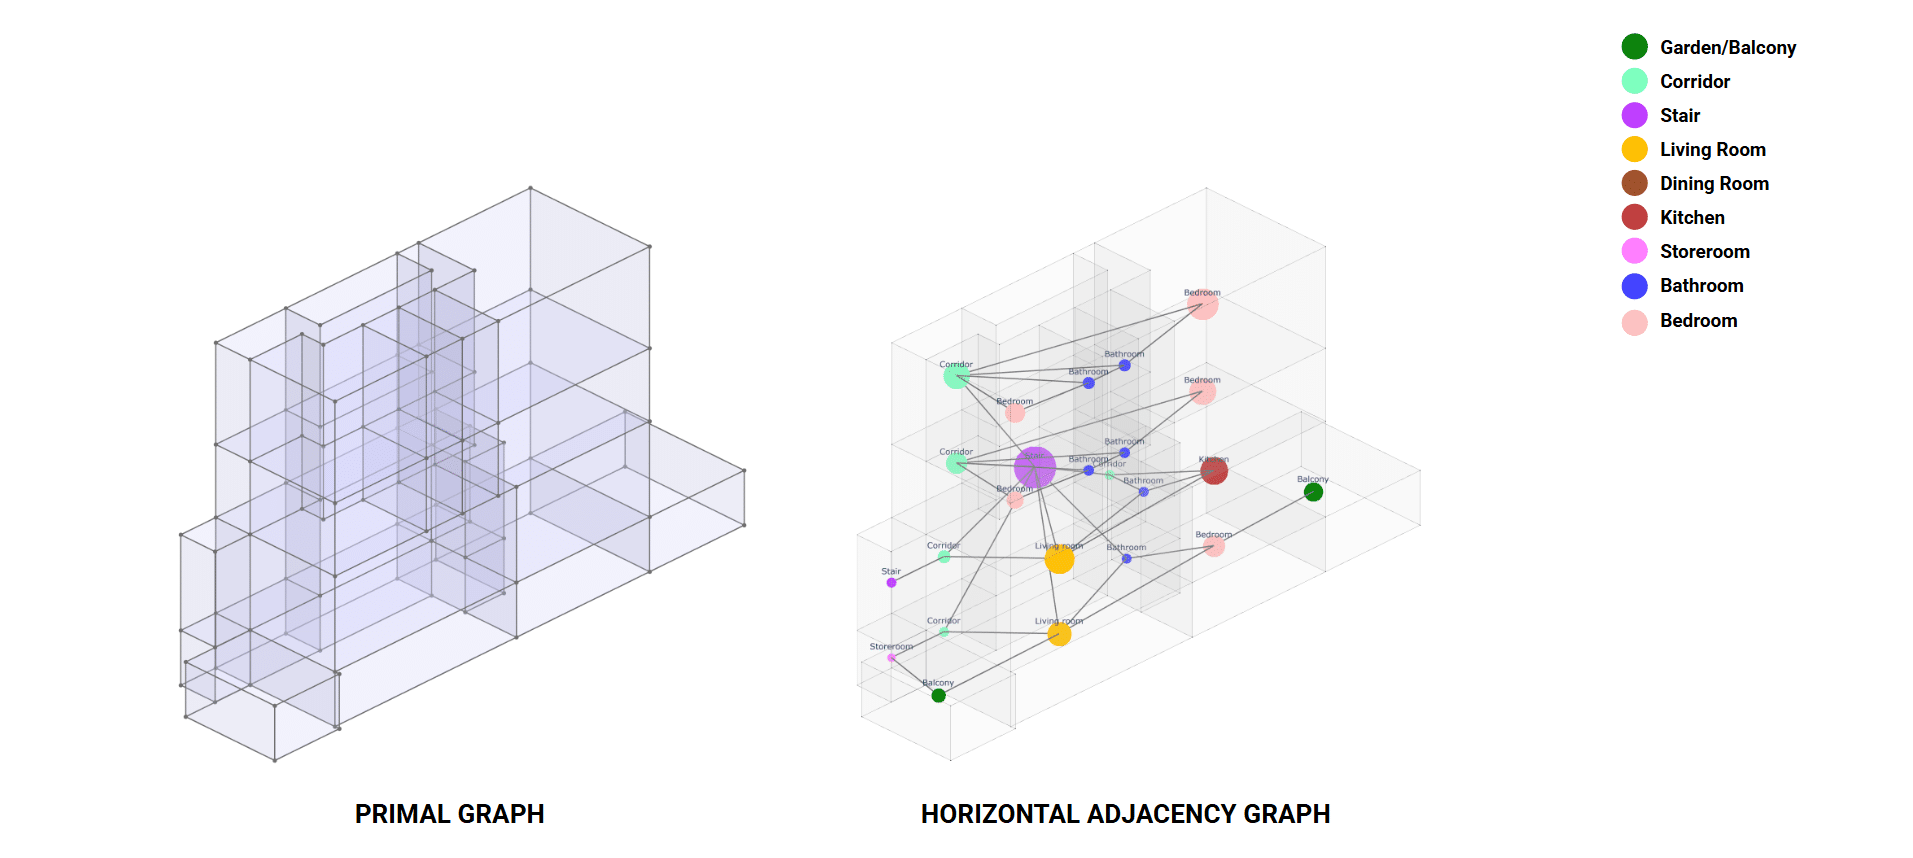
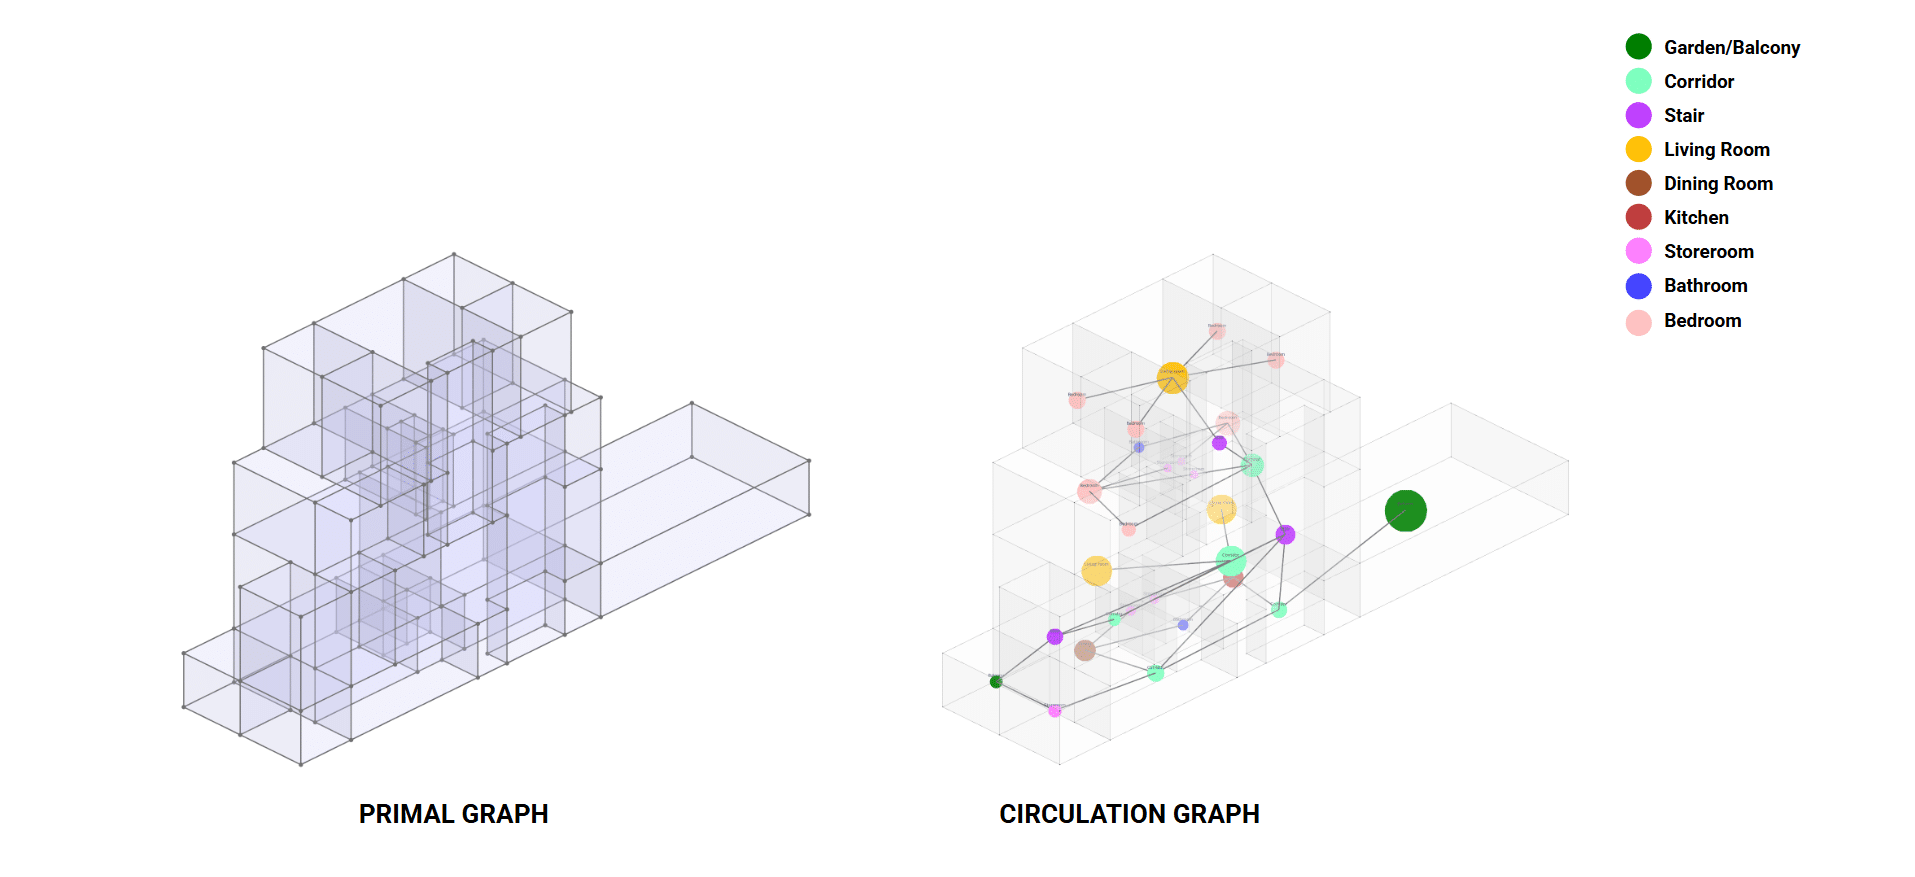
From the cell complex we extract graphs. The primal graph keeps the raw geometry. The horizontal adjacency graph turns each room into a node and connects rooms that share a wall on the same floor. You can already read the building socially: the stair is the big purple hub everything clusters around, bedrooms and bathrooms sit on the upper floors, living rooms and kitchen anchor the lower levels. Node size is scaled by room area.
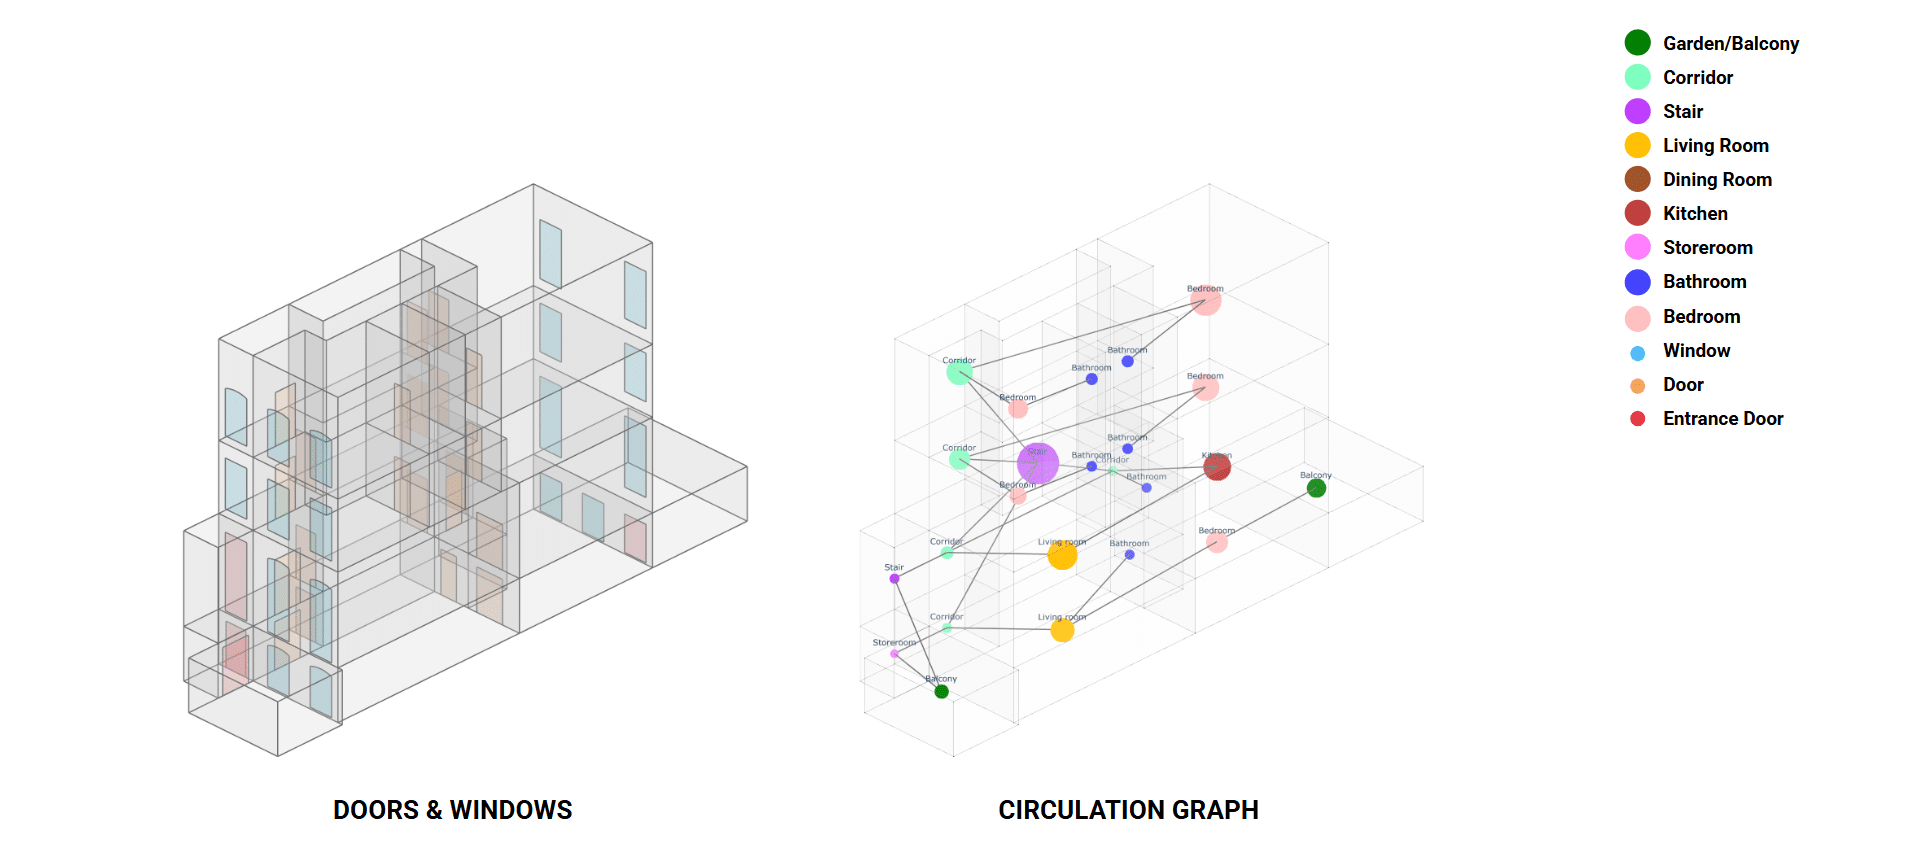
But adjacency isn’t how people actually move. So we use the apertures, doors and windows, to build a circulation graph: rooms are only connected if there’s a real opening between them. This is the graph that reflects lived movement through the apartment.
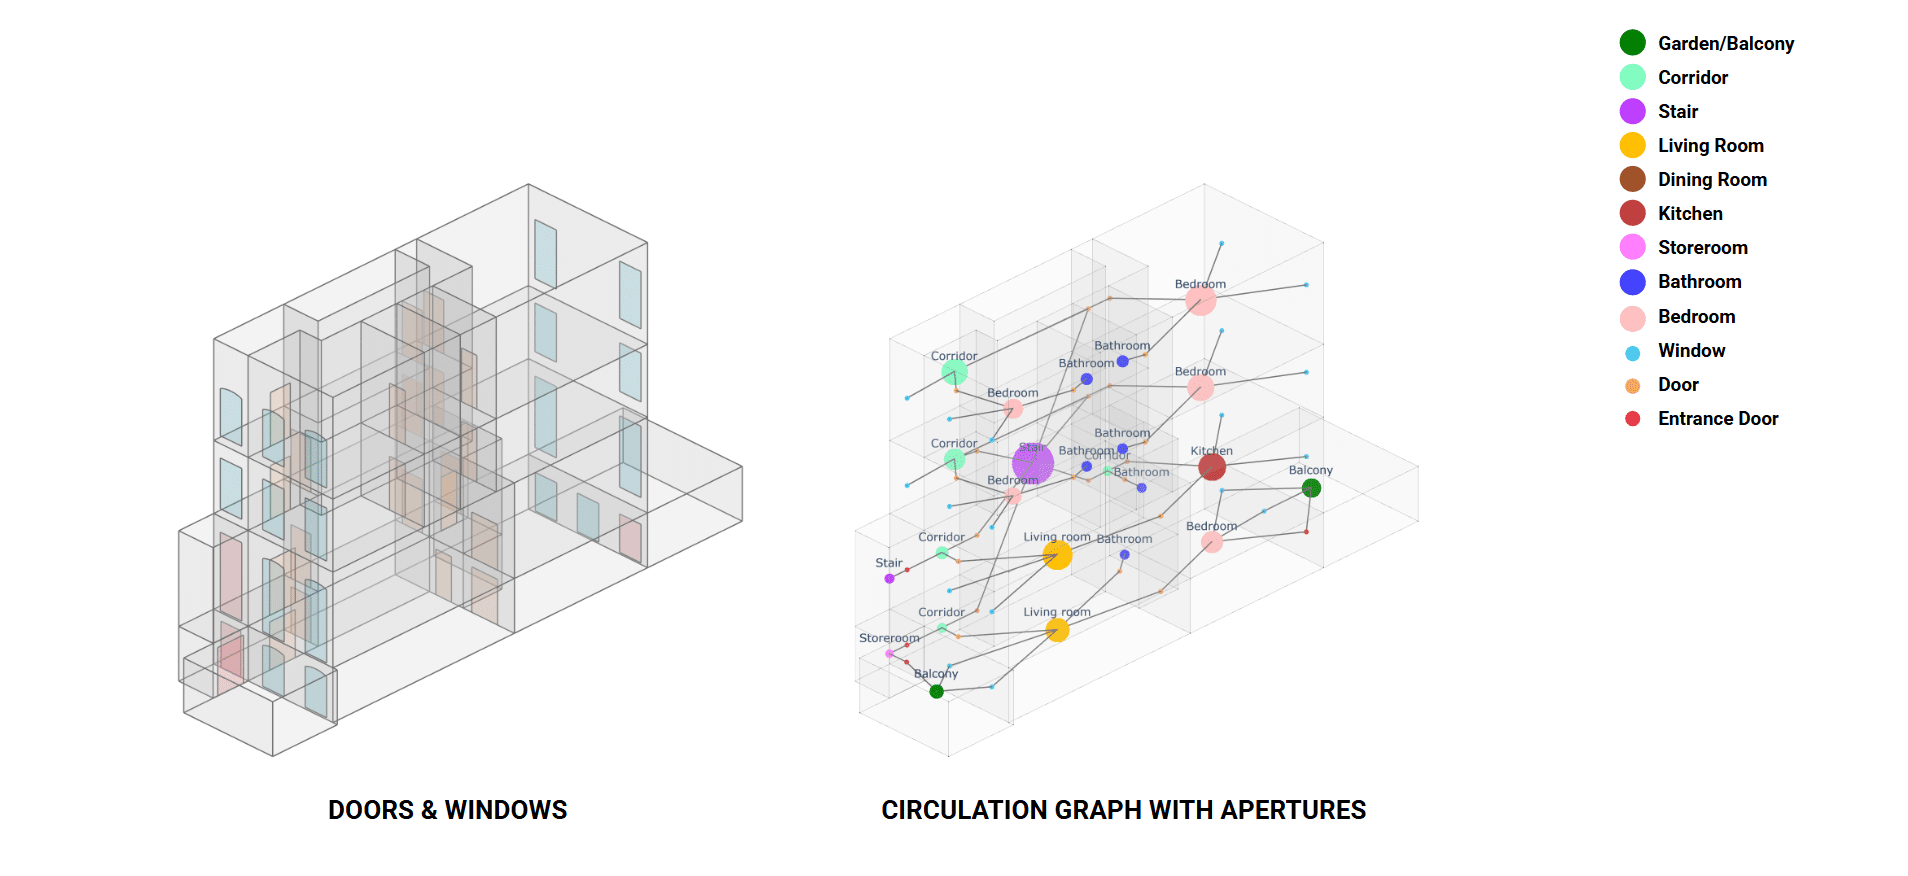
And this is the richest version, the circulation graph with apertures. Here the doors and windows themselves are nodes, sitting between the rooms they connect. So an edge isn’t just ‘these rooms are linked, it’s linked through this specific opening, a door, an entrance door, or a window.
Old Layout
We ran the same pipeline on the original single-family row house at 39 Grove Street, Greenwich Village, lower Manhattan. Brownstones varied by neighborhood and builder, and this is the one we chose. Since it dates to the early 19th century, mapping it to our cell complex took a few compromises. The front and back parlours become living rooms, and the entrance vestibule becomes a corridor. With both buildings sharing the same vocabulary, the two layouts are directly comparable.
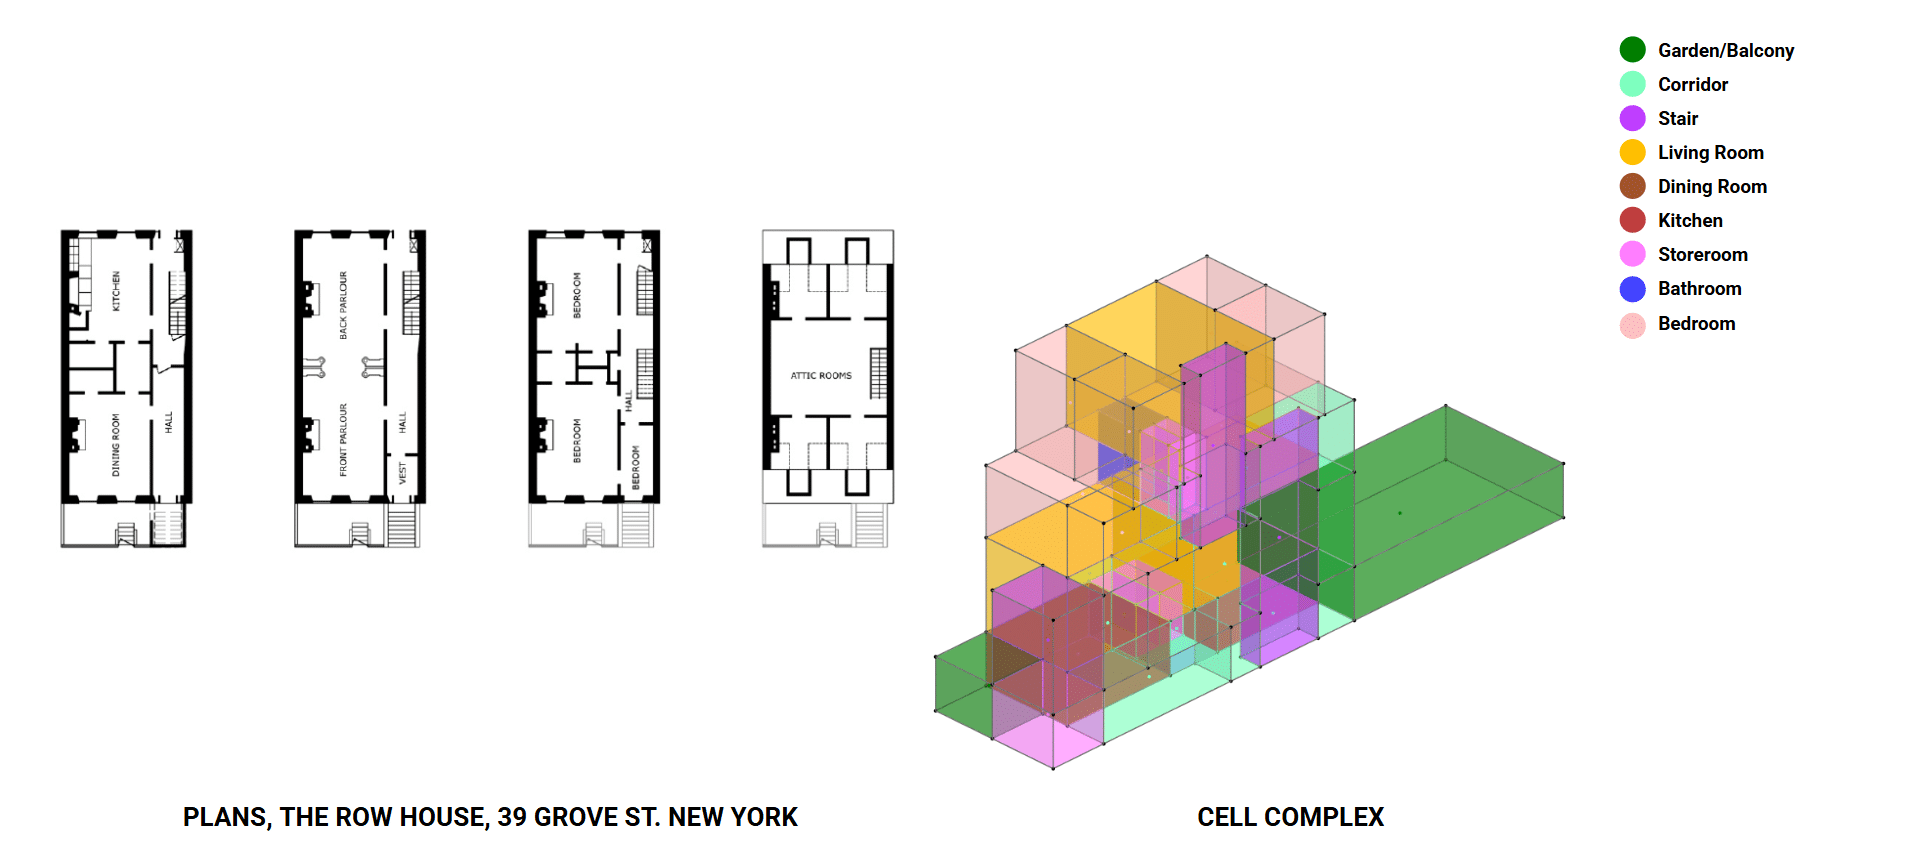
The old layout house has a very particular logic. It sits on a narrow, deep lot, so it grows vertically rather than horizontally, with one or two rooms per floor stacked around a single stair. The parlor floor holds the formal social rooms, the service spaces sit low, and the bedrooms stack above. That deep, layered organization is exactly what we will see later in the justified graph.
From Cell Complex to Graphs
We first build the primal graph to distinguish the individual units, then proceed to the circulation graph. We paid special attention to the entrance sequence, modeling two independent access points: one rising from the street up the stoop to the first floor, and a separate one entering the ground floor through the storeroom. This distinction matters, because these houses are still defined by the relationship between the stoop and the street.
That double entrance is not a detail, it is the social logic of the brownstone. The raised stoop leads to the parlour floor, the formal public face of the house where guests were received, while the lower ground floor entry was the everyday, service entrance for the family. By giving the graph two separate roots, we capture that hierarchy of arrival directly in the topology, rather than flattening the house into a single front door.
This is also where the old and new layouts begin to diverge. In the original single family house, those two entrances still serve one household, so they feed back into the same circulation spine. In the redesign, that same threshold logic gets reused to give different units their own independent access, which is the first structural sign of the move from single family toward shared living.
And the stoop itself carries meaning well beyond circulation. It is the in between space where private home meets public street, the place where, as in Spike Lee’s film, life spills out onto the steps. So when we model it as its own access point, we are not just being accurate about the geometry, we are preserving the one space that makes the brownstone read as a brownstone.
Comparison
Justified Graph
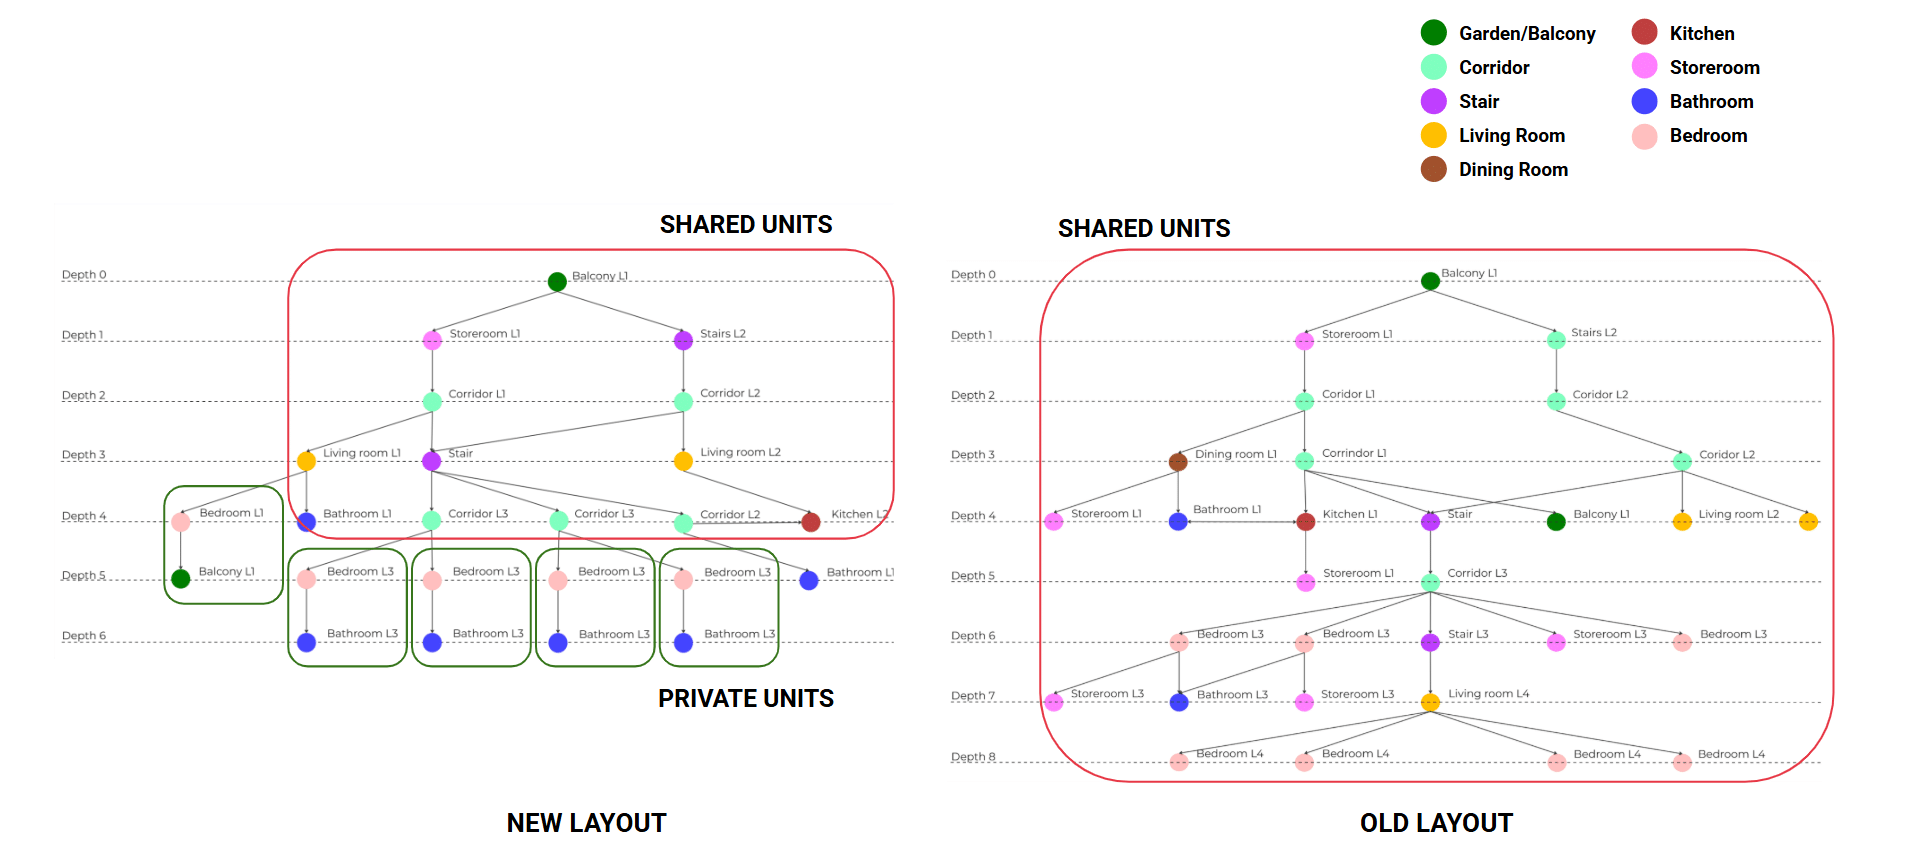
A justified graph takes the circulation graph and redraws it by depth from the entrance. The entrance sits at the top, at depth zero, and every other room is pushed down to a level that reflects how many steps it takes to reach it. So instead of reading geometry, you read accessibility and hierarchy directly.
In the new layout, the shared spaces, the balcony, the stairs, and the corridors, sit high up near the entrance. Then the plan branches out, and at the bottom we see private pods, each one a bedroom paired with its own bathroom, boxed off on their own. Those are independent units. The graph is wide and shallow, and it visibly separates what is shared from what is private.
In the old layout, everything is gathered into one deep tree that runs all the way down to depth eight. There are no separate private branches, because there is only one household. You move through the house in a single long sequence, from the public parlor rooms down to the private bedrooms, all threaded through one continuous spine.
So the justified graph shows, in a single picture, that the redesign has restructured the entire hierarchy of the building and the corresponding privacy levels. The old house is one deep, private chain. The new one is a shallow, shared armature with private units hanging off it. The shadow organization of the new layout offers efficacy and clarify in the communication while the deep organization of the old layout offers more privacy of the livings units.
Node Degree
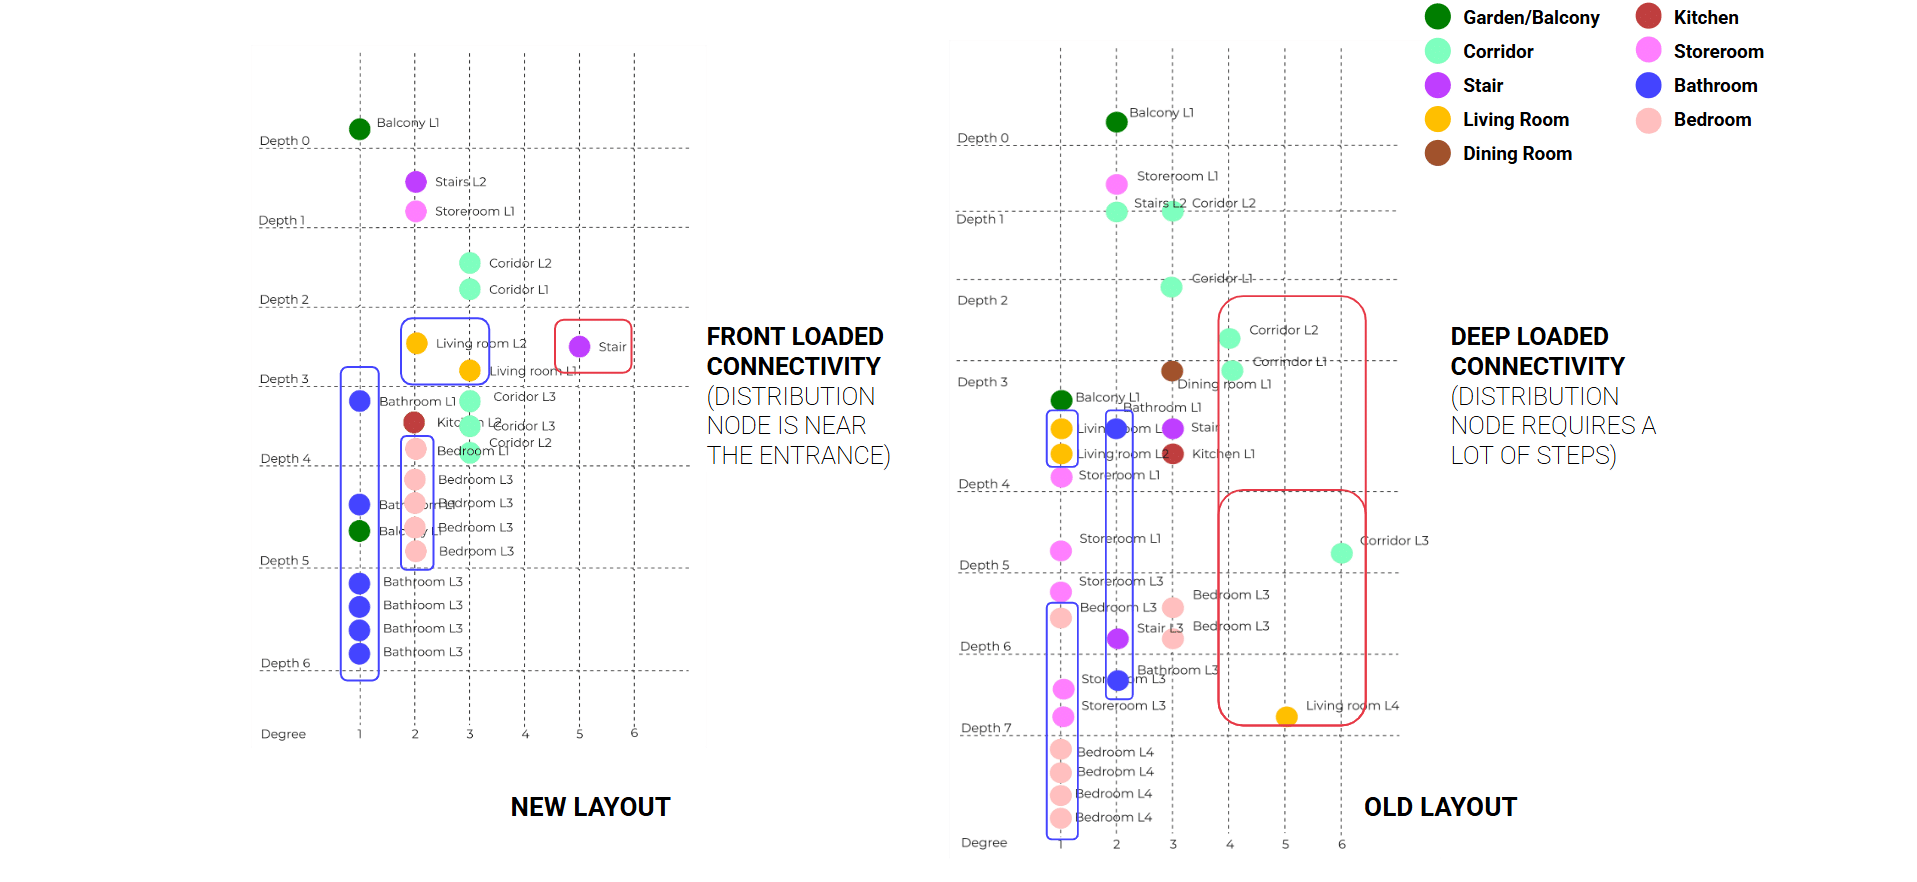
In the new layout the connectivity is front loaded. The high degree distribution nodes sit near the entrance, at shallow depth. That means as soon as you walk in, you reach the connective core of the building almost immediately, and from there you can branch off to any unit. That is exactly how shared living wants to work, quick and equal access for everyone. Since the distribution node is centraled it can become a potential bottleneck.
In the old layout the connectivity is deep loaded. The distribution nodes sit far down the graph, so you have to take many steps before you reach the part of the house that connects everything together. Movement is sequential and controlled, which is the natural logic of a private single family home where you pass through the household’s spaces in order.
So front loaded versus deep loaded is really a signature of shared versus private. The redesign pulls the connective heart of the building up toward the entrance.
Spatial Analysis
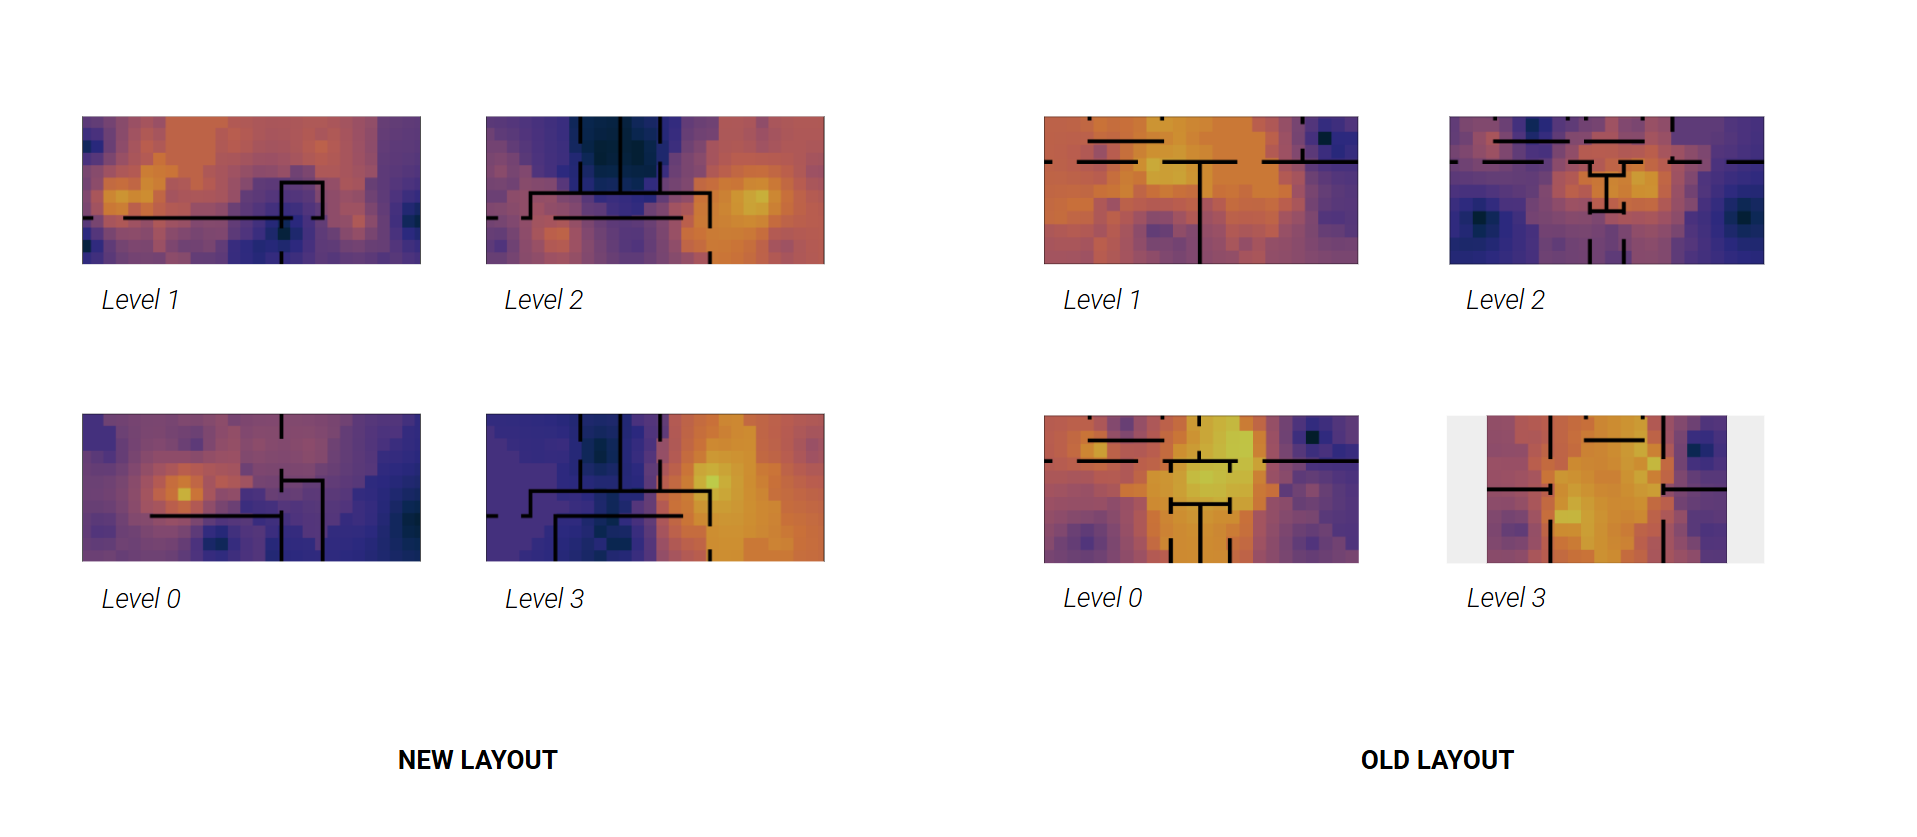
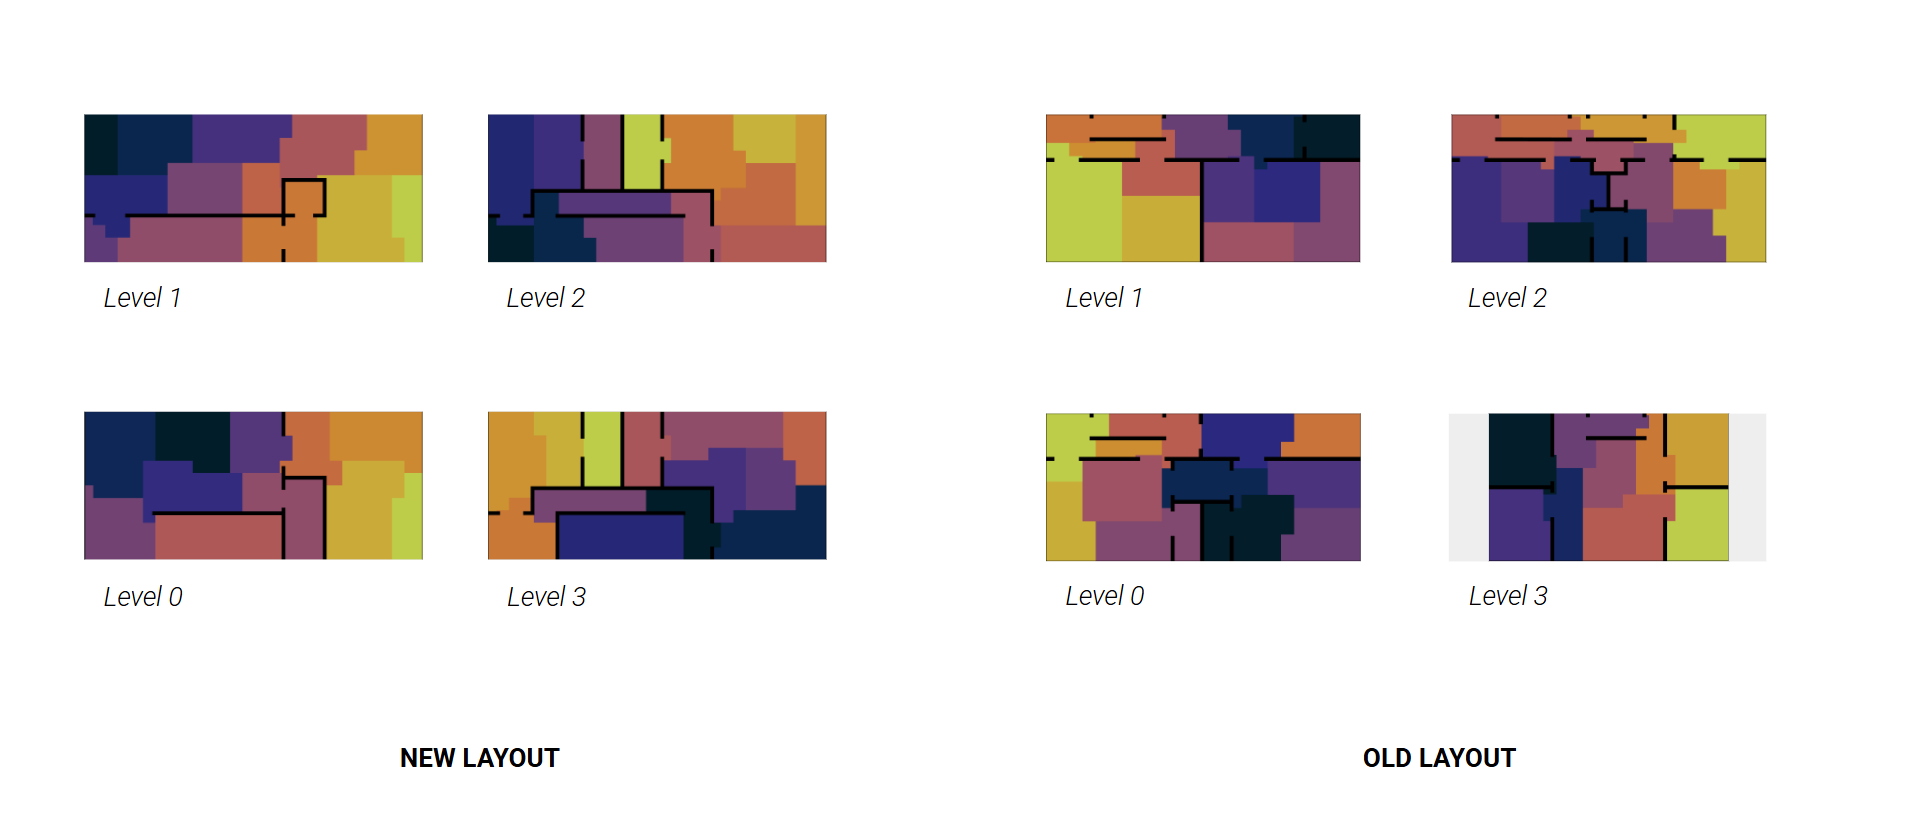
Closeness Centrality by Floor
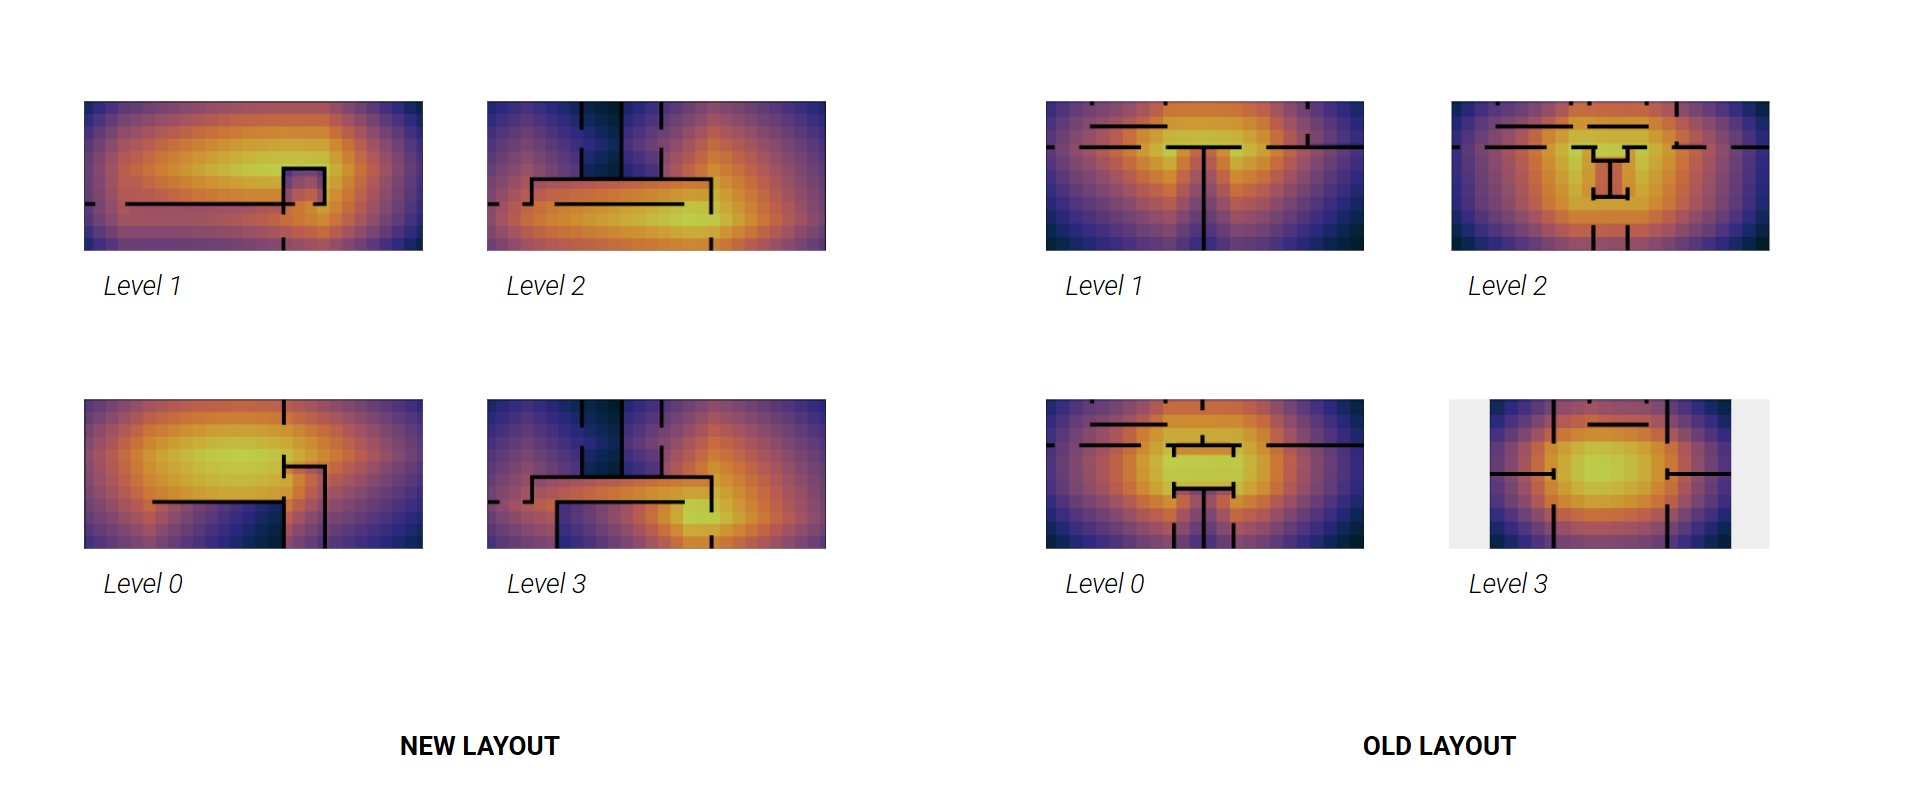
Closeness measures how easily a cell reaches every other cell, so the warm zones are the most accessible parts of the plan. In the new layout the accessible zone is broad. It sits large and centered on the lower floors and then shifts toward a corner as you go up, the signature of a building that is open and shared at the bottom and increasingly private toward the top. In the old layout the accessibility concentrates instead into a central band on every floor, decaying outward so the corners stay the coldest cells throughout. Because several main rooms can be entered through two doors off the same corridor, that core gains loops rather than dead ends, which keeps the plan permeable even though its peak stays central.
Closeness Centrality Across All Floors
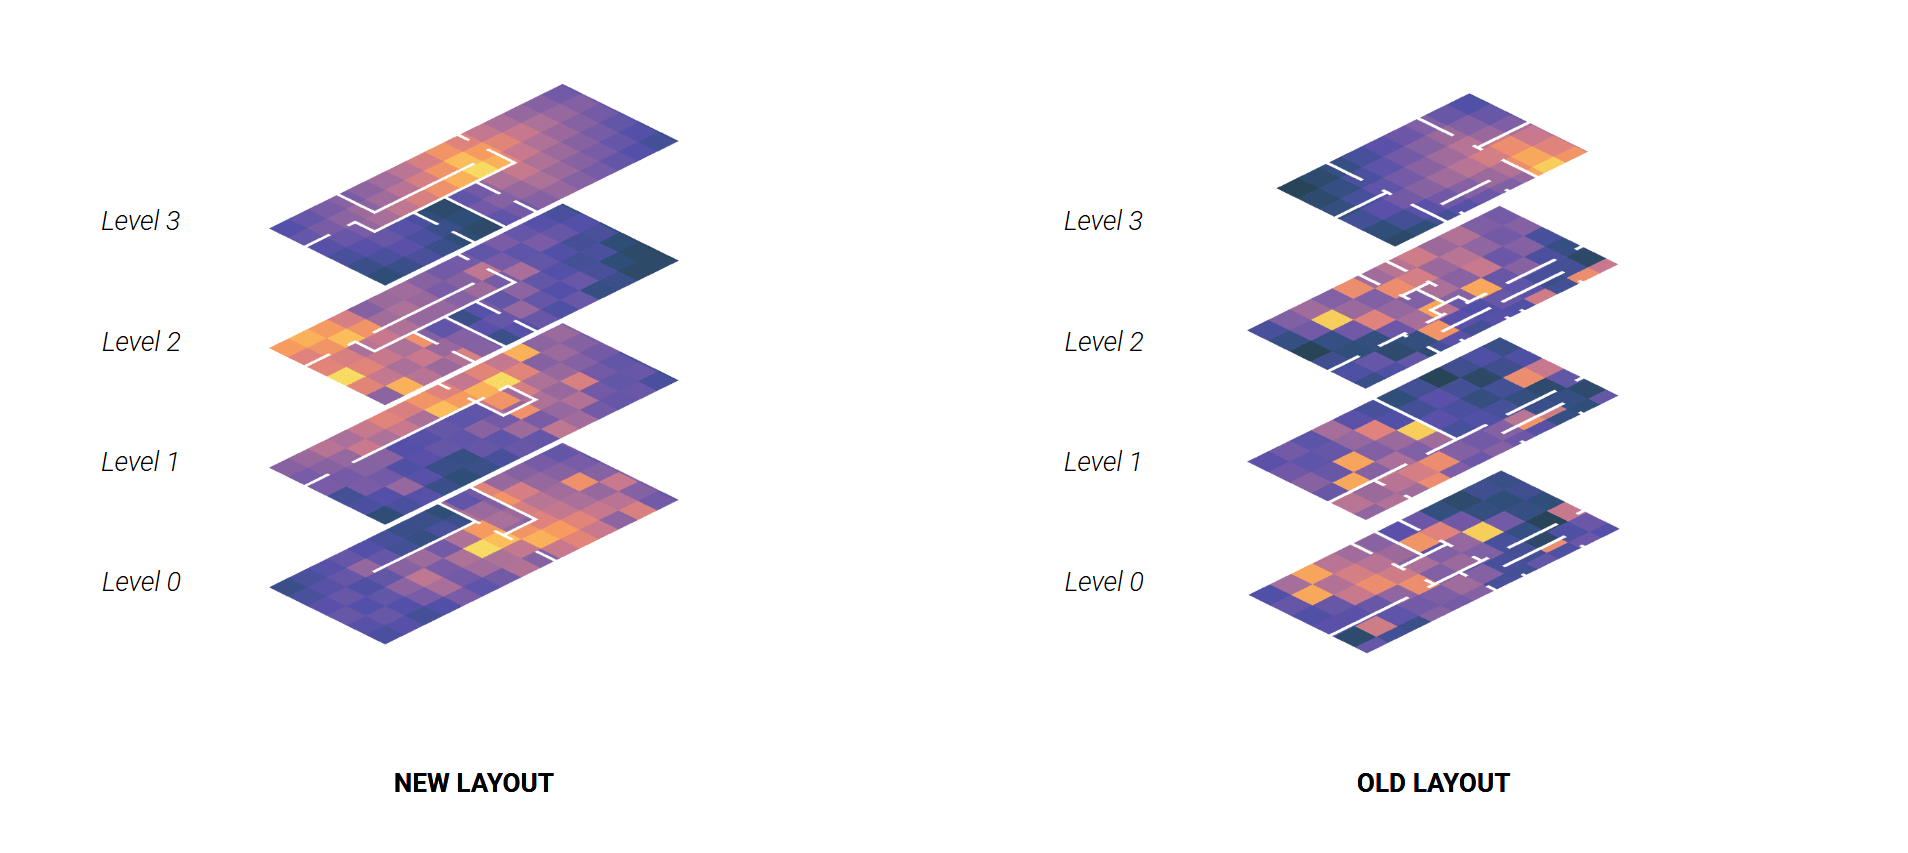
Stacked across all four levels, the difference holds. The new layout keeps accessibility broad and continuous, carried through its corridors and shared stair from floor to floor, while the old layout breaks accessibility into separate central pockets, one isolated warm core per level.
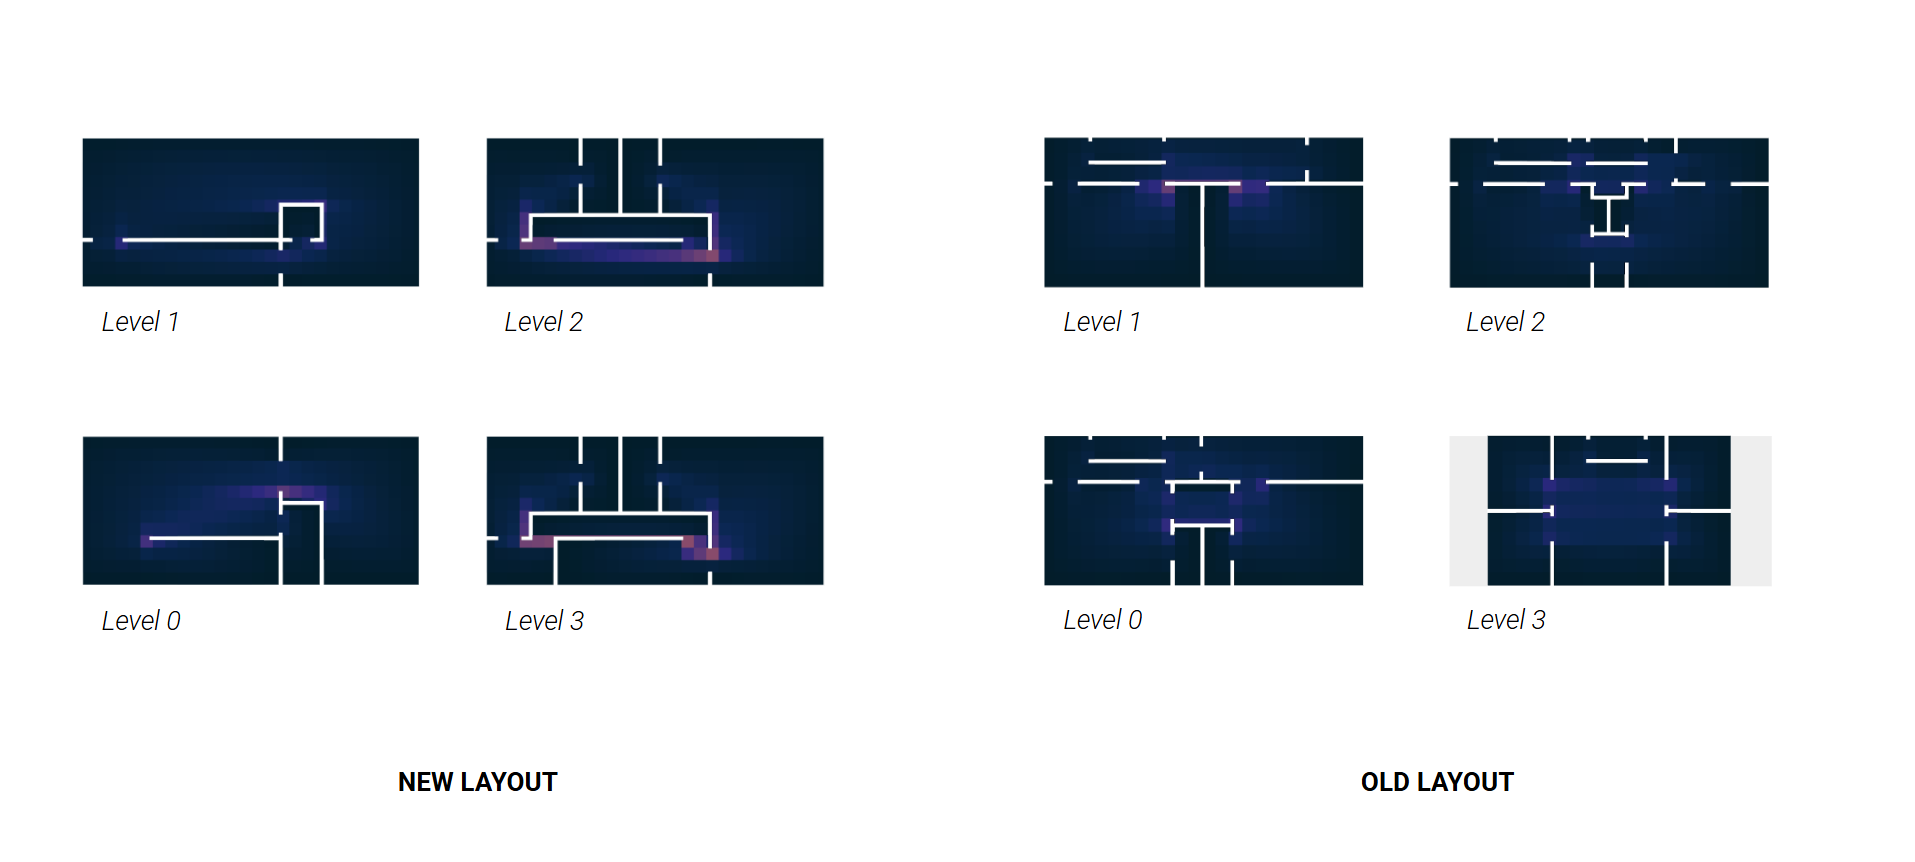
Betweenness Centrality by Floor
Betweenness Centrality Across All Floors
Betweenness marks through-movement, the cells that the most shortest paths run through. In the new layout it lights up as bright lines along the long shared corridors and the stair, a connective network threading each floor. In the old layout it pools instead into a compact bright spot at the central hall on each level, the single point everything passes through.
Stacked vertically, the new layout reveals a continuous connective spine climbing through the corridors and stair that ties the levels together, while in the old layout the through-movement stays trapped in separate central pockets that never link into one vertical path.
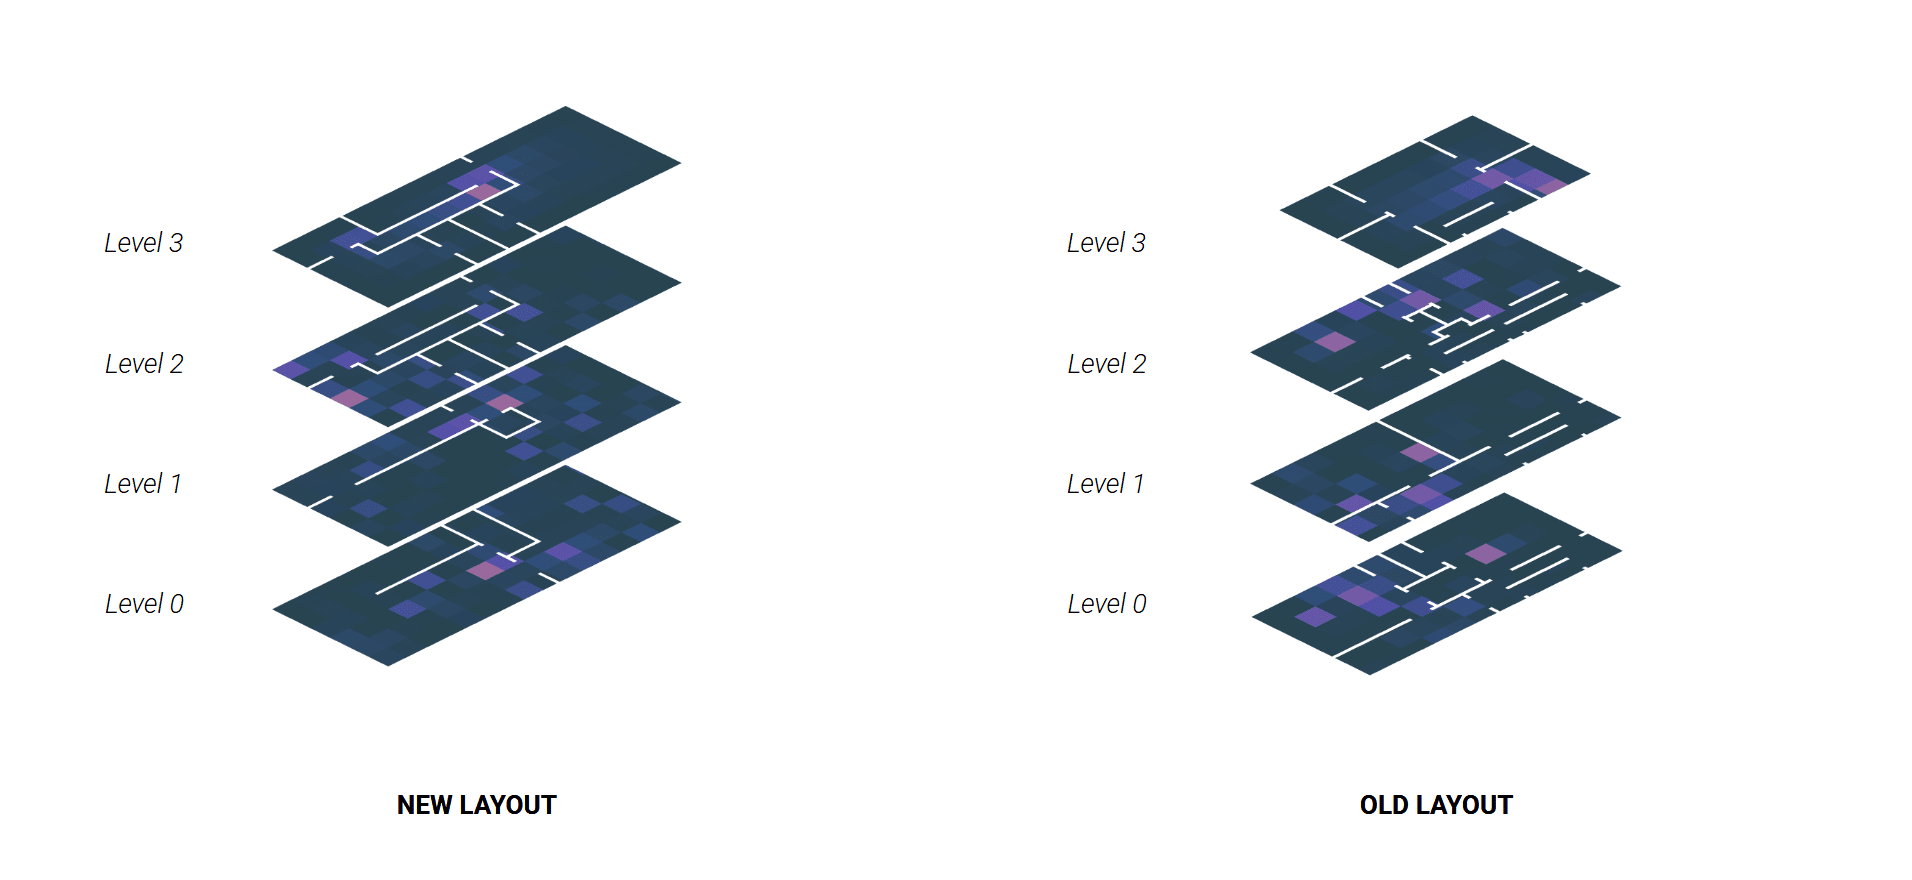
Degree Centrality
Degree centrality counts how many rooms each space directly touches, so the bright zones are the local hubs of each floor. In the new layout these hubs are spread out, shifting position from floor to floor and stretching along the shared corridors, so connectivity is dispersed and every part of the plan has a hub nearby. In the old layout the hubs stay pinned to the same central zone on all four floors, reinforcing one privileged core.
Closeness and degree tell the same story. The new layout spreads access across its corridors, while the old layout concentrates it in a central core. Betweenness adds the one important caveat. Even though access is dispersed, all of the vertical through-movement in the new layout funnels onto the single shared stair, the spine that stitches the stacked private units together. So the new building distributes everyday connection but hangs on one shared vertical thread, which is exactly what a stack of independent units around a common stair should look like.
Community Detection
Community detection groups rooms that are more tightly connected to each other than to the rest of the building, using only the connections. In the new layout it finds several clean, distinct communities on each floor that line up with the independent units we already saw in the justified graph, so without being told anything about sharing, the algorithm rediscovers the separate living groups from the topology alone. In the old layout the communities bleed together into fewer, larger blocks that read as one continuous household, because there is no underlying separation to find. So community detection independently confirms the core claim, the new layout is genuinely organized as multiple units and the old one as a single home.
Graph Machine Learning
The goal here is room type classification, teaching a model to predict what kind of room each space is.
First we have to encode the building for a graph neural network. Each of our 27 cells becomes a node, and each node is described by just seven numbers, a four value zoning one hot and a three value connectivity one hot. The 25 openings between rooms become the edges, each typed as a passage, a door, or an entrance door.
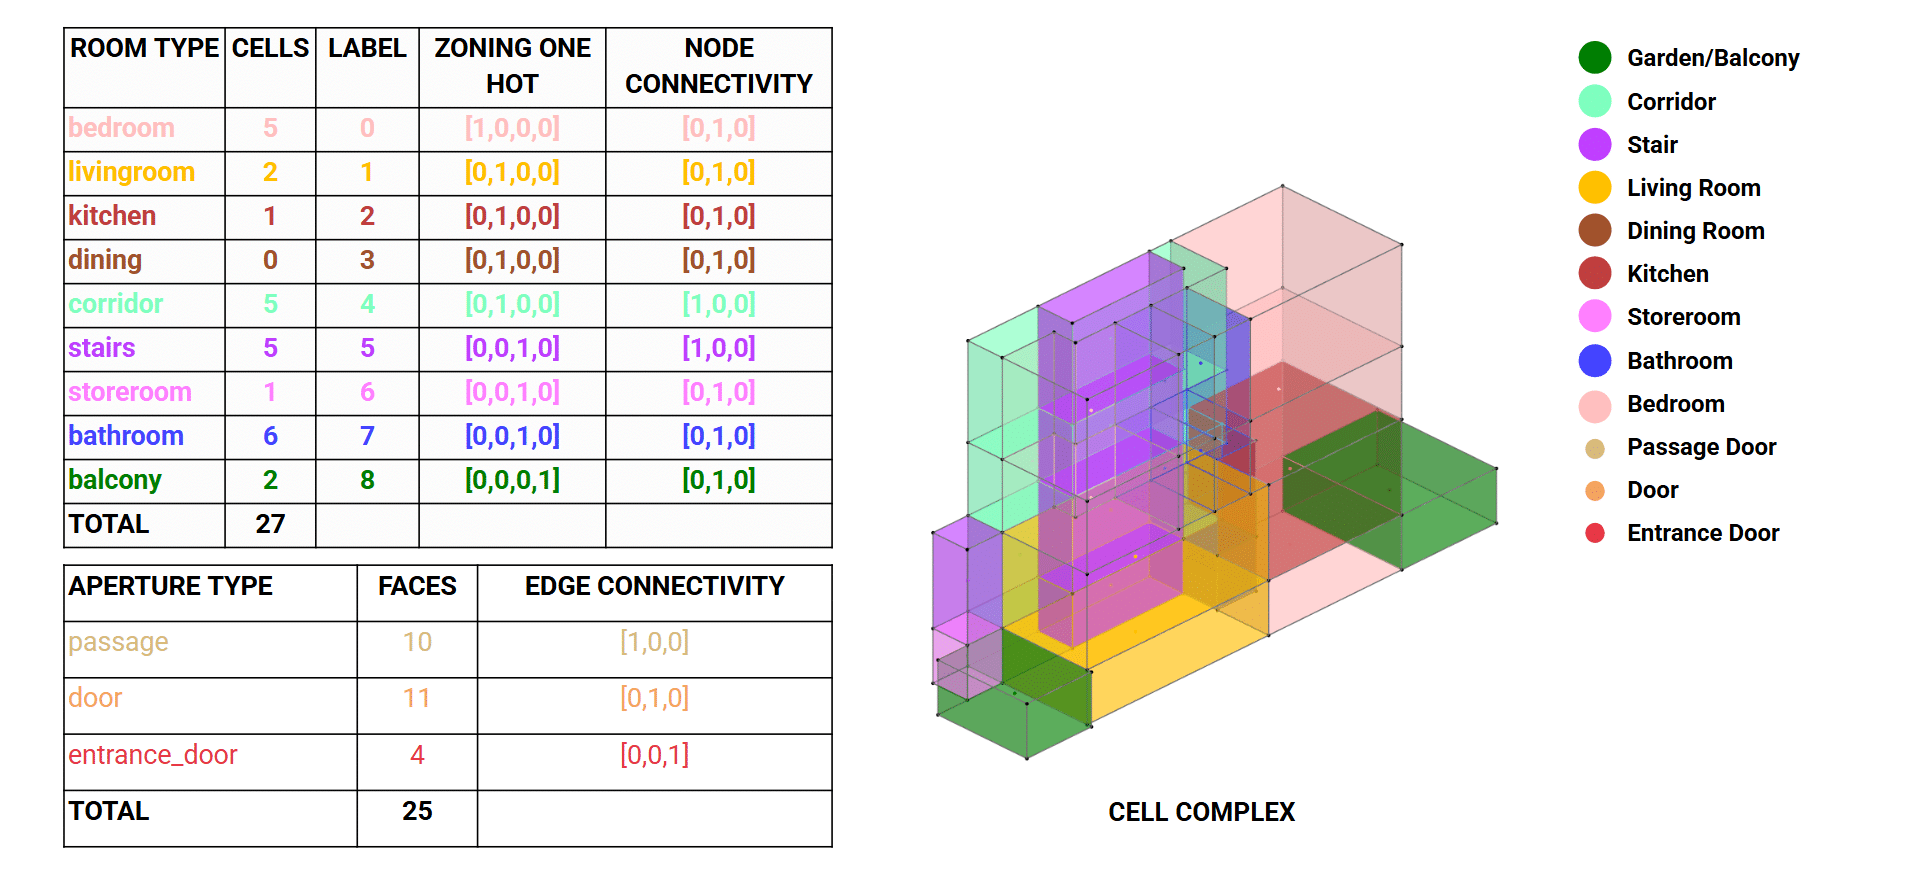
There is one deliberate catch in this encoding, and it is the key to everything that follows. The zoning vector does not identify rooms uniquely. Living room, kitchen, dining, and corridor all share the same zoning code, and stairs, storeroom, and bathroom share another. So the node features alone literally cannot tell these rooms apart. To distinguish a kitchen from a corridor, the model has no choice but to learn from how each room connects to the rest of the building, from the graph structure itself. That is precisely the situation where a graph neural network should shine, and it is also where we expect it to struggle, because we have intentionally made these rooms ambiguous on their features.
Then we used a pretrained classifier over every node in the new layout and read off the results one room at a time.
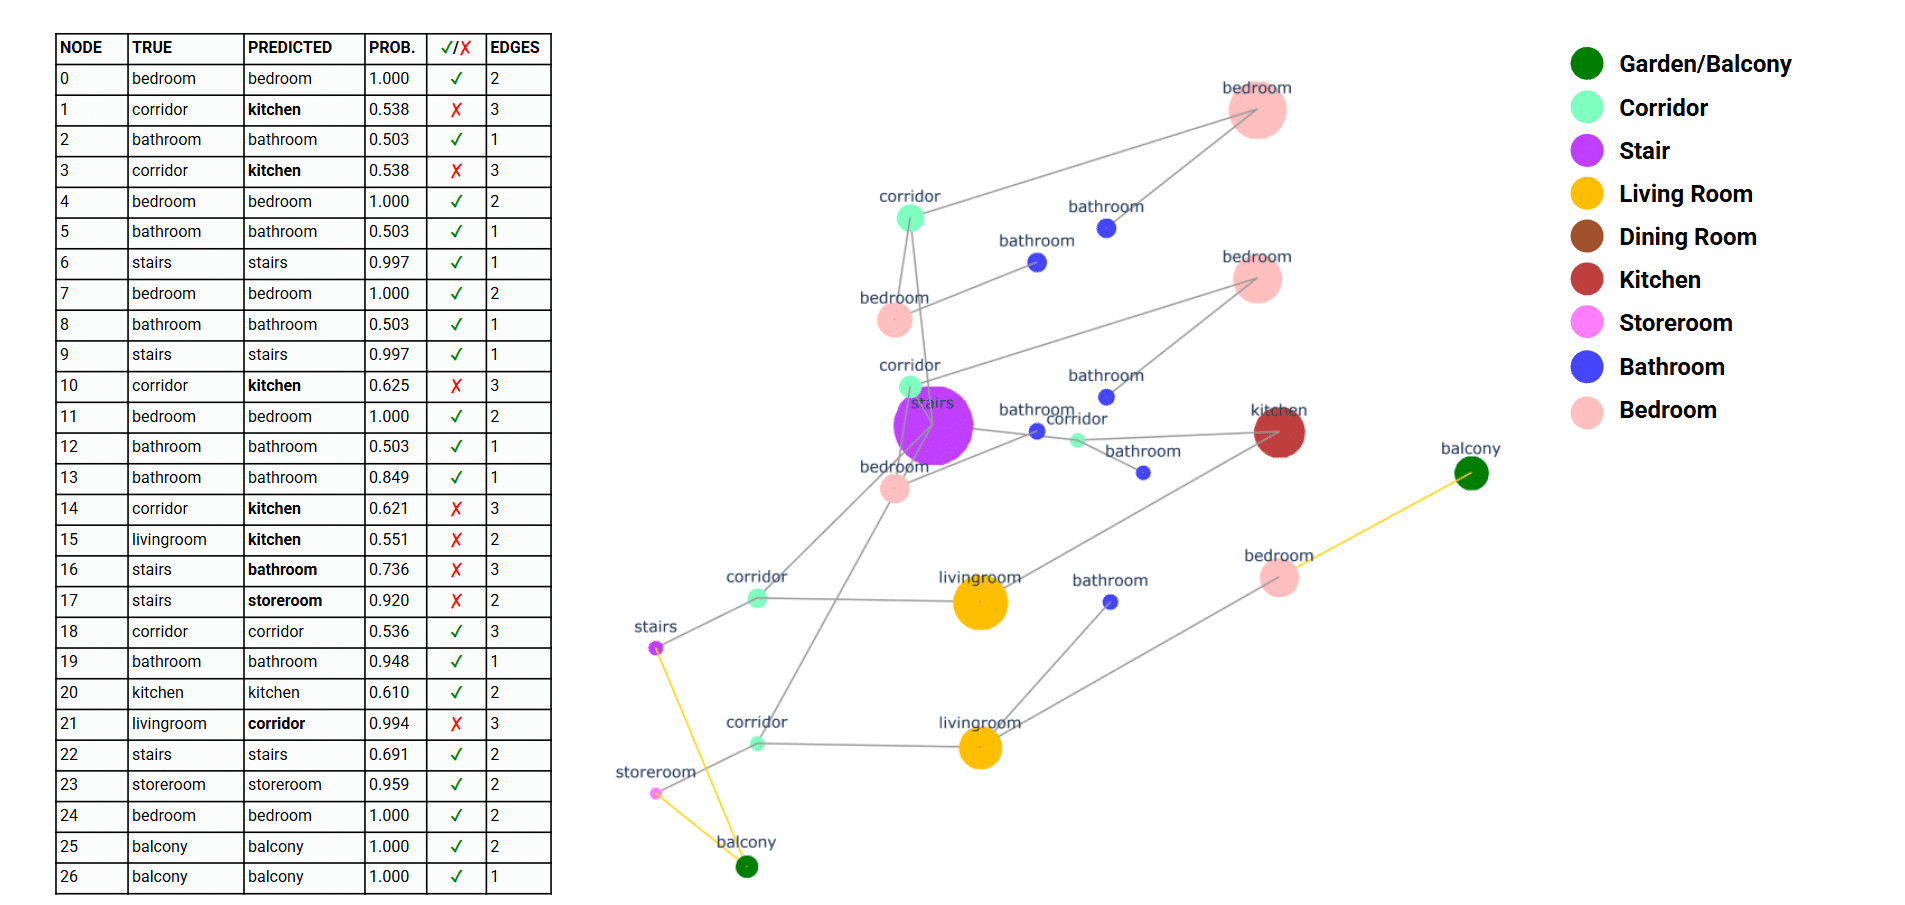
Each row shows a room, its true type, the model’s prediction, the confidence of that prediction, and how many edges it has. The pattern in the confidence column is the interesting part.
The rooms the model gets right, it is very sure about. Bedrooms, stairs, and balconies come back at confidences of 0.99 to 1.0, because these rooms have a distinctive signature in the graph. The rooms it gets wrong are exactly the ones where confidence collapses into the 0.5 range, right at the edge of guessing. So the model is, in a sense, honest. It is uncertain precisely where it is about to make a mistake, and those mistakes are concentrated in the ambiguous, feature sharing rooms we explained previously.
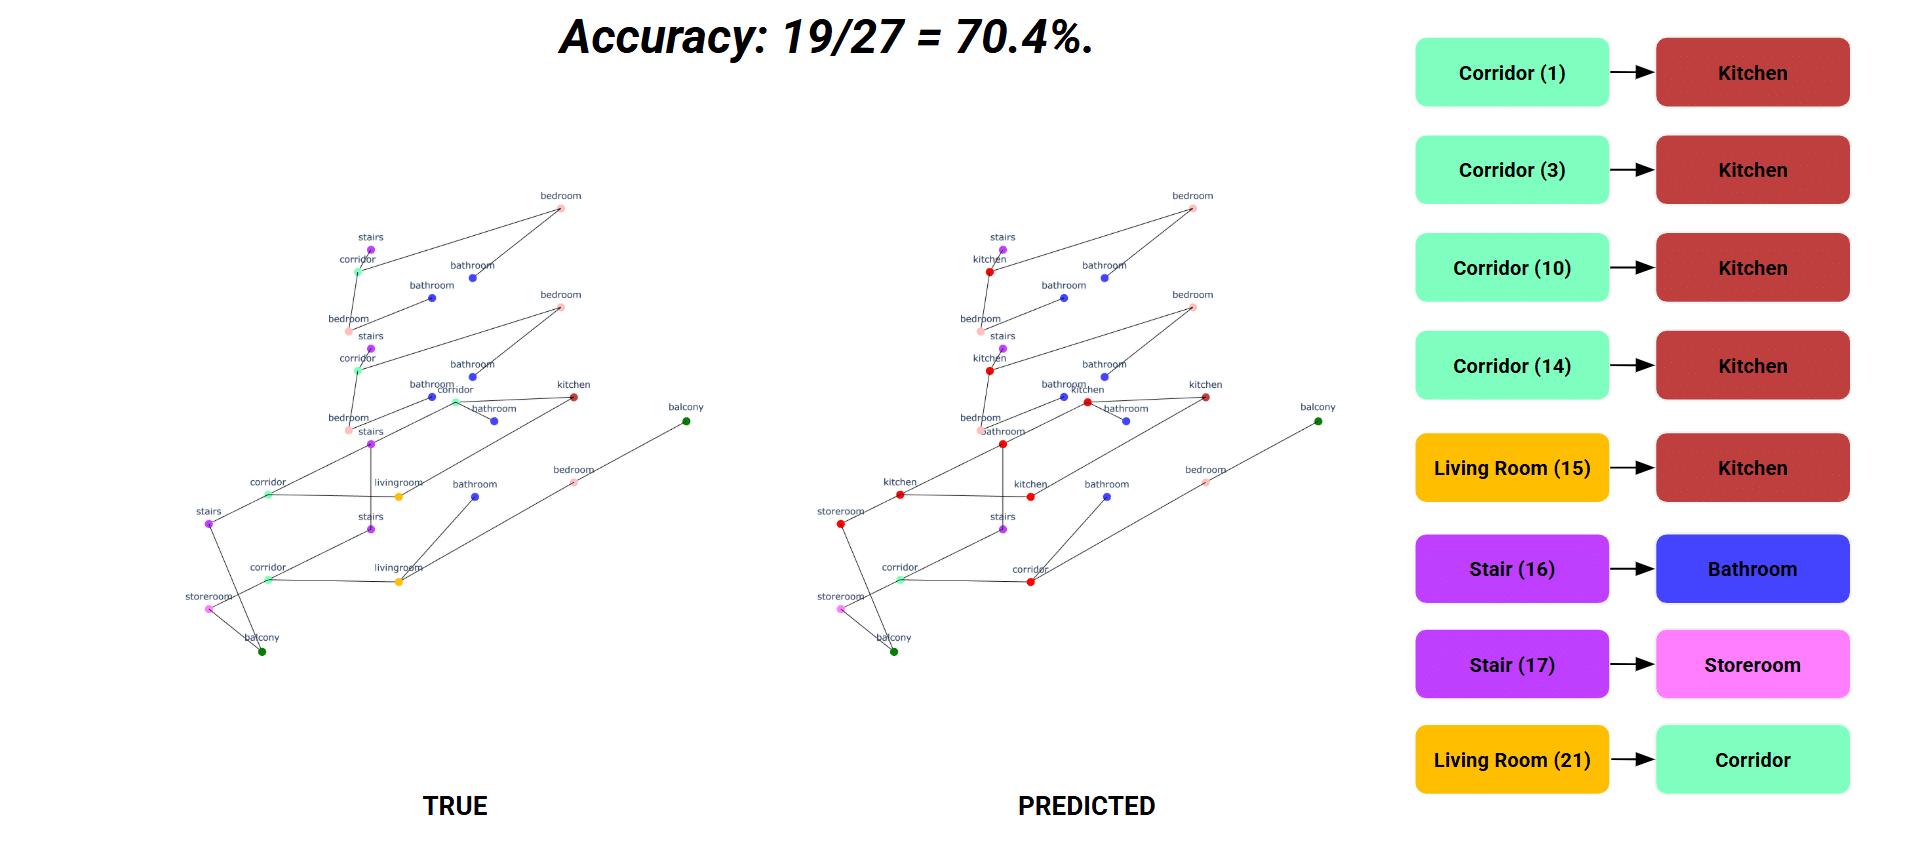
Overall the model scores 19 out of 27 correct, an accuracy of 70.4%.
On the left is the ground truth graph, on the right the predicted one, and the list on the side enumerates every error the model made. Now look at what those errors actually are. Four corridors predicted as kitchens. A living room predicted as a kitchen. Stairs predicted as a bathroom and as a storeroom. A living room predicted as a corridor.
Every single mistake is a connector space or a shared space. Not one bedroom is misclassified, not one balcony. The errors fall entirely on corridors, living rooms, and stairs, which are exactly the rooms that share zoning codes and can only be told apart by connectivity. When two rooms look identical on their features and sit in similar positions in the graph, the model cannot separate them, and it confuses them.
Conclusion
To conclude, both halves of our project point in the same direction. The spatial graph analysis and the machine learning agree.
Through justified graphs, centrality, and community detection, we showed that the redesign restructures the brownstone from one deep single family chain into a shallow shared armature with independent units. And through the graph neural network, we saw that the only rooms the model struggles with are the shared, in between spaces, the corridors, the stairs, the thresholds, which are precisely the spaces that carry the meaning of communal living.
So the brownstone moves from a single family layout toward shared living of multiple single units, and the spaces that define that shift are the negotiable ones, the stoop and the corridor, where private home meets shared life. The stoop is the place where the building meets the street and the household meets the city.