Location: Piazza Guglielmo Marconi 42100 Reggio Nell’ Emilia, Italy
Architect: Santiago Calatrava
Year: 2002-2014
Material: White steel
00_ABSTRACT
The aim of the exercise is to recreate a parametric facade. First, we extract the geometry logic
behind the facade and then we use computational tools in order to modeling the building.
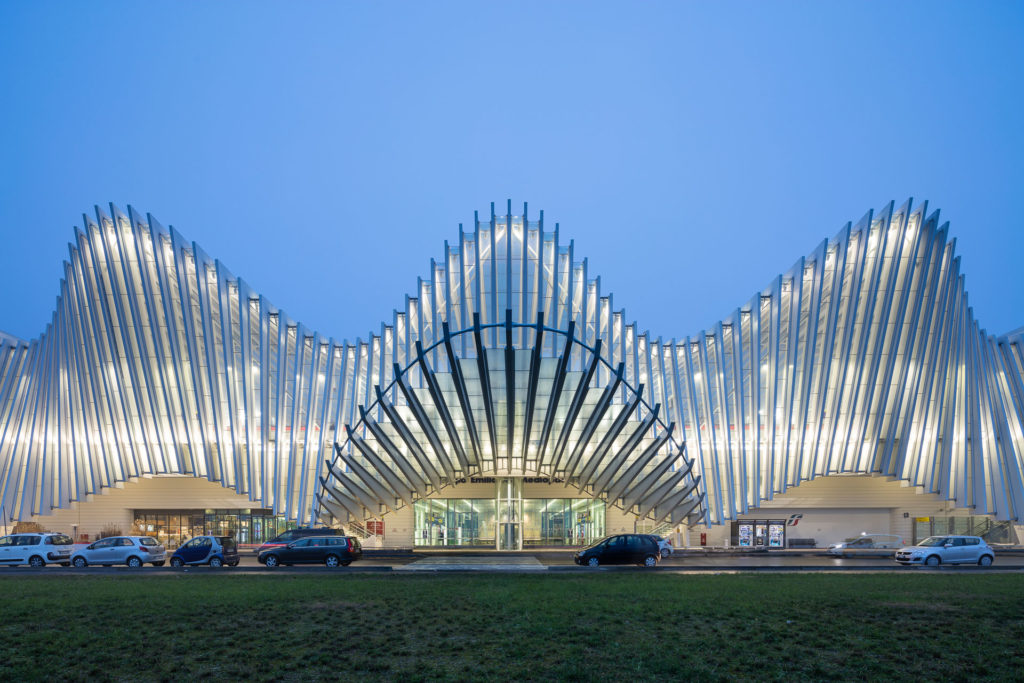
Source: https://calatrava.com/projects/reggio-emilia-stazione-mediopadana-reggio-emilia.html?view_mode=gallery&image=1
01_ INTRODUCTION
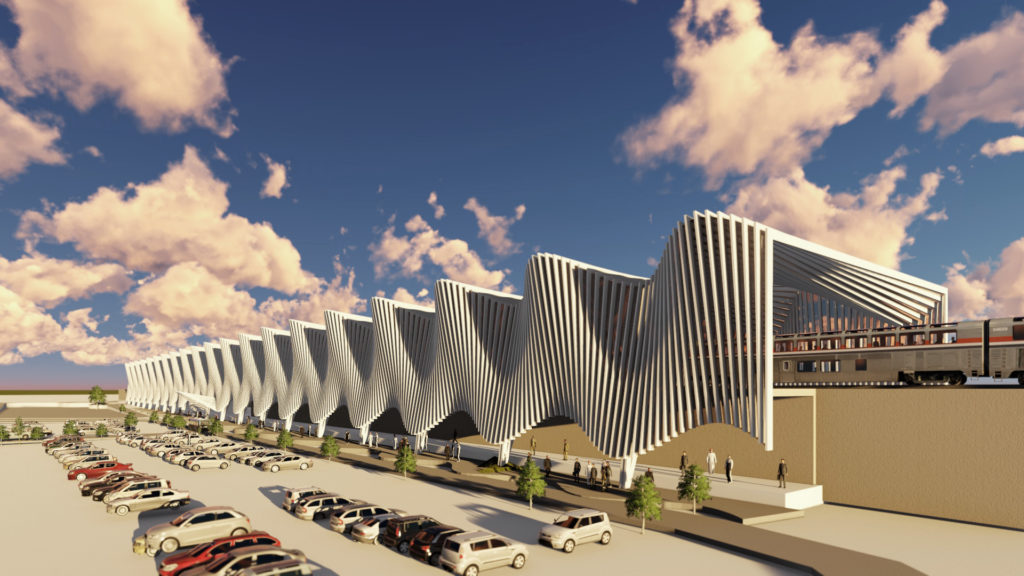
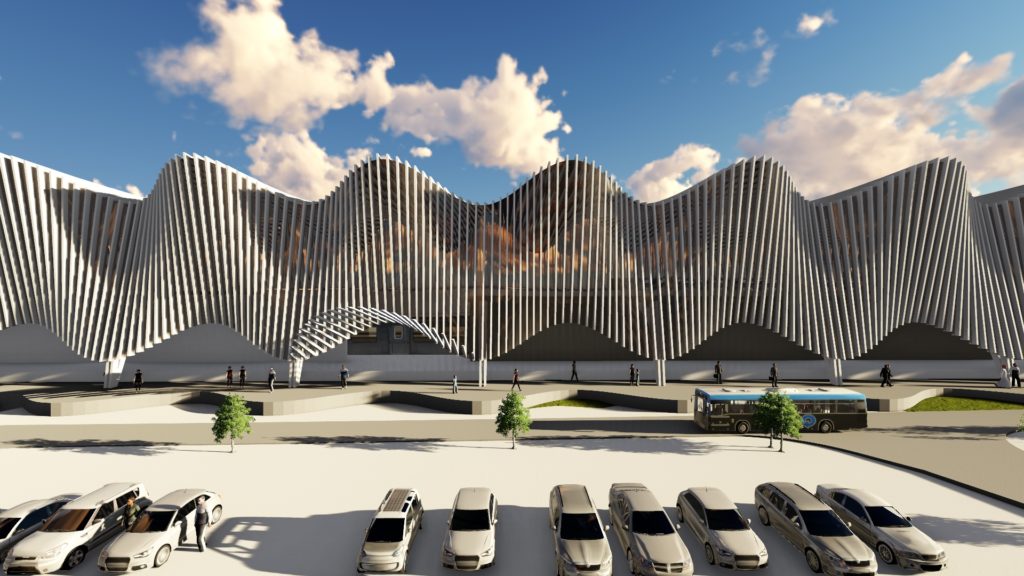
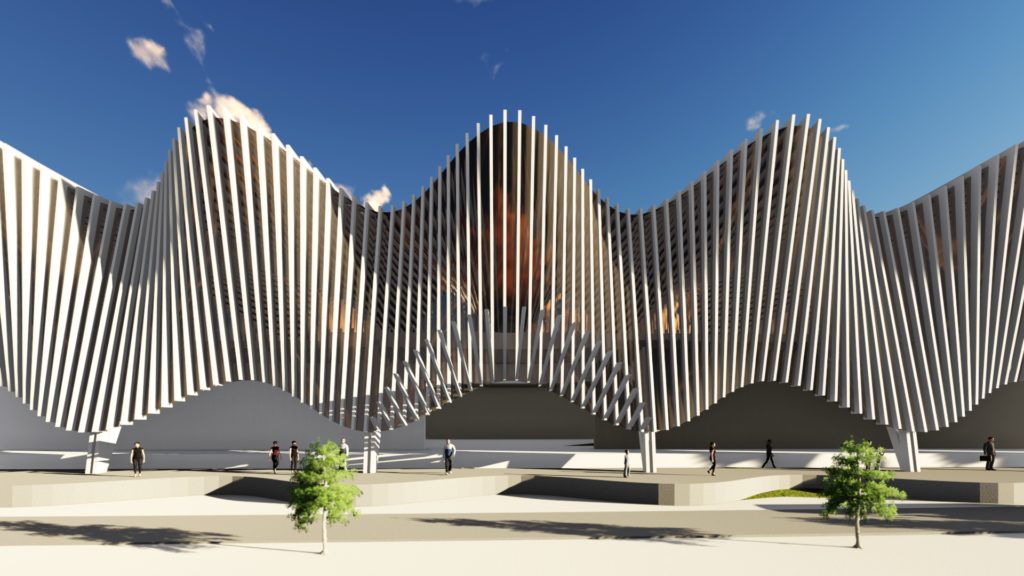
The new station was developed according to the constraints of the existing viaduct and the high-speed railway track at 500 meters in length, the design brief called for the canopy and platforms to be constructed independently from the current viaduct. The repetition of a 25.4-meter long module consists of a succession of 25 steel portals spaced approximately one meter apart. The repetition of the sequence reaches the total length of 483 meters, which creates a dynamic wave effect. The wave lines on both the floor plan and elevation give rise to a three-dimensional sinusoidal volume. The glass canopy and façade, realized by placing the laminated glass between the portals by means of an aluminum frame covers the entire length of the platforms.
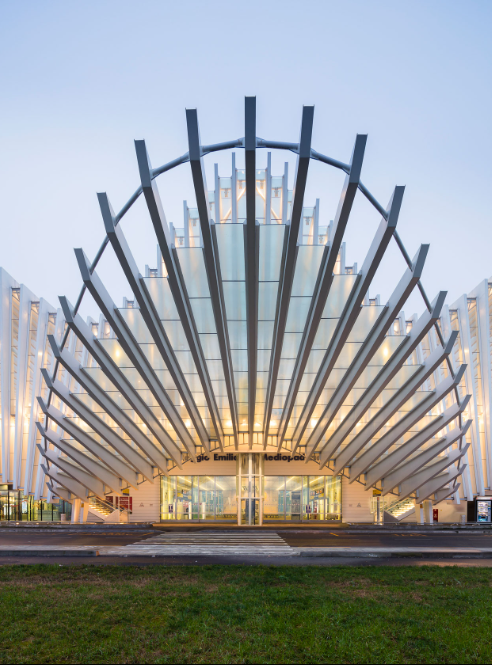
Source: https://calatrava.com/projects/reggio-emilia-stazione-mediopadana-reggio-emilia.html?view_mode=gallery&image=1
02_ UNDERSTANDING THE GEOMETRY
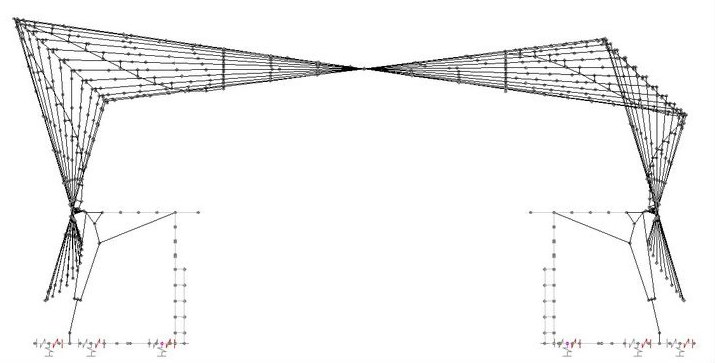
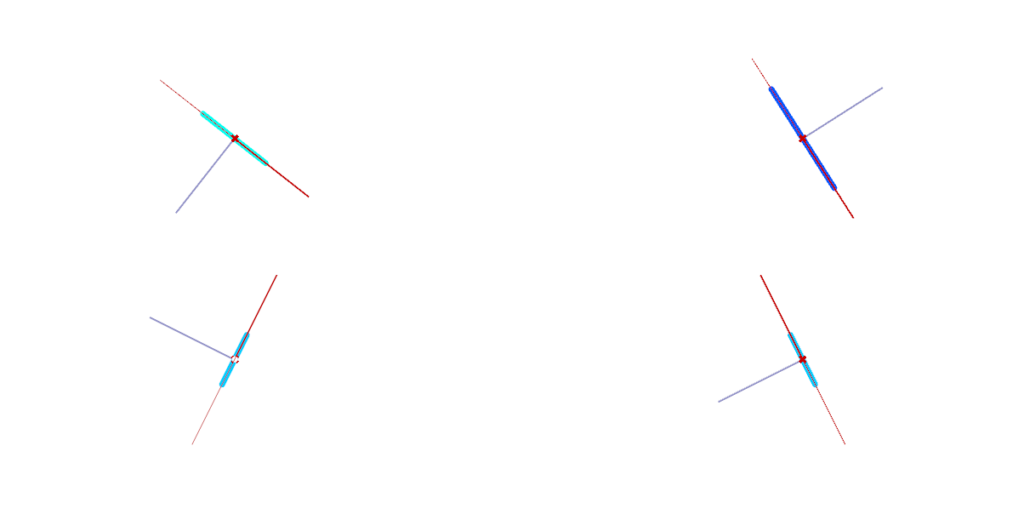
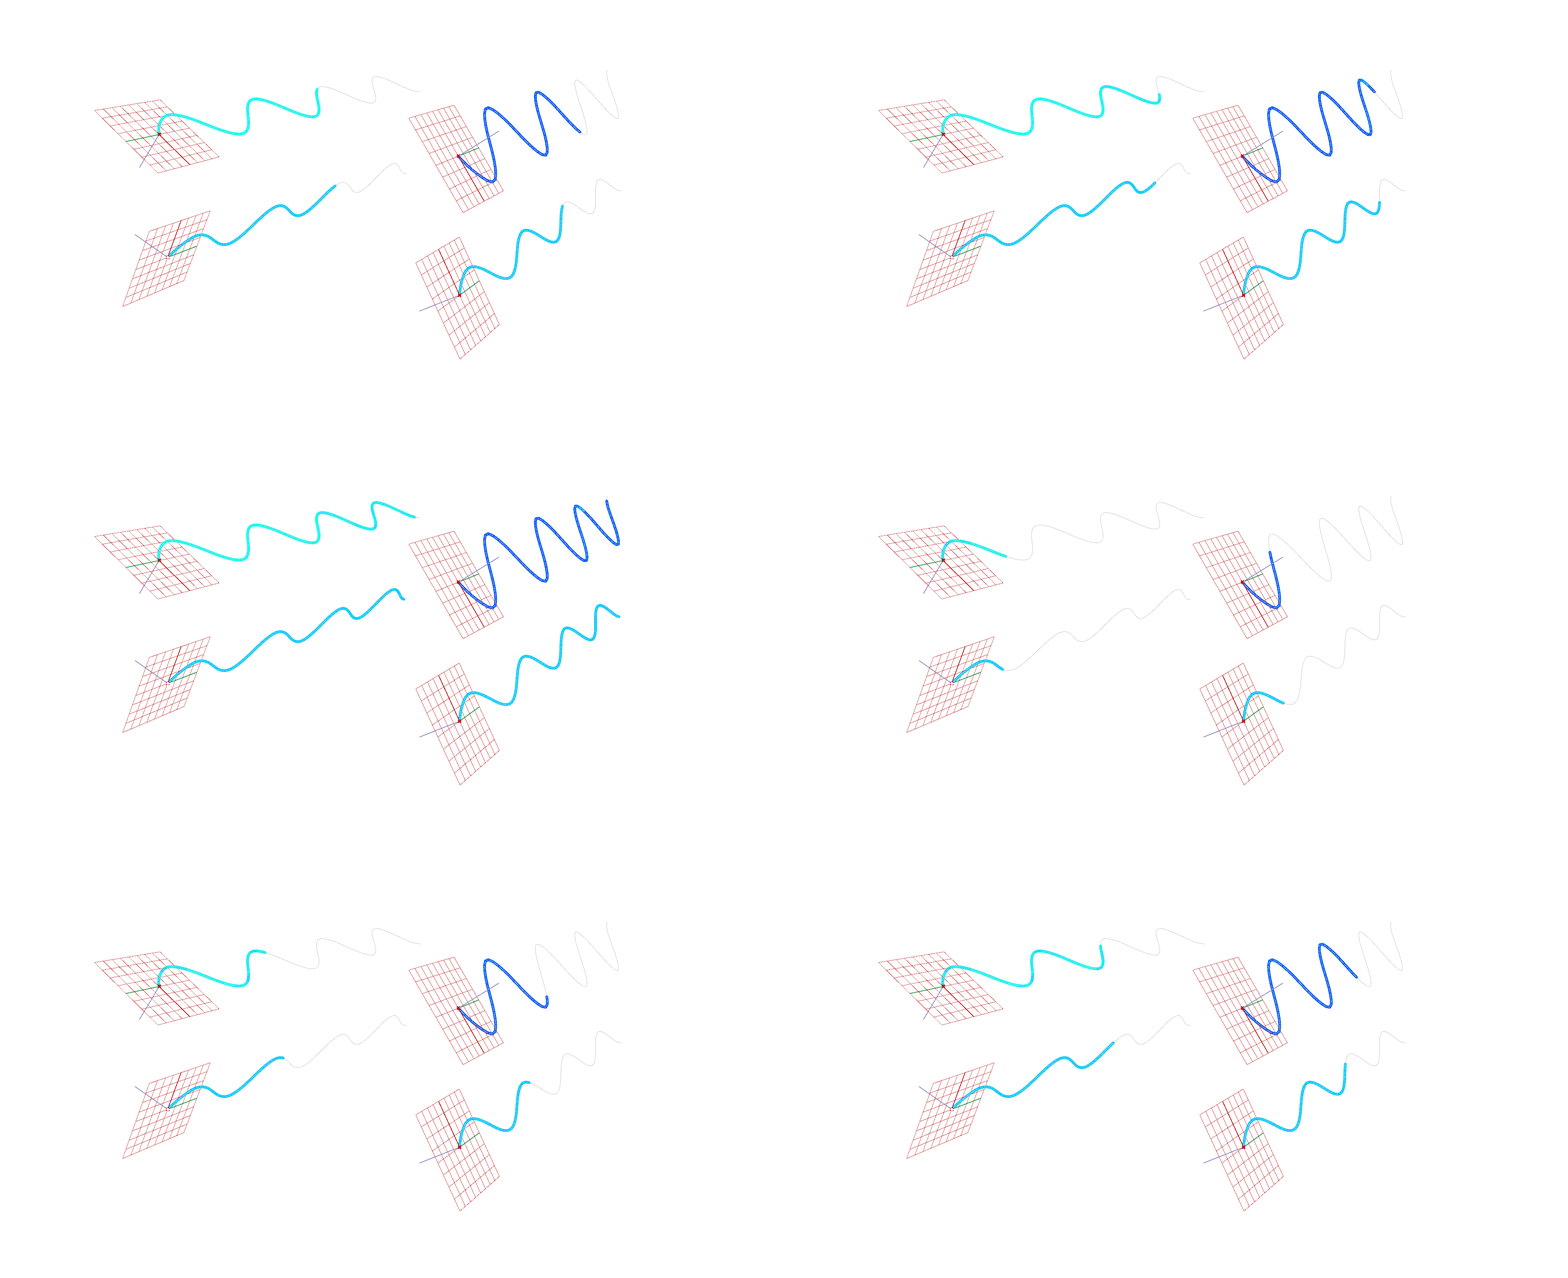
Before reproduction of the desired model, we have deconstructed the logic on which the building is designed.


03_PSEUDO CODE
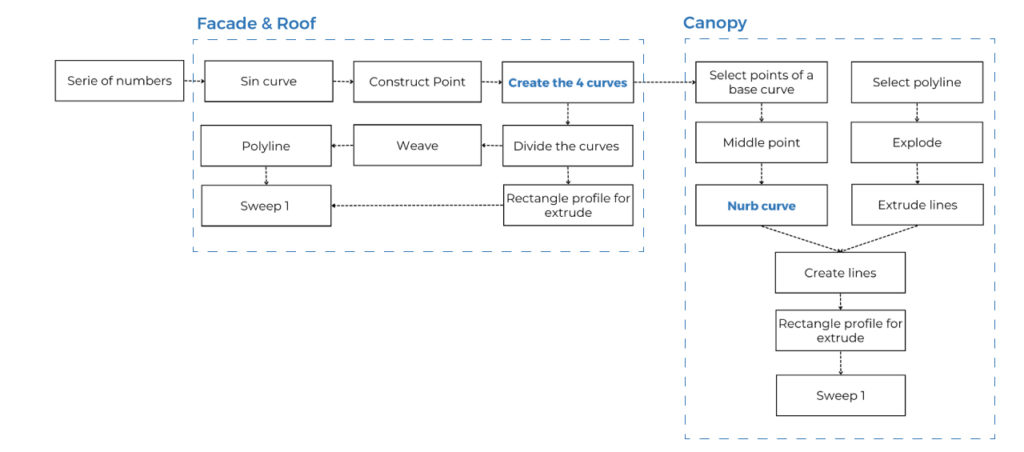
The decomposition and deconstruction of the logics that are forming the facade base in two basic geometry. The main building which it consists of the 2 facades and the roof as a one shell, and the canopy.
For the shell’s polylines:
- We create a Series of numbers for the points of the functions and use the Sin component for all the curves.
- Using the Weave component and as an input all points on the curve we design the polylines for the shell.
For the entrance:
- We select the points of the base curve with SubList. Using List Item, select the first (0) and the last (-1) item of the list. We create a line between these points and set the Middle Point , which is move in the Y and Z coordinator. These three points create the Nurb Curve.
- We take the same part of the list of the top polyline and with Brep to Curve create an intersection between the vertical lines and the Nurb Curve.
For the final frames we use a rectangle profile and the componets Sweep 1 and Cap.

04_3D VISUALIZATIONS
