The purpose of this blog post is to take the readers through my journey with Grasshopper. Grasshopper is a visual programming language and environment primarily used in architecture, design, and creative fields. It’s a plug-in for Rhinoceros 3D, a CAD software, enabling users to create algorithms and generate complex designs through a node-based interface. In this post, I’ll “fly” you through several of the practice exercises that were assigned during this course, which challenged us to apply the fundamentals of algorithmic design.
Panelisation through Jittering
For this exercise, we were challenged to create a panelized jittered wall along any desired surface. In order to achieve this, the first step is to create a plane or surface as the base form. I’ve chosen to make a revolution, similar to the first assignment. First I created a profile curve using 4 construction points, merged them, and extracted an interpolate curve from the merged points as the profile curve. For the axis of the revolution, I used the same parameters from that first assignment with a circle radius of 0. Once the profile curve and axis were set, a neat egg-like revolution was created.
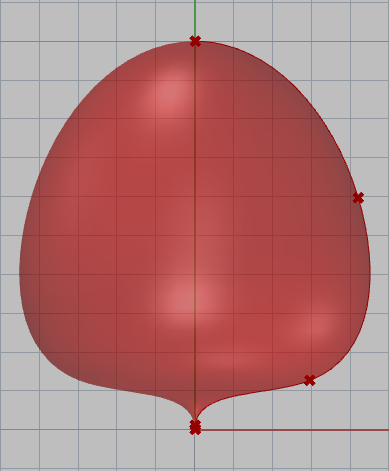
After creating the revolution, the next steps were to make the panels using the Lunchbox panel tools. I chose to use the Hexagonal Cells panel tool, but first I had to extract a surface from the revolution. Once the surface was made, I connected it to the Hexagonal Cells Surface and made 2 number sliders for the U (73.43) and V (35.71) parameters. Then, I extracted a curve from the cells and the center points. After deconstructing and remapping these center points, I used them as the scaling factor to offset the curves through the scale component. The next step was to sort the list.
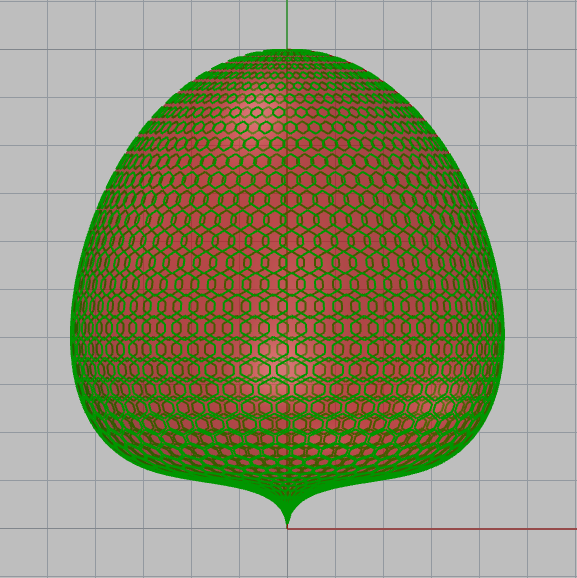
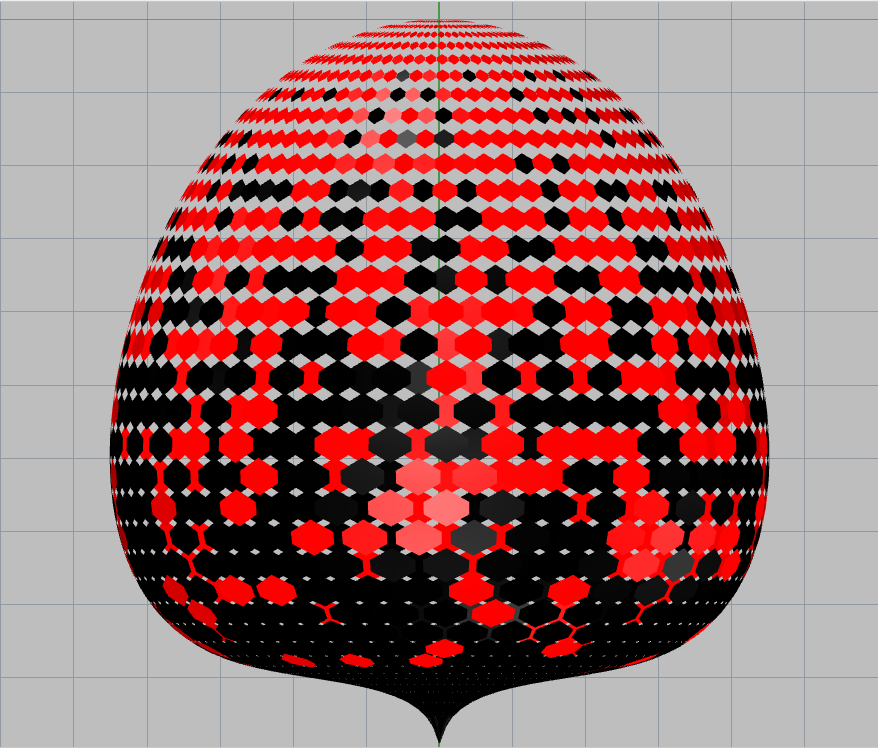
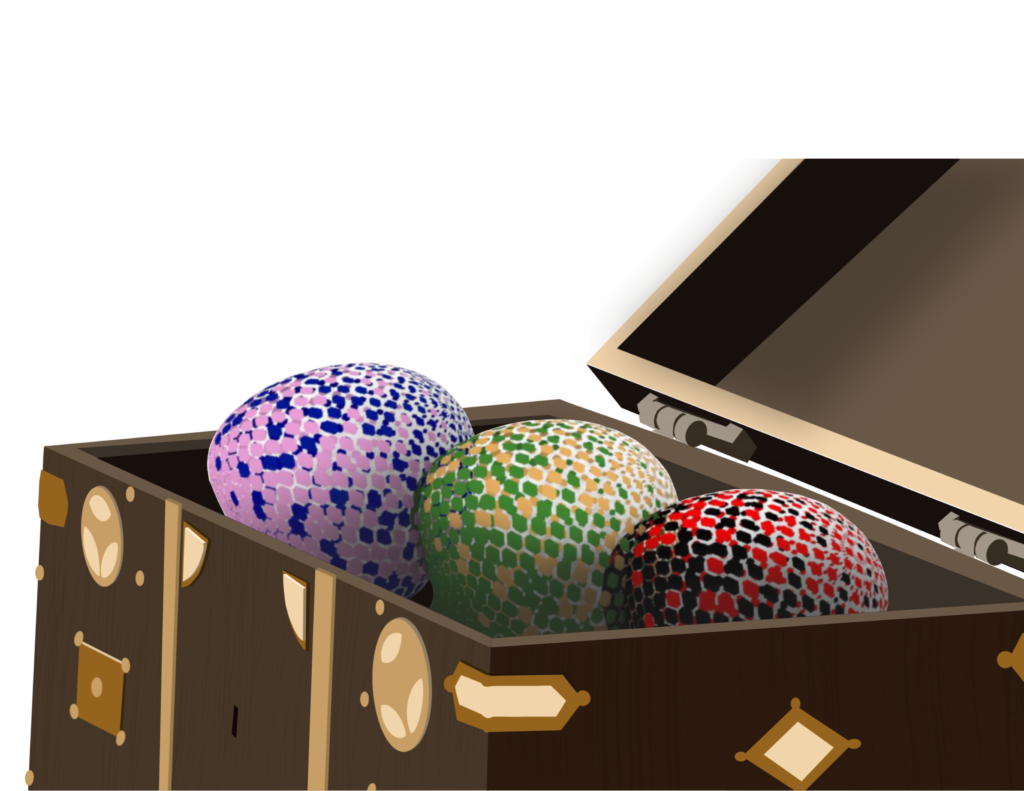
Once this lists was sorted, it was time for some jittering! I connected the sorted list values to the jitter list input and chose values for the jitter and seed. For the jitter I used values between 0.00 and 1.00, and for the seed I used values between 0 and 1,000. Then, I used the Weaverbird’s Tile to input the jitter values into. After disjointing the meshes, these were split through the Split List component. Finally, I created 2 Custom Previews, one in red and the other in black. The result was an awesome dragon egg!

Visualizing Data
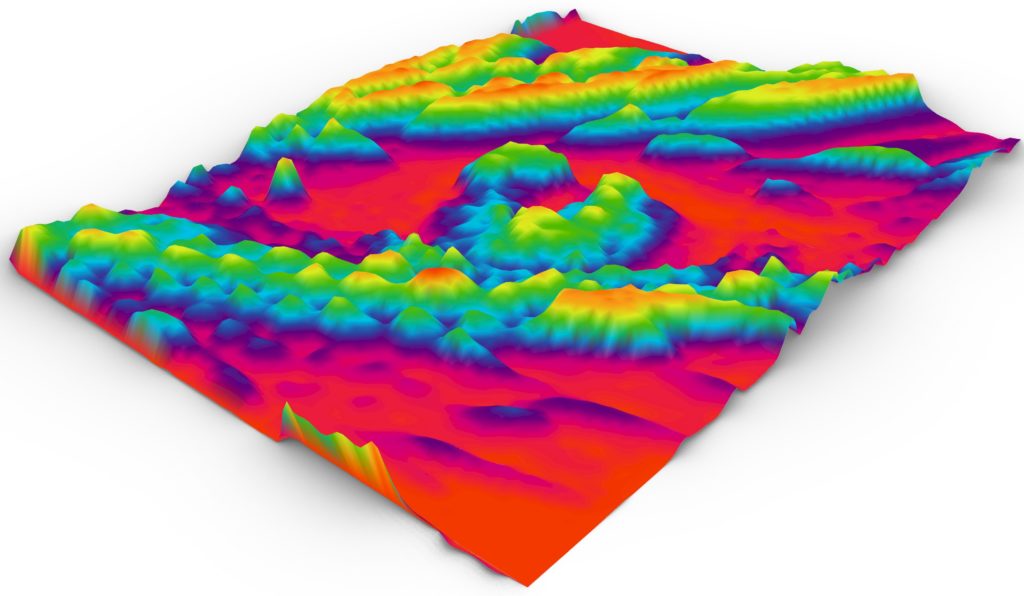
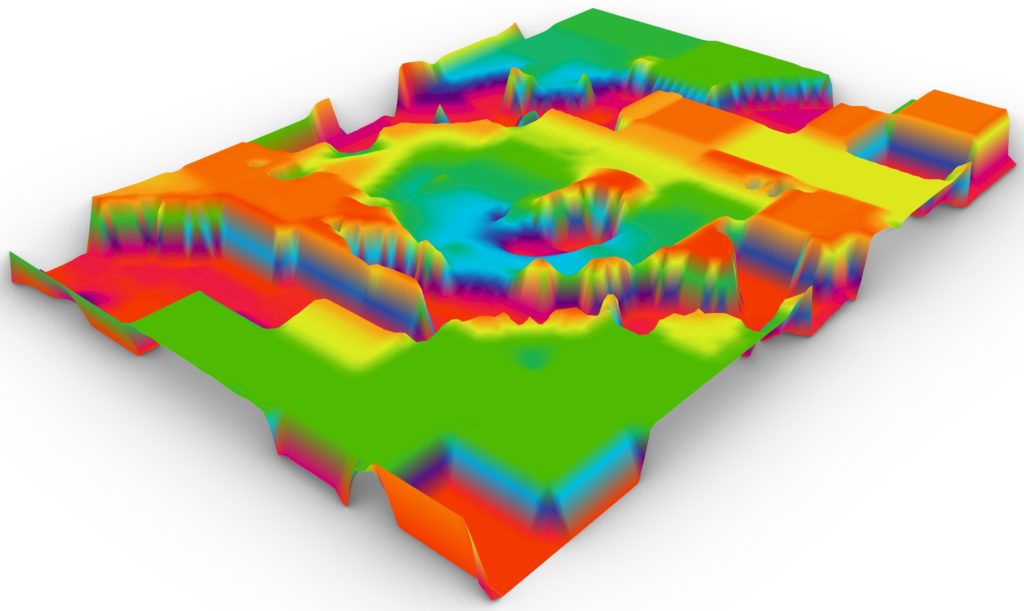
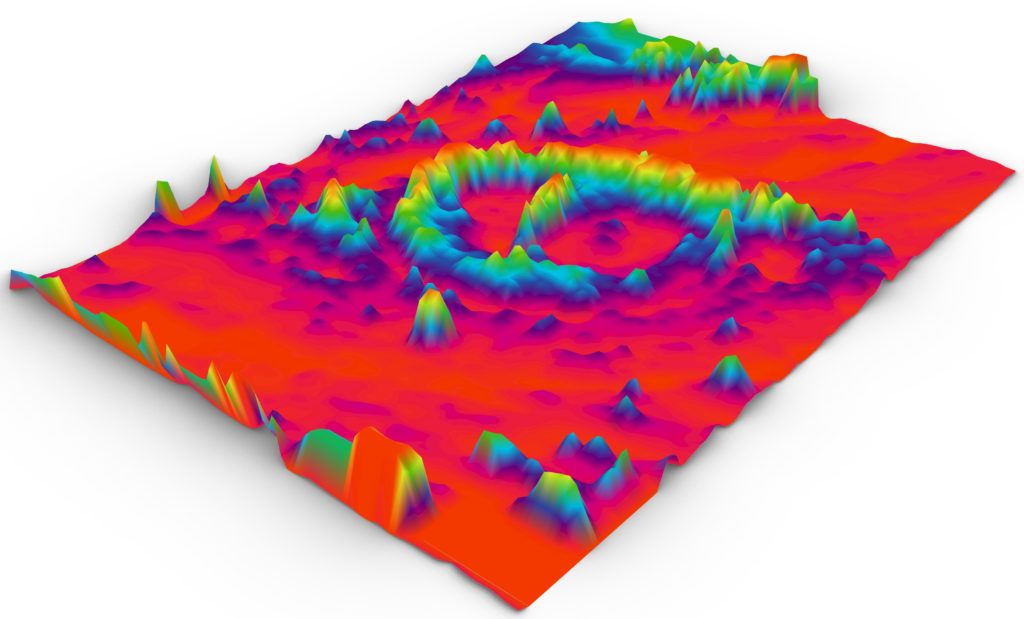
For this assignment we were challenged to visualize data, be it heights, color values, climate analysis, etc. In this exercise, I’ve made a mesh based on the color information of a chosen image.

First I created 2 series of points that would be the UV values of the image. The image is 100×140 pixels. Then, I merged the series and made a construct of points from it. Then, I input these points into the image sampler, which was used to import the chosen image, and moved the points on the Z direction following the color values. The color values change according to the filter chosen. First I extracted the brightness values, and the points moved vertically from least bright (lowest points) areas to the brightest areas (highest points). Once these points were moved, I made a surface from these points (which failed a few times) and then turned it into a mesh. Lastly, I wanted to make a gradient that represented the color values for each filter. To achieve that, I deconstructed the mesh, deconstructed that domain, and plugged in the lower limit and highest limits accordingly. This resulted in a colored mesh that visualized the different color values of the image. The data represented on each iteration are the brightness, hue, and saturation filters.



Animation in Grasshopper
This final exercise consisted on creating an animated video applying everything learned in this course. For this challenge, I decided to create an array of dancing columns. The video below demonstrates the process of the design step by step.

