
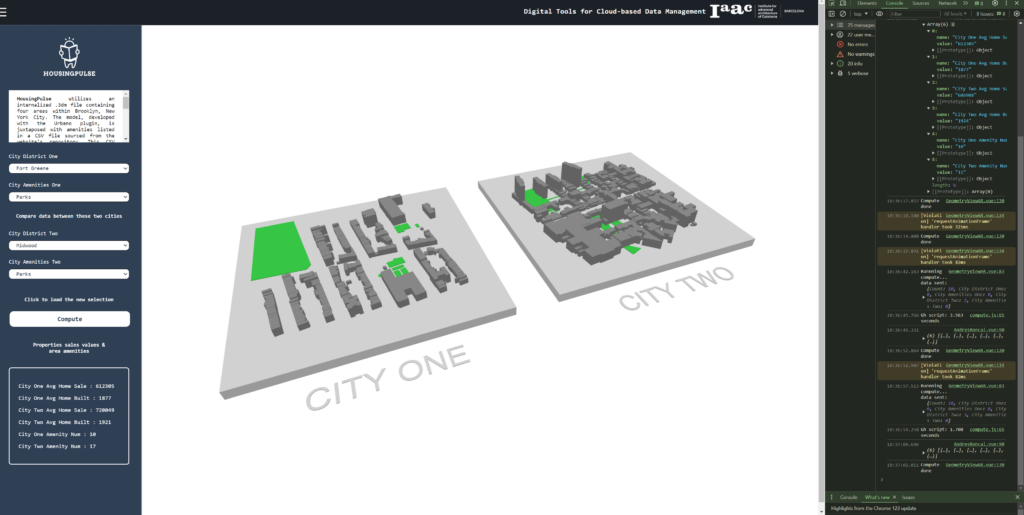
HousingPulse utilizes an internalized .3dm file containing four areas within Brooklyn, New York City. The model, developed with the Urbano plugin, is juxtaposed with amenities listed in a CSV file sourced from the website’s repository. This CSV file contains records of New York City home sales data spanning from 2023 to 2024. Additionally, users have the option to download a CSV file encompassing sales data from Brooklyn compared to the data from OSM.
The ultimate goal is to provide user with an array of visual and numerical data, enabling them to identify areas that could benefit from further community interventions, such as the establishment of schools or housing facilities.
Initial goals and possibilities in the development moving forward:
Analyze large datasets, including demographic data and geographic information, to assess the accessibility of housing stock at a city or regional level. By identifying areas with inadequate accessibility infrastructure or high concentrations of inaccessible housing units, policymakers can prioritize targeted interventions and investments to improve accessibility. Also identify possible retrofitting and abandoned lots (private or public) for possible gorilla action take over. Looking for 3d rotation of app – and possible interaction with geometries. Urbano gh, data scraping city webs, vue, three.js.
Our mission with HousingPulse was simple: to dive deep into the data surrounding housing accessibility in Brooklyn, New York. We gathered and analyzed data from various sources, aiming to uncover valuable insights into housing trends and accessibility in the area.
At the heart of HousingPulse lies a core set of goals. To make complex housing data accessible and meaningful to everyone and to empower individuals and communities with the knowledge they need to make informed decisions about housing and community development.
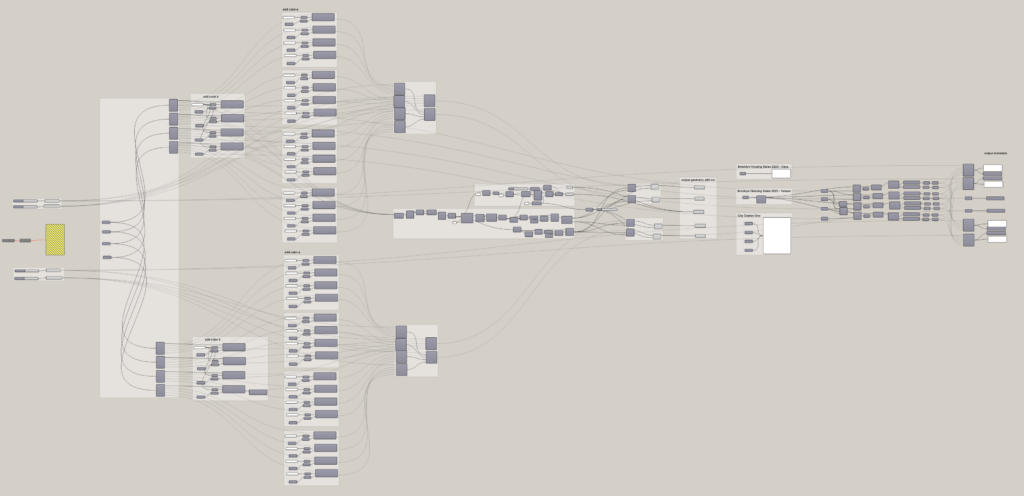
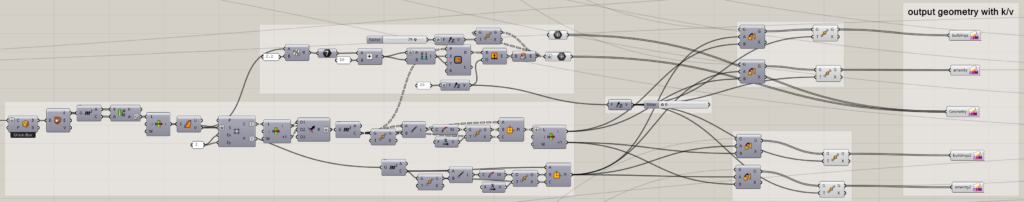
Now, let’s delve into the technical side of HousingPulse. We used a combination of Grasshopper scripts, with plug-ins such as urbano and the Vue web app framework. The Grasshopper script processes the data and streams it to our web application, where the Vue framework handles the visualization and interaction with the user.
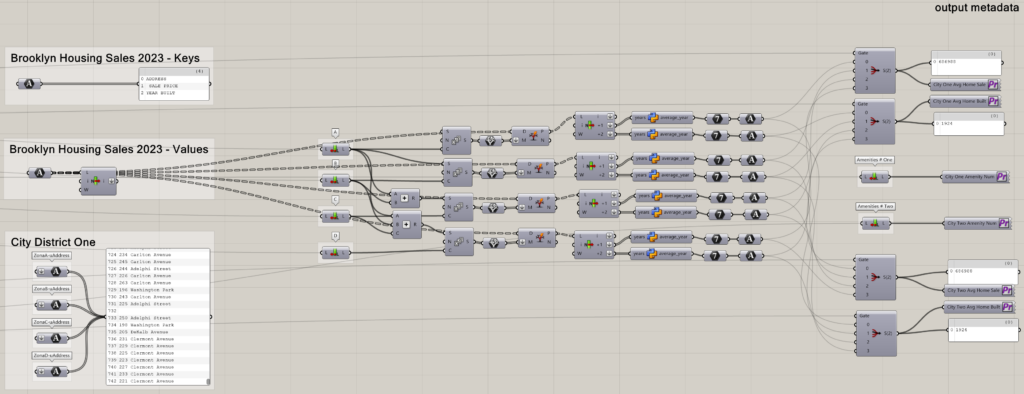
I built functionality into the Grasshopper script to compute the average home prices, number of amenities and average year of the buildings in each area. This information is then displayed in the lower left window of our web application, giving users a quick snapshot of the market.
In wrapping up, HousingPulse isn’t just about numbers—it’s about empowering communities. By combining data analytics with user-friendly interfaces, we hope to contribute to smarter decision-making and ultimately, better living environments for everyone. Thank you.
Check out our code!
https://github.com/iaac-macad/bimsc24-final-project/tree/ronmaccms/final_project
