

Table of contents
- Introduction
- Methods
- Graph database
- Designing the building graph
- Extracting the building graph
- Architectural solid component classification
- Architectural space massing classification
- Fine-tuning LMMs for graph knowledge QA
- Deploying an application
- Conclusion
- Future Work
Abstract
- The architectural design process often suffers from a disconnect between early-stage conceptual 3D models and the rich building knowledge crucial for informed decision-making. Traditional representations like brep, voxels, meshes, and point clouds, while powerful, can be computationally intensive or lack semantic flexibility. This research explores a graph-based approach to unify 3D building models and their associated knowledge, enabling a lighter, more flexible, and semantically rich representation. We propose to embed building information within the graph structure, facilitating direct interaction and analysis.
- Furthermore, this research investigates the potential of Large Language Models (LLMs) to interact with this 3D knowledge graph, providing architects with a natural language interface for querying and manipulating building information. This could streamline the design process, enabling rapid exploration of design alternatives and fostering a deeper understanding of the building’s essence from the outset.
- While challenges remain in effective graph construction, knowledge mapping, and algorithm development, this integrated approach promises to bridge the gap between conceptual design and building information, ultimately empowering architects to create buildings that are not only aesthetically pleasing but also functionally sound and contextually responsive.
Hypothesis
- Different types of neural networks can help to extract graphs from unlabeled conceptual 3D models by performing classification tasks.
- Fine-tuning the base large language model responsible for generating cypher queries will lead to a significant improvement in the accuracy of responses generated by the question-answering system, especially in the custom graph schema.
Objective
- Develop a framework including 3D object detection methods to construct a knowledge graph of an apartment building in the conceptual stage.
- Exploring the potential of large language models and graph database in interacting with the building’s knowledge graph.
- Deploying all the models in one web application to enhance design decision-making.
Overall process
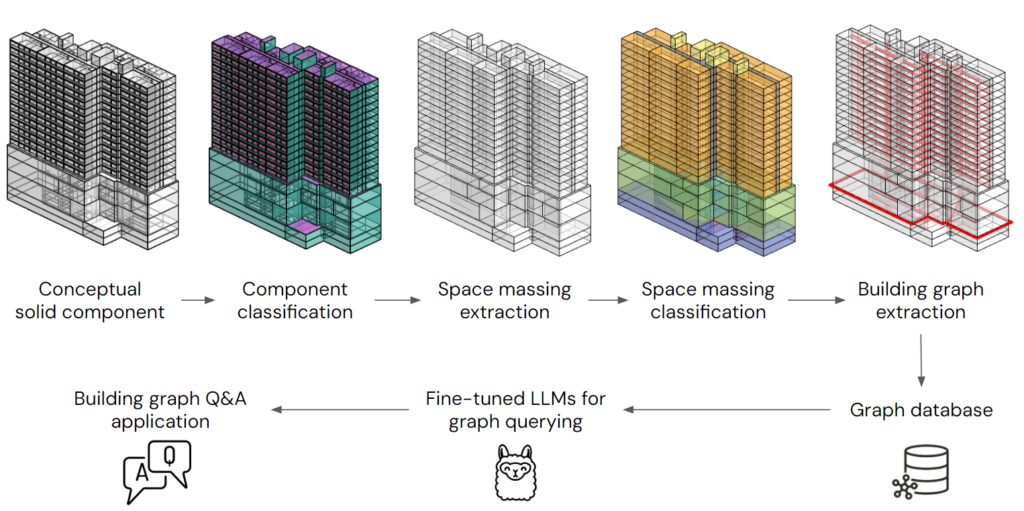
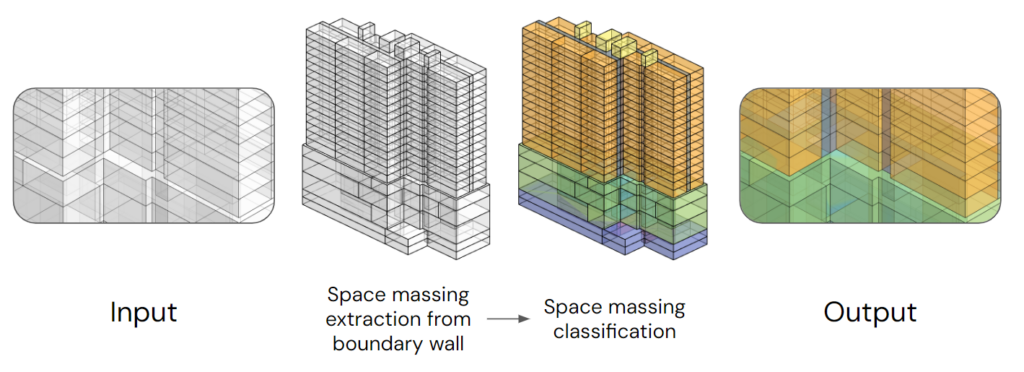
We start with a conceptual solid component, which is essentially a 3D representation of walls, slabs, doors, etc. We then classify the different components within the building. This helps us understand the boundary of spaces and the connection between them. Next, we extract the space massing from the spaces boundaries, which gives us a sense of the building’s volume and layout. We further classify the space massing into different categories, such as tower, podium, or circulation corridor….Finally, we extract the building graph. This is a structured representation of the building’s spaces and their relationships. Now, with our building graph in place, we can leverage the power of fine-tuned Large Language Models (LLMs) for graph querying. This enables us to ask complex questions about the building and get insightful answers. We store all this valuable data in a graph database for easy access and management. Ultimately, this entire process feeds into building graph Q&A applications, which allows us to interact with the building knowledge graph in a natural and intuitive way.
Graph database (Neo4j and Cypher)
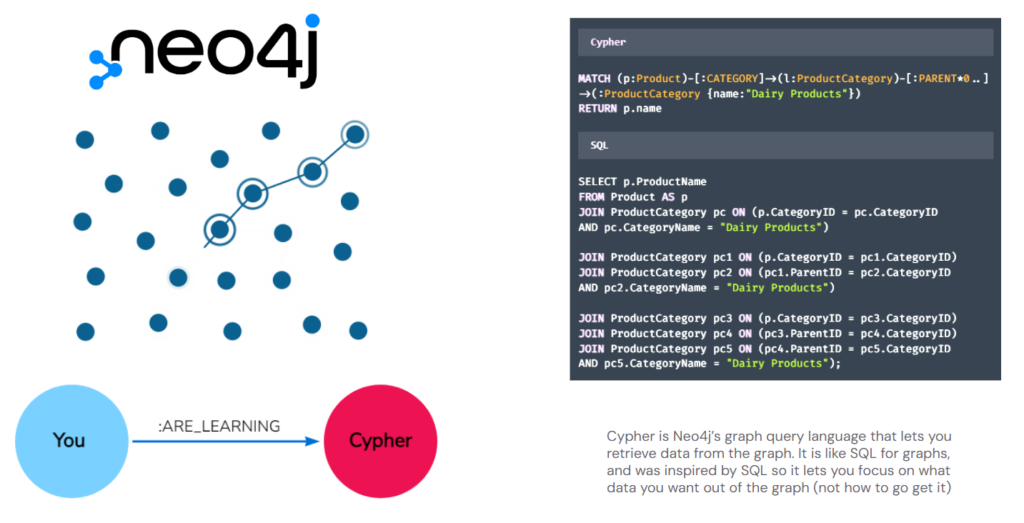
Architecture is about organizing spaces, so that graphs offer a flexible and intuitive way to represent the complex relationships inherent in architectural data. We choose Neo4j, a leading graph database, excels in handling this type of information. Its query language, Cypher, allows us to easily retrieve and analyze data within the graph
Designing the building graph
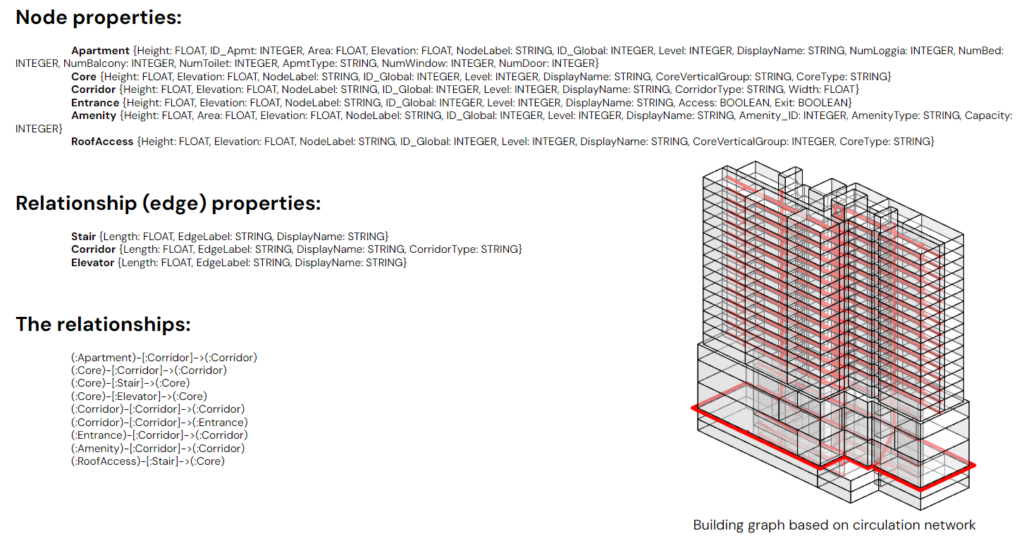
This schema show how we design our building graph. As mentioned before, relationships are important, our graph is structured to be in 3D, incorporating spatial data, to facilitate complex circulation-based queries within the building. Horizontal edges are Corridor, vertical ones are Stair or Elevator with length attribute for time-based queries
Architectural solid component classification
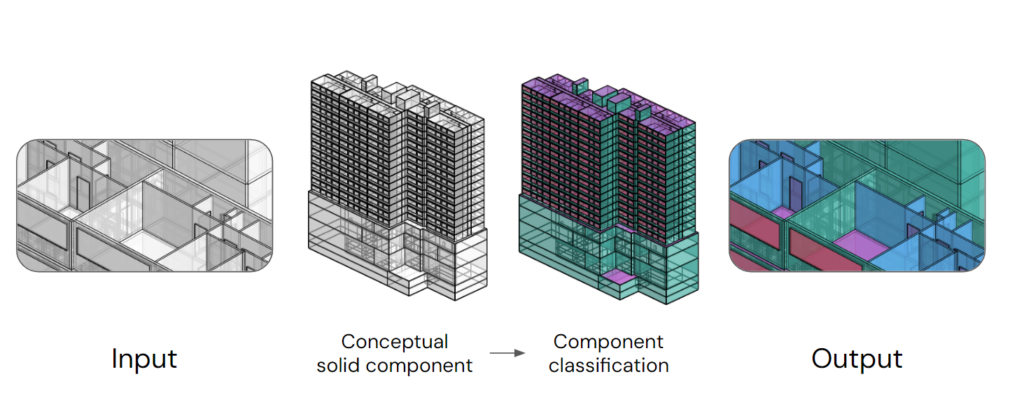
In order to segment the building into distinct spaces, we first need to classify the solid components within the conceptual model. This classification step is essential for accurately defining the boundaries of each space
Dataset creation
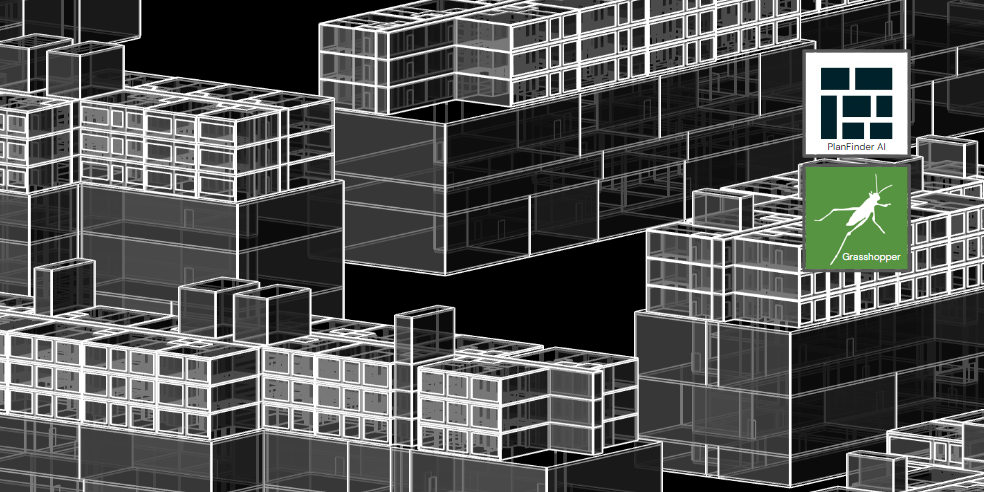
The solid component dataset was created with the help of PlanFinder AI generating the 2D apartment floor plans, and some other algorithms in Grasshopper to convert them into 3D
Classes
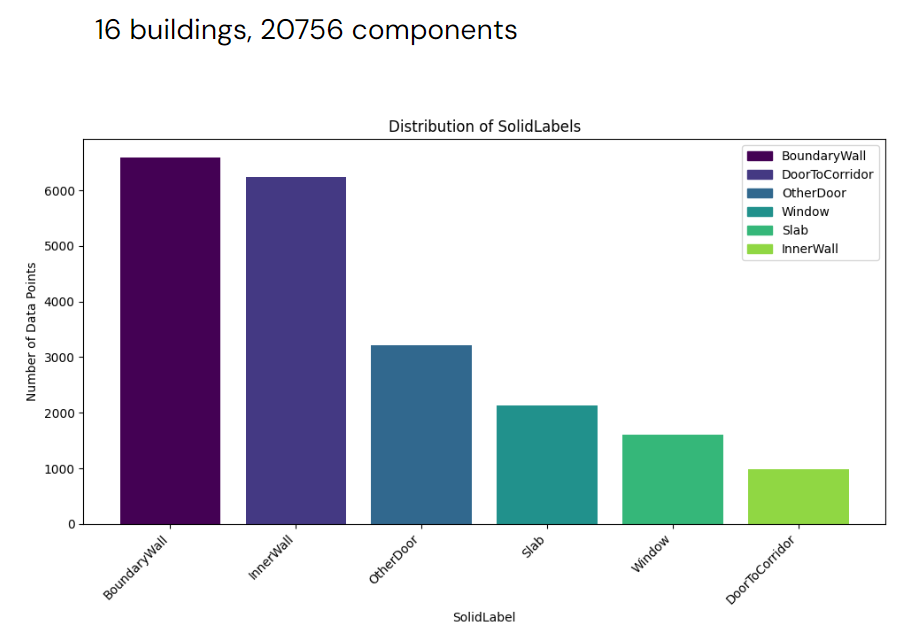
The classes are divided into 4 main categories: Wall, Slab, Door, Window. But for wall we divided into BoundaryWall and InnerWall to segment spaces bounding. The Door is divided into OtherDoor and DoorToCorridor, which are going be used as a node connecting to the corridor network
Features distribution
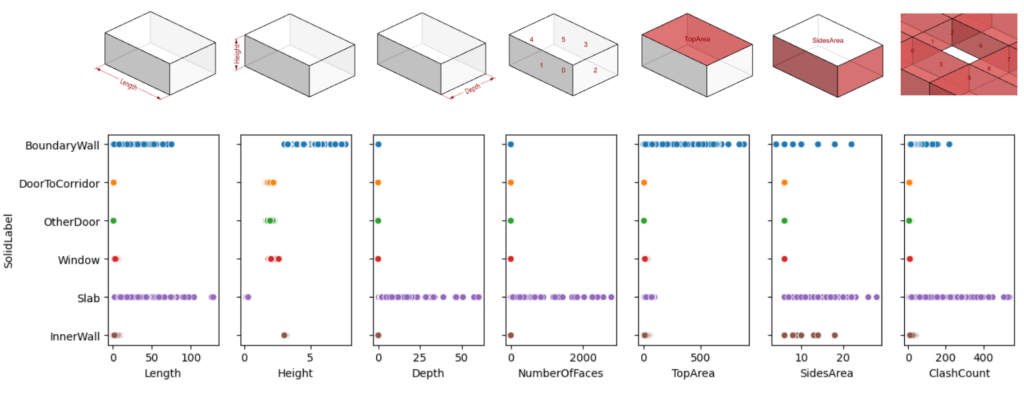
Next, we extract the geometrical characteristics of the solid as features to train the classification model. The Length, Height and Depth are from the bounding box. While the NumberOfFaces, Top/SidesArea and ClashCount are extracted directly from the solid objects to ensure that the correlation with those dimensional features are dynamic. The ClashCount is the number of neighbors that clash with the component
Features correlation
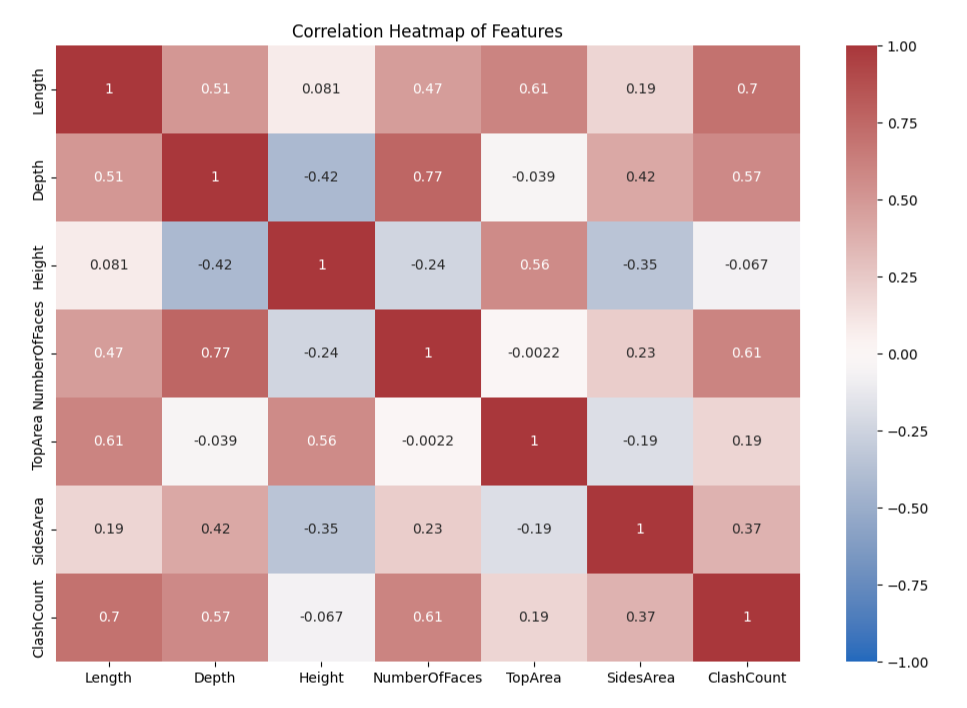
This heatmap visualizes that the correlation is as expected. There are no repeated pattern among all rows or columns, which can be great for the model to differentiate labels
Features in pairs
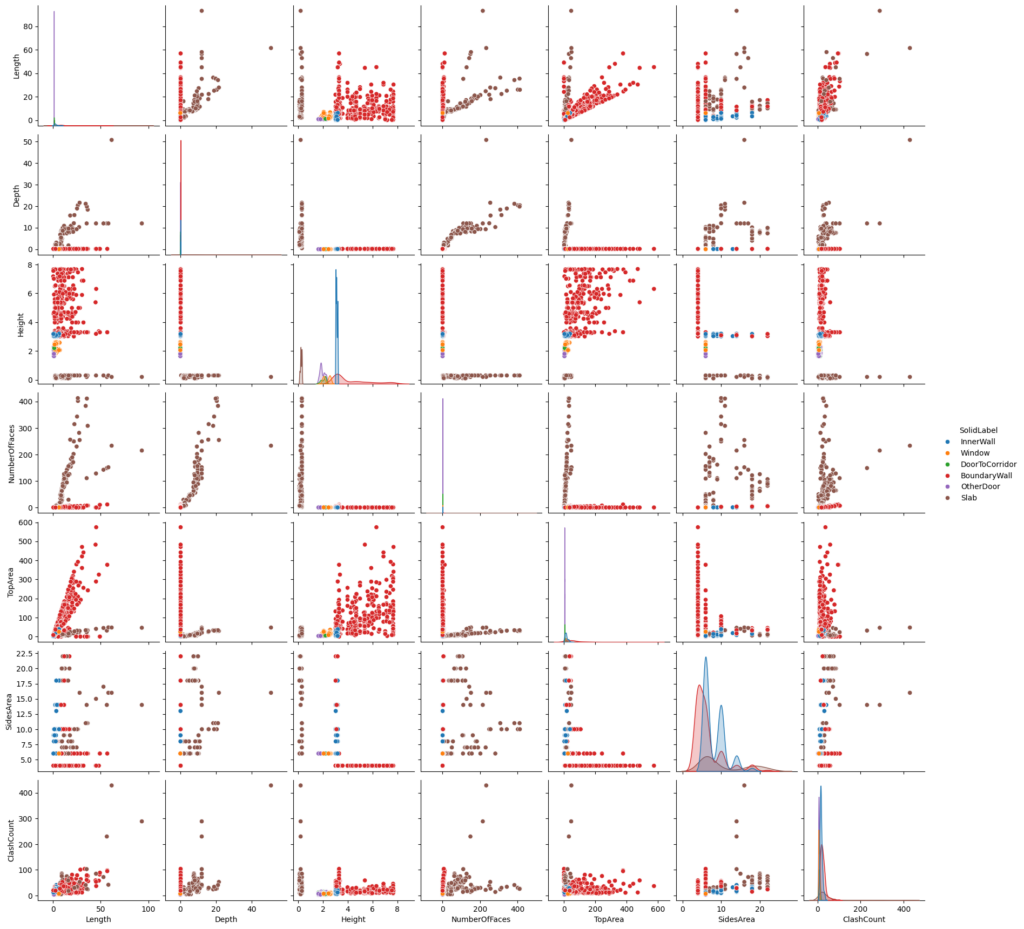
This pair plot shows how pairs of features can be used to differentiate labels, some categories can be done easily, like Slab for example (the brown points)
Features of different door types
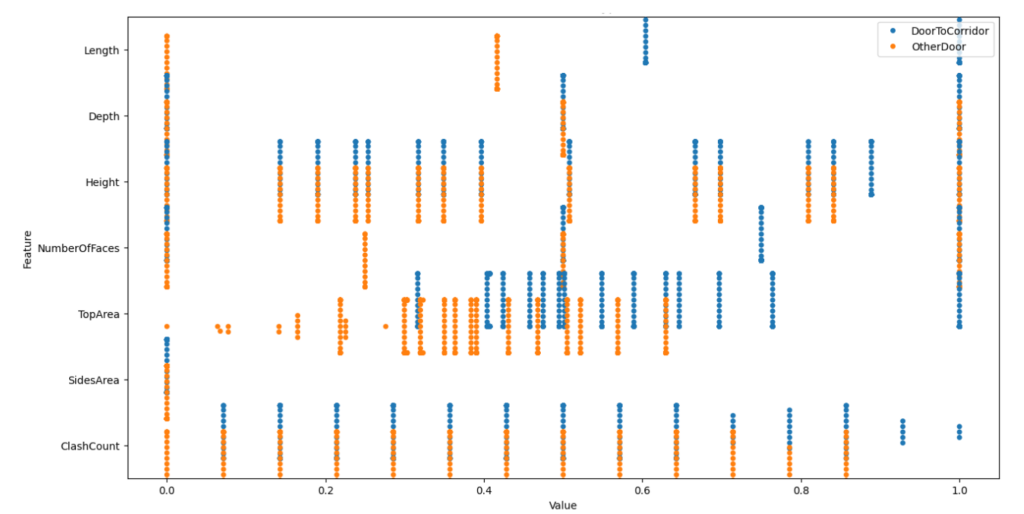
But the concern is how can the model recognize different types of door when most feature values are overlapping, as shown in this plot.
Features of different wall types
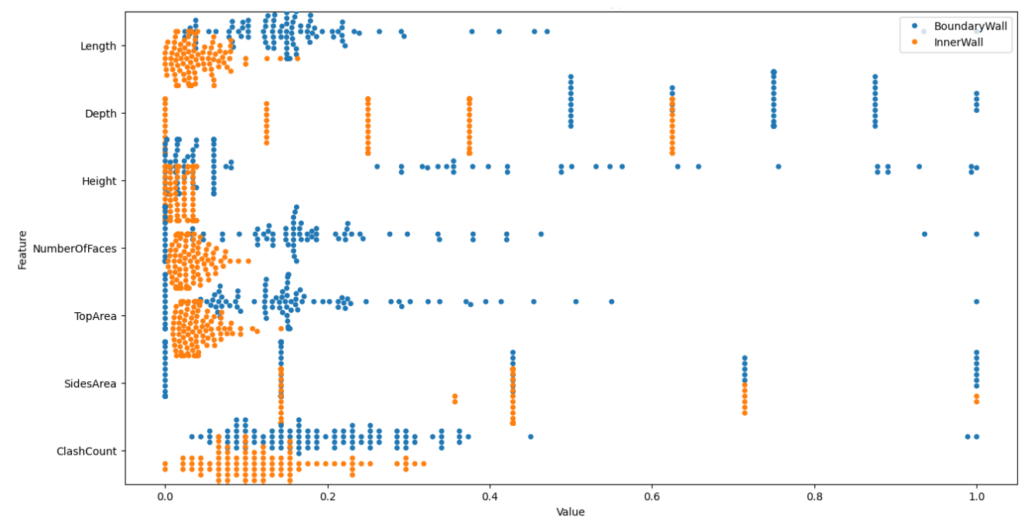
The same as for BoundaryWall and InnerWall
Artificial neural network for classification
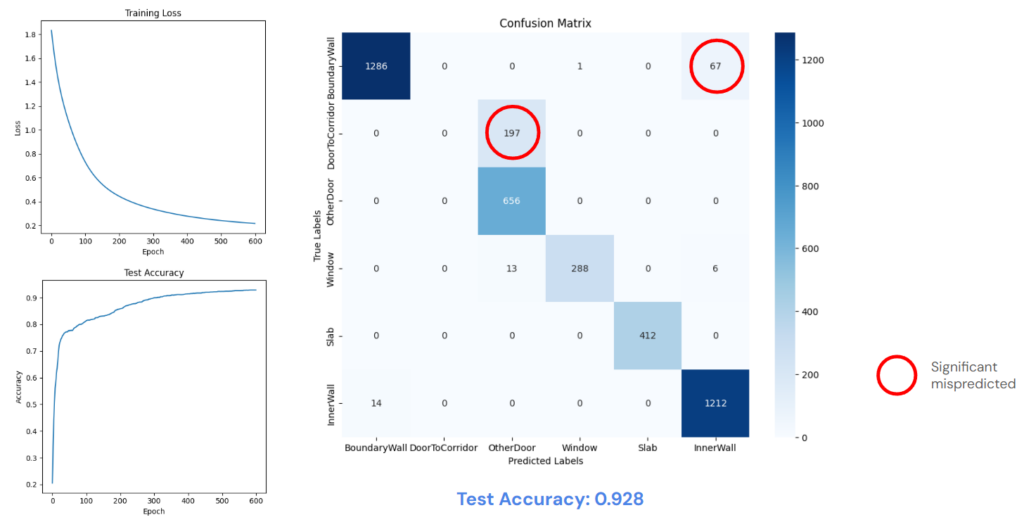
We train those feature with an artificial neural network. After 600 epochs, the accuracy is pretty high. But as suspected, the ANN model fail to differentiate different types within the same category, especially for doors; all the DoorToCorridor labels are mispredicted
Graph approach for neighbor awareness
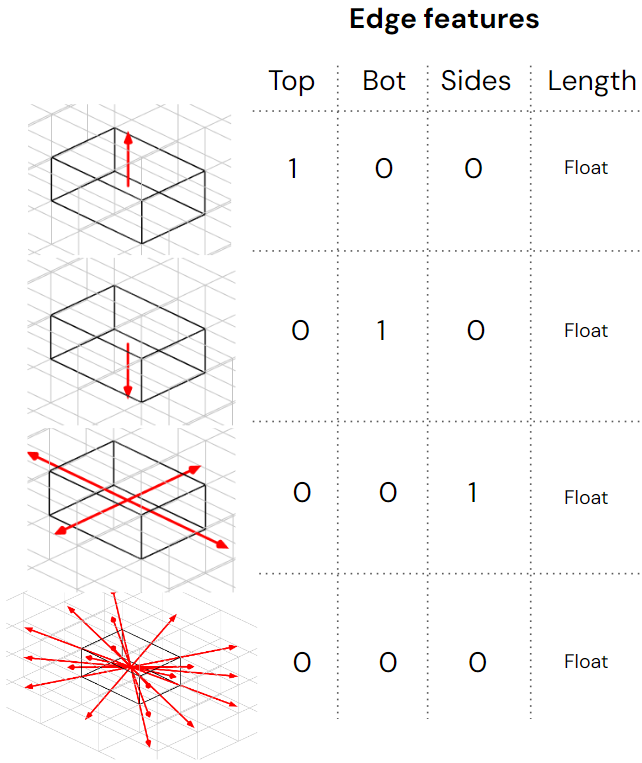
A graph approach is used for embedding the neighbor awareness into each component. We try to represent the position of the neighbor components by one-hot encoded the dot product of the vector connecting center of the node to center of it’s neighbor. Only the Length is float number
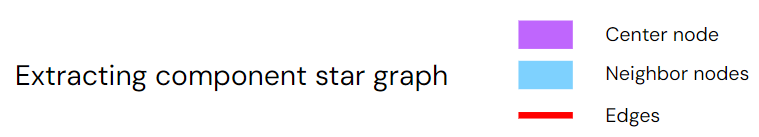
Solid component star graph
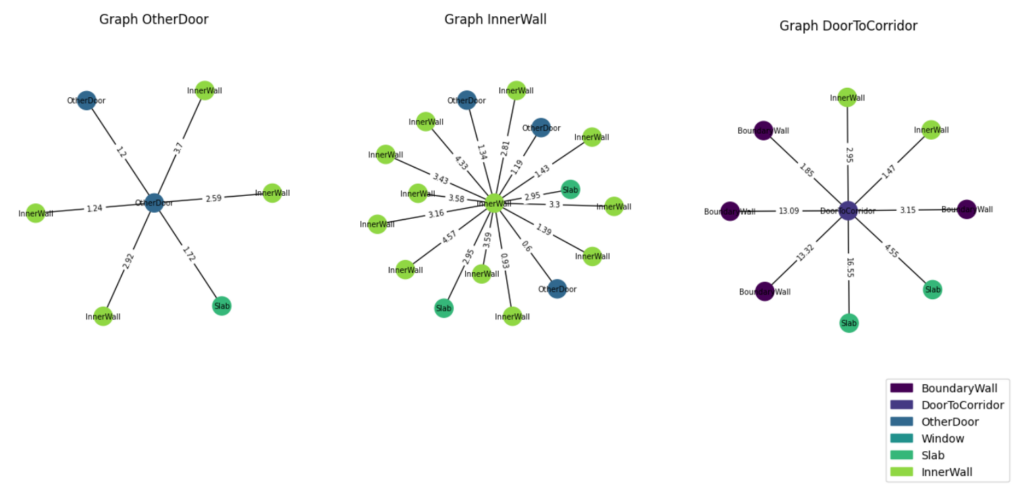
This is how the star graph of each component looks like. We expect that when the node knows that there is a large flat object nearby. It may recognize itself as a DoorToCorridor.
Graph neural network for classification
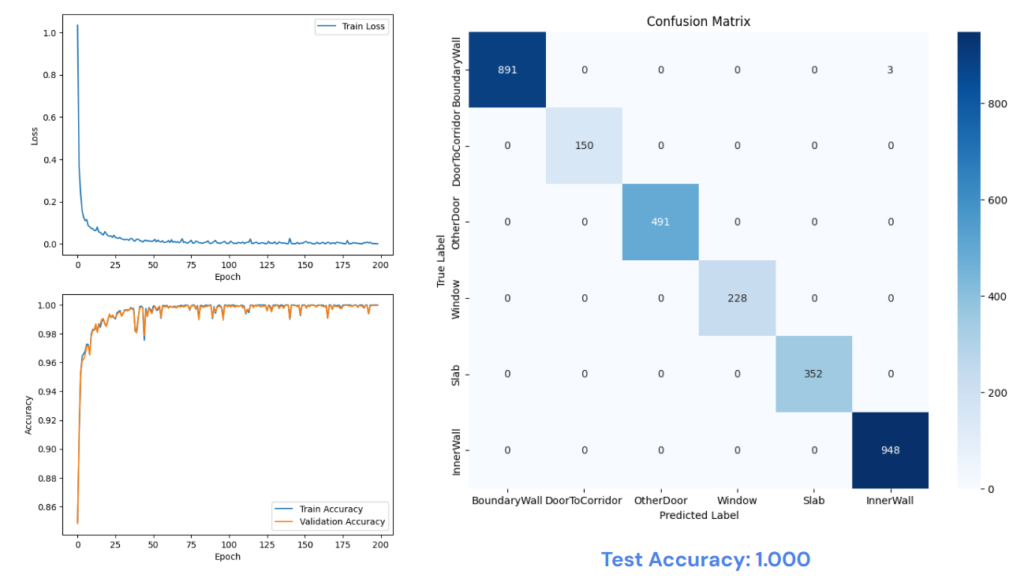
After only 200 epochs of training, one-third compared to the ANN training, the graph neural network ‘s performance on the test set is 100% correct
Deploying in Grasshopper
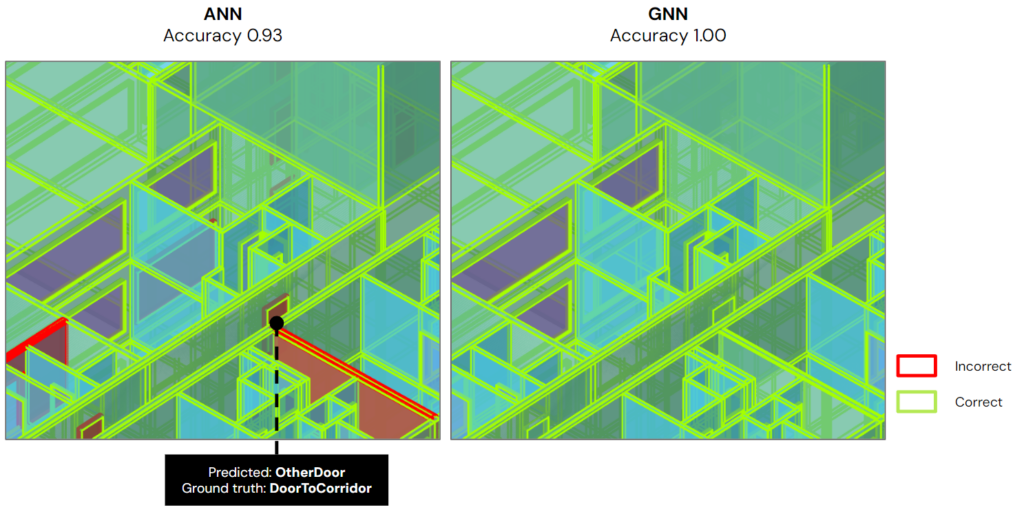
We then deploy the models in Grasshopper. As you can see, without the context awareness, the ANN model fails to catch the DoorToCorridor.
Architectural space massing classification
From the BoundaryWall and Slab, we extract the unlabeled space massing of different spaces. We need to train a model to categorize those distinct spaces within the building for graph creation.
Dataset creation
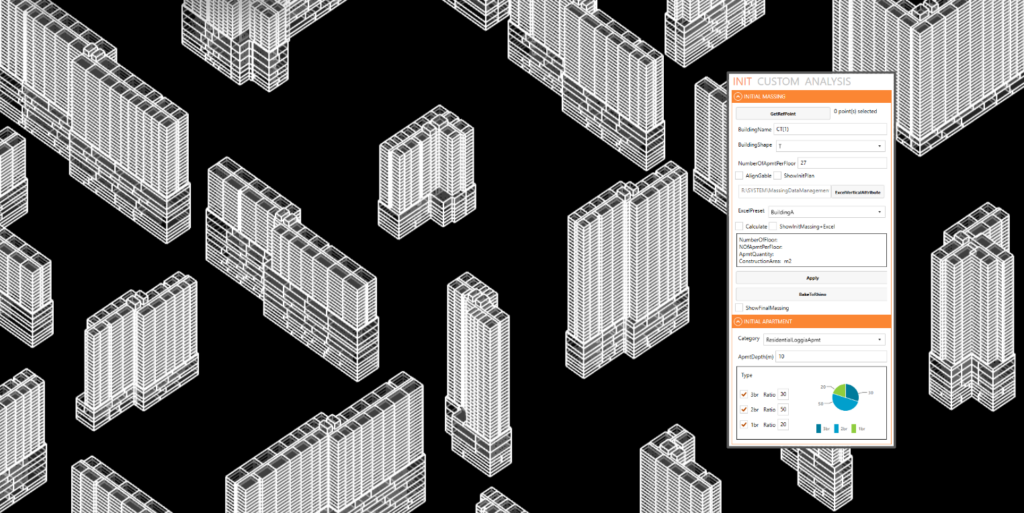
We built a custom application using Rhino, Grasshopper, and a HumanUI to automate the generation of our architectural space massing dataset for training our classification models.
Classes
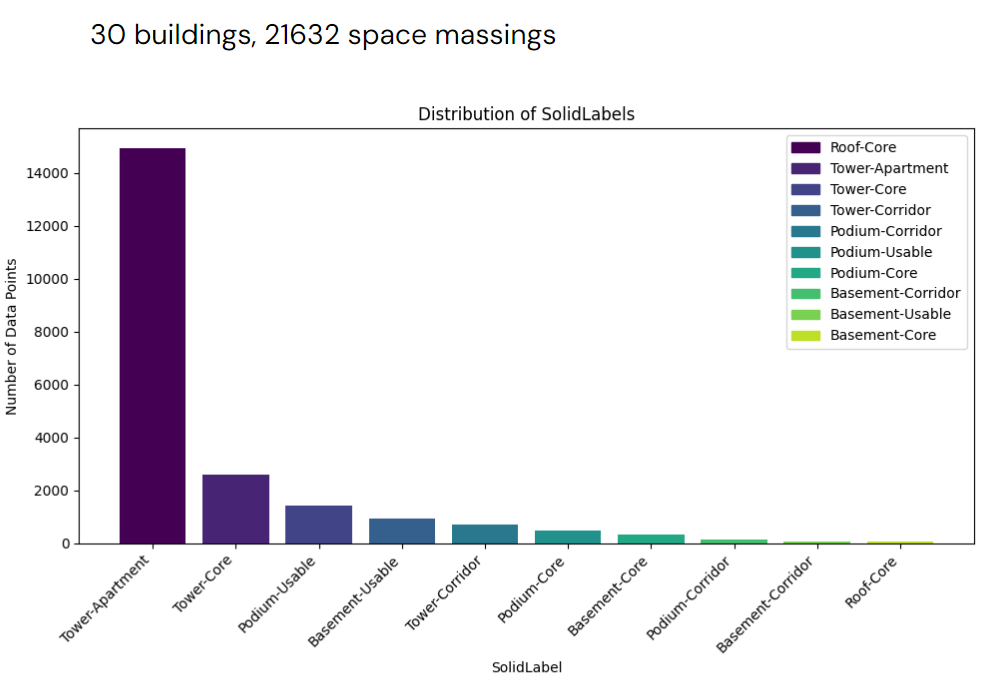
We’ve introduced distinct joined classes in our space massing dataset. The first class represents the position within the building (such as podium or tower), while the second class signifies the function of the space (like core, corridor, or apartment). Tower-Apartment has the largest amount which may be imbalance but we still keep it because each apartment will have a different elevation can be used as a feature
Features distribution
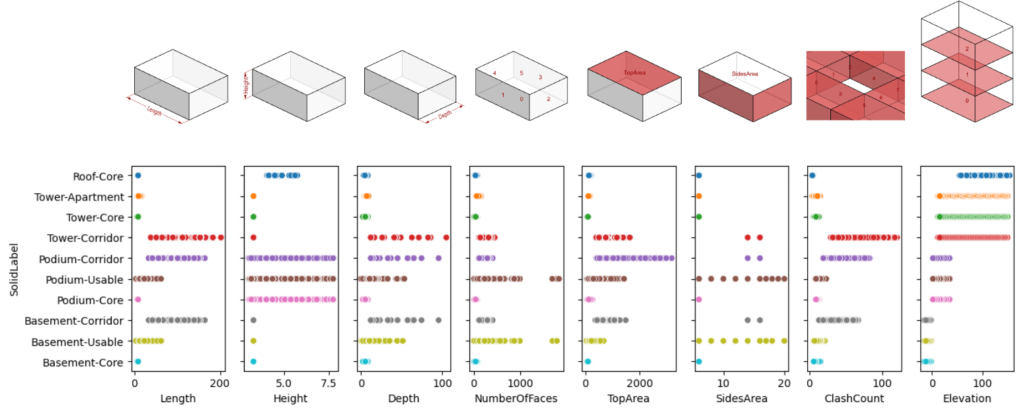
We used a similar approach with the previous dataset, using Rhino, Grasshopper for data extraction. The features collected are the same way, same type as before, with the addition of elevation data.
Features correlation
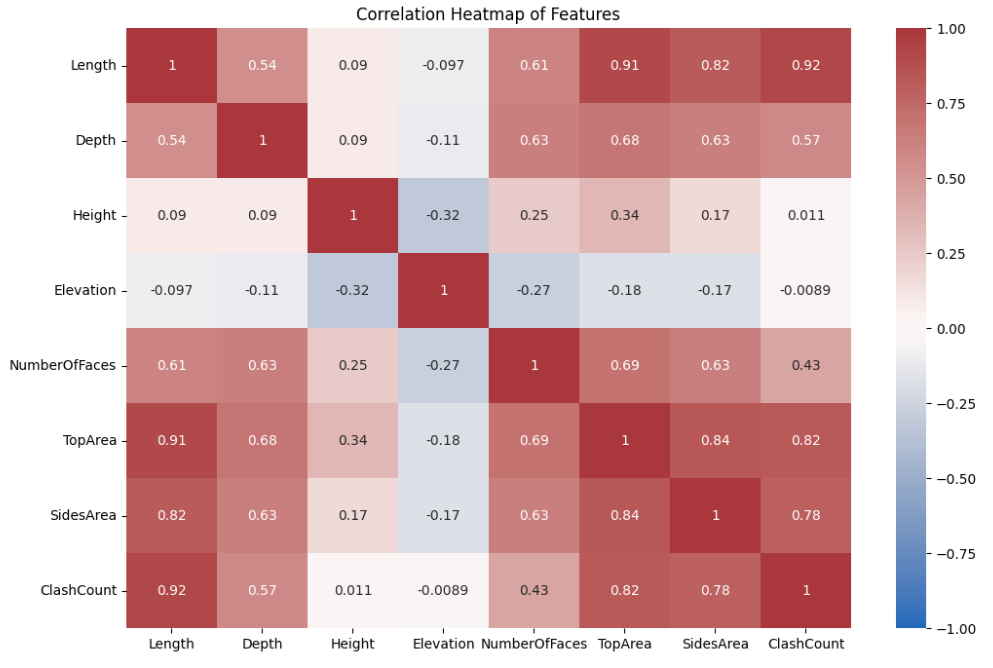
In the correlation matrix between features, we can see some features exhibit expected correlations. The relationship patterns are pretty similar except for Elevation and Height, which may make the classification task more difficult.
Features in pairs
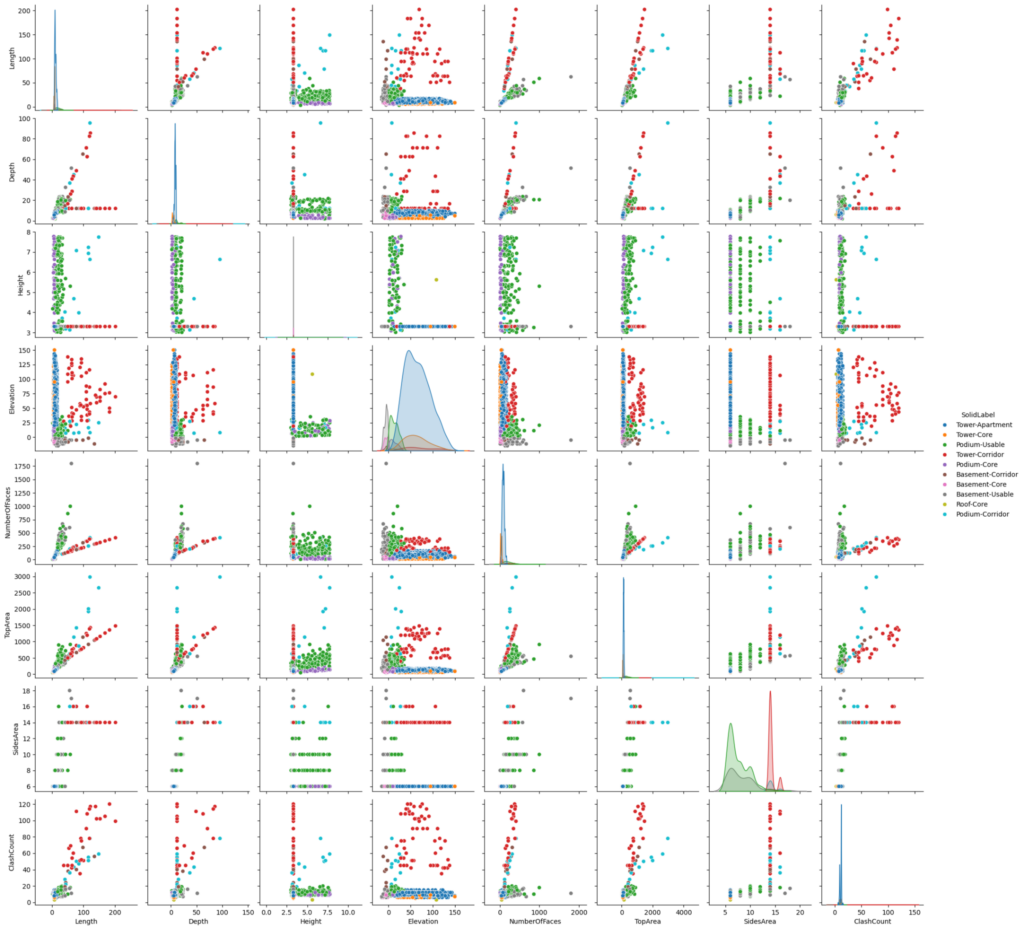
Using combinations of features, some labels can be identified, like the corridor, for instance.
Features of different core types
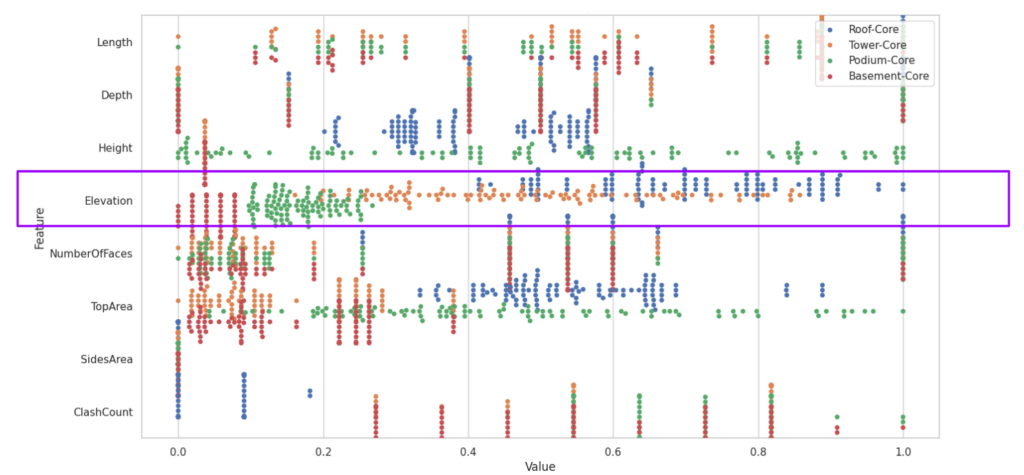
In the different types of core, the Elevation of Basement labels are identical compare to Podium, Tower, and Roof. All other feature are partially overlapping each other
Artificial neural network classification
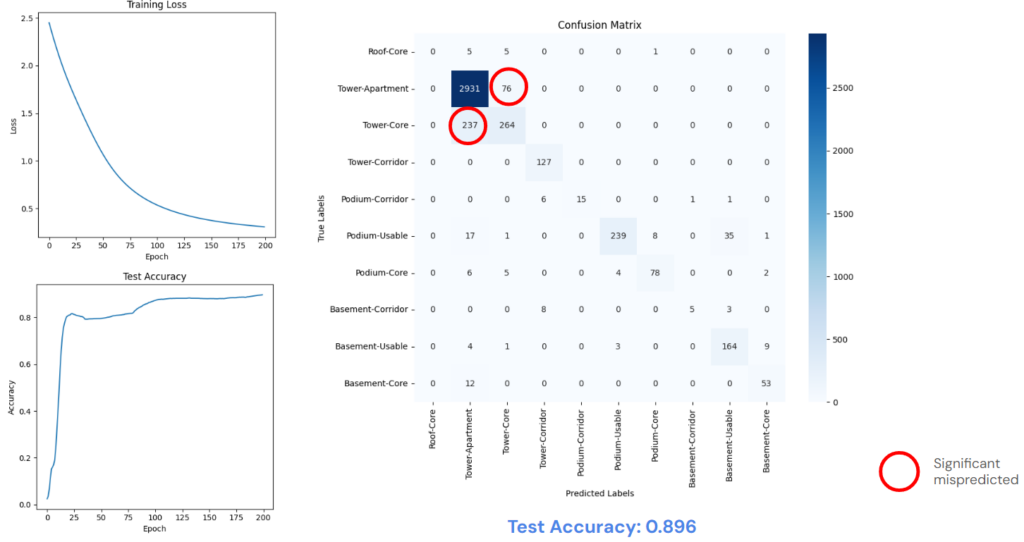
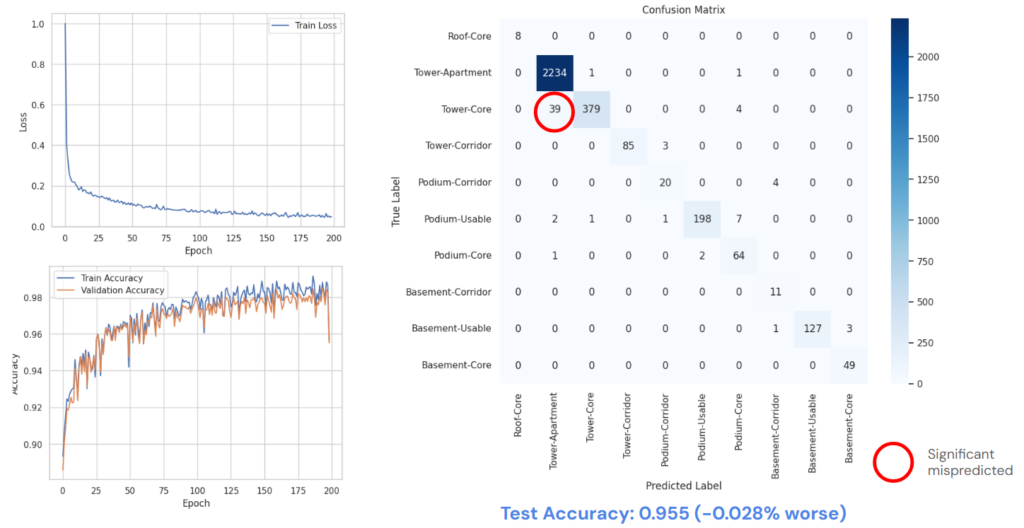
The result from the ANN is quite good but not enough when there still some significant mispredicted in categories like TowerCore and TowerApartment
Graph approach for neighbor awareness
The same graph approach is applied on the new dataset
Space massing star graph
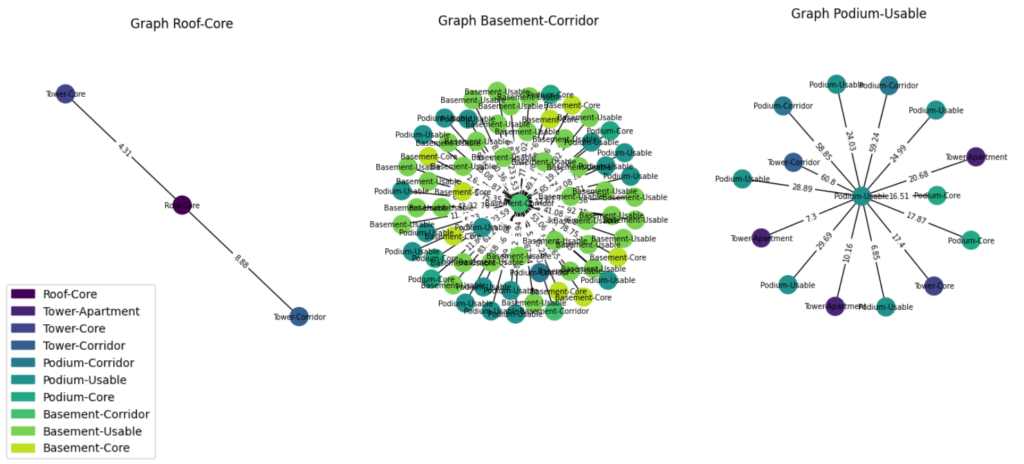
The star graph of massing
Graph neural network for classification
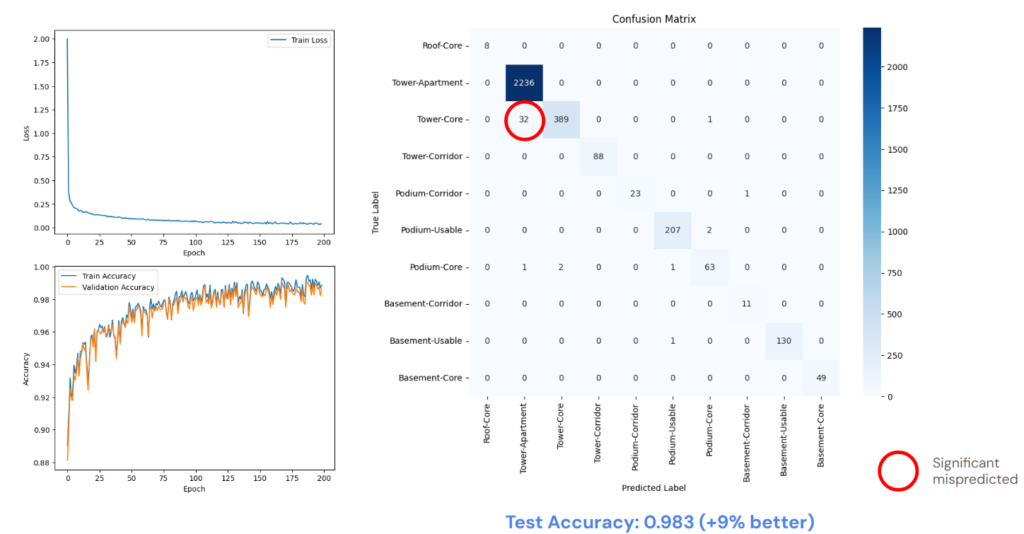
The accuracy of the GNN model is significant better than the ANN, about 9 percent. But there is still a significant mispredicted, about 10% of Tower-Core category is predicted as Tower-Apartment
Principal component analysis (PCA) for dimension reduction
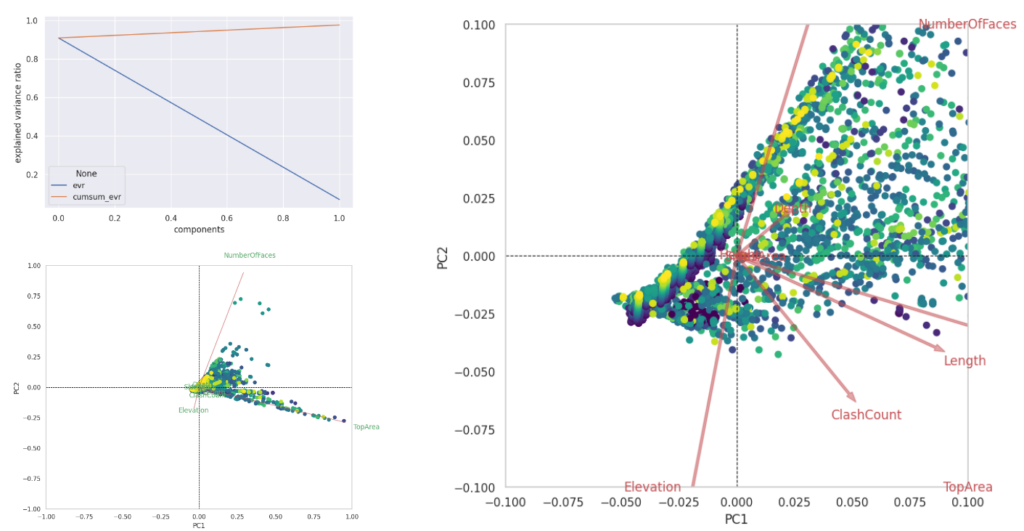
As has been said before, the features are pretty similar so that we can potentially reduce some features. This PCA analysis shows that some arrows are close to each other, which means it can be reduced.
Reducing features according to the PCA
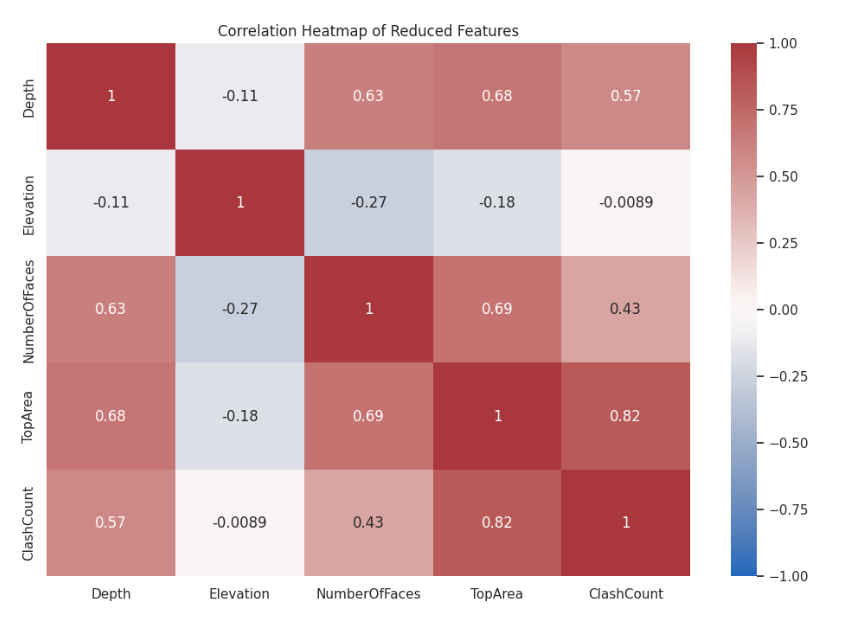
We choose to remove 3 features, which are the Height, Length and SidesArea
GNN classification on reduced features
As expected the result of the graph model are still very high
Deploying in Grasshopper
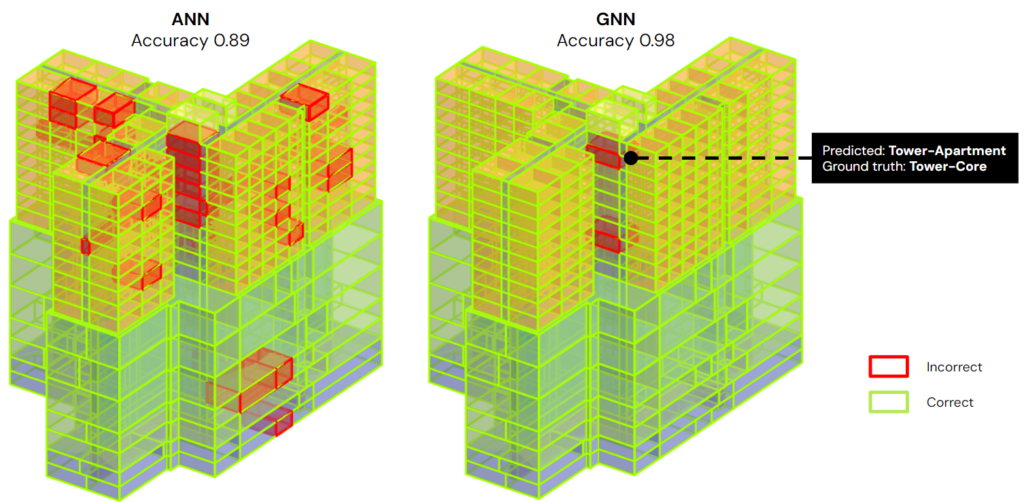
We then deploy those model in Grasshopper to visualize the predicted result
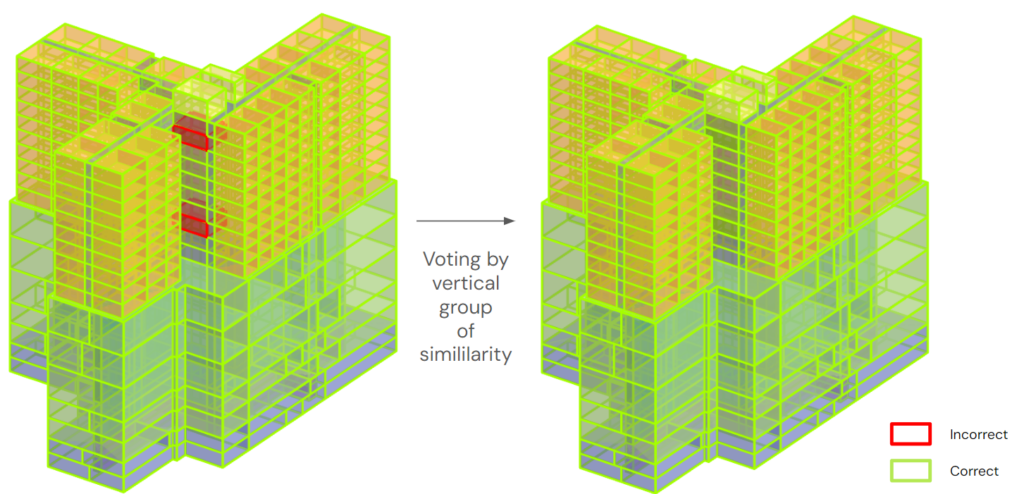
We decided to create a self-correction script after all massing of the building got classified. By each vertical group, this algorithm will collect the similar massing into a group, then vote for the label of the group, which are going be apply to all the included massing
Creating the building graph
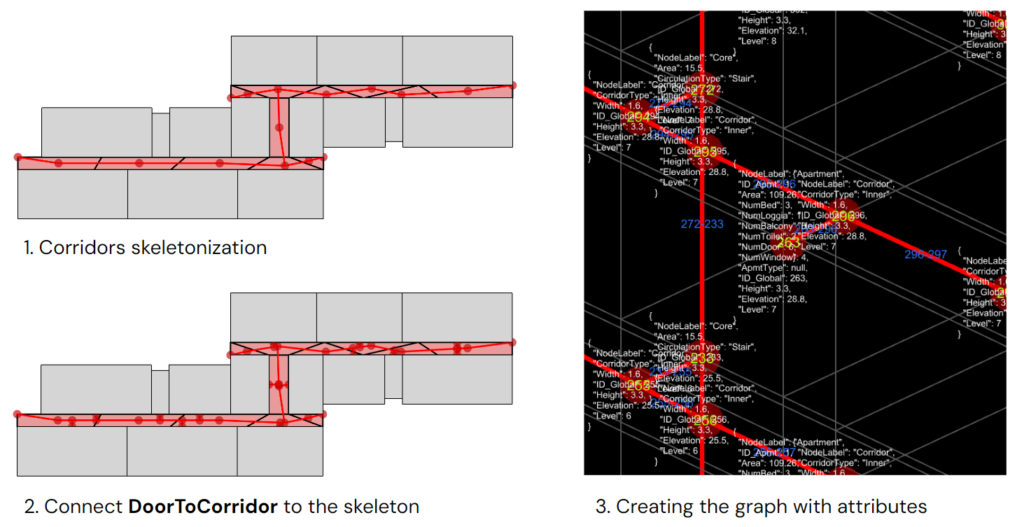
After all the space massings are labeled, we need to create the approximate circulation network. First, the corridor brep will be converted into a 2D mesh to extract the skeleton of mesh faces. Next, the DoorToCorridor location will be pulled into the skeleton to create a connection, and a new intersection point will be added to the network. Finally, we export the graph nodes and edges as JSON files with geometrical attributes
JSON to building graph
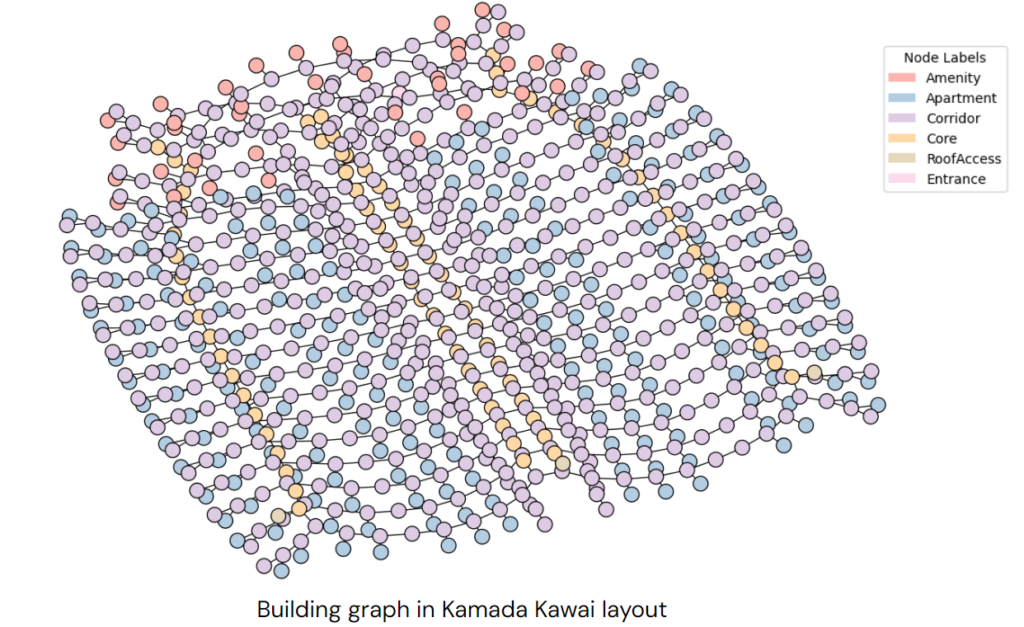
From the JSON file, we construct the building graph in Python
Refining the building graph
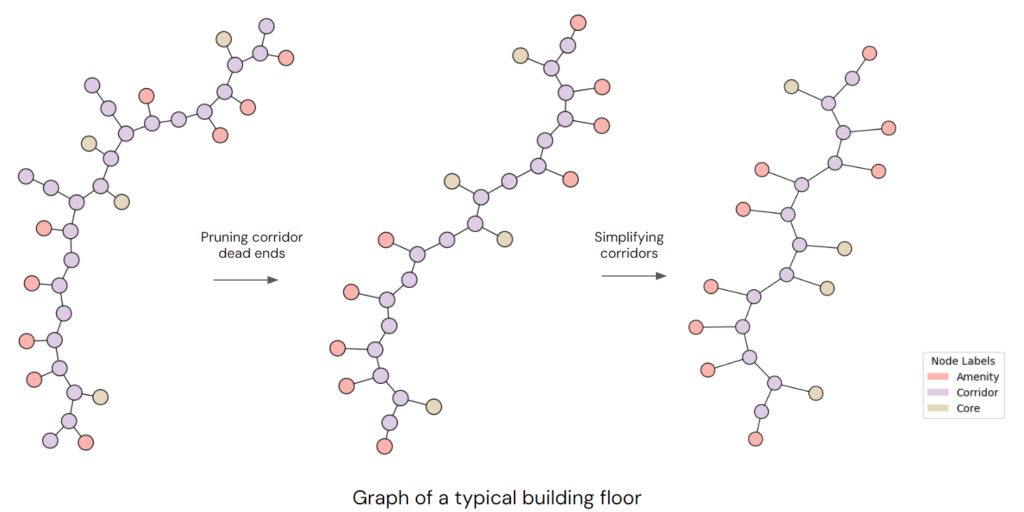
Next, we need to refine the graph by pruning corridor dead ends and simplifying its edge. The edges connecting to the redundant corridor nodes will be merged into one, which will have the sum Length
Pushing building graph to Neo4j Aura
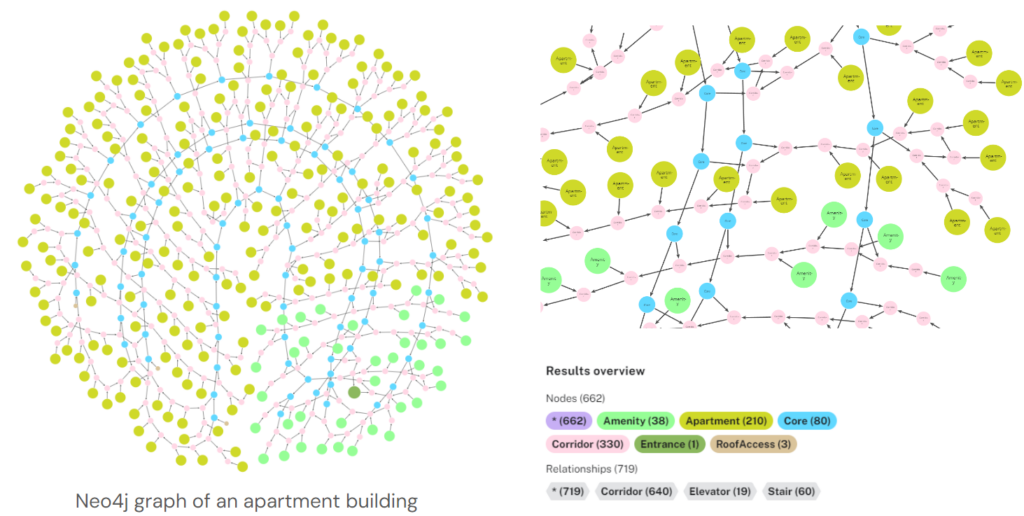
Now, our graph is ready to be send to Aura. It is a live database service from Neo4j.
LLMs for building graph Q&A

The process follows these steps: the user first asks a question, after which the model generates a Cypher query to produce results as the context. The context is then passed to another Q&A model to generate an answer for the user. The Cypher-generating model may require fine-tuning because, in its current state, we suspect it may not consistently produce accurate queries based on our graph. Since the graph schema was custom-designed for our specific case, the model needs to understand the schema properly and generate correct responses to user questions.
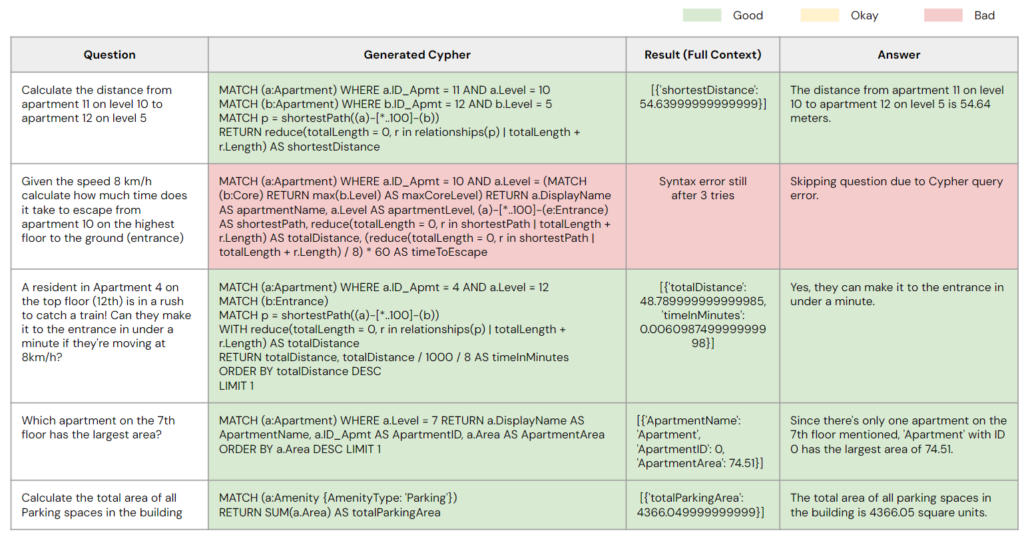
Without fine-tuning
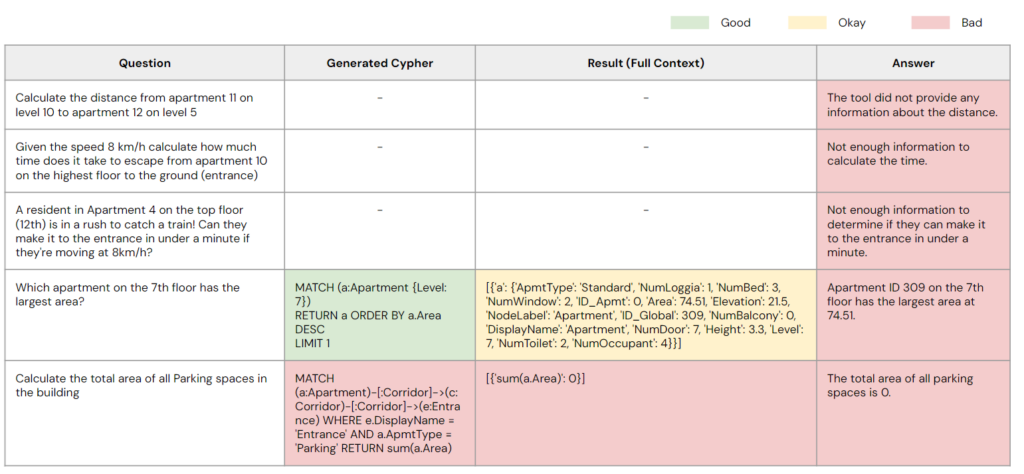
Without this fine-tuning, the model is likely to struggle with interpreting the schema effectively. When questions involve a hypothesis, the model lacks the logical framework to solve the problem. For instance, as shown in the table, the first three questions involve mathematical problems that the model is unable to solve. In the fifth question, which is a simple math problem, the model generates an incorrect Cypher query. While the model produced a correct Cypher query for the fourth question, it overgenerated the result, leaving the model unable to provide an appropriate answer. These issues underscore the need for improvements in the model’s ability to handle both logical reasoning and output management effectively.
Dataset creation: Process
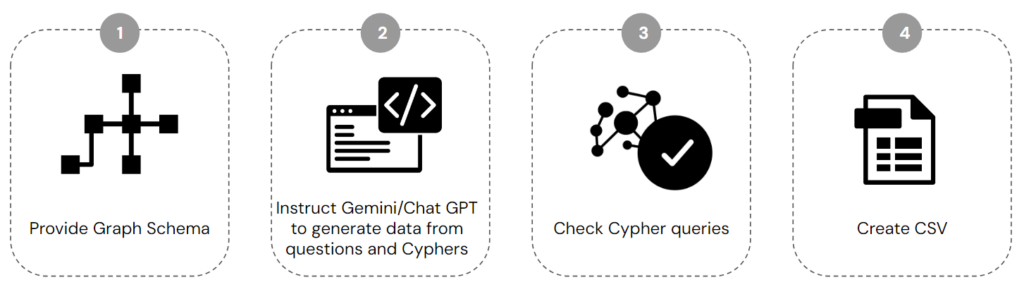
The process of dataset creation consists of 4 steps:
1. Provide Graph Schema
2. Instruct Gemini/ChatGPT to generate data from questions and Cyphers
3. Check Cypher queries
4. Create CSV
Dataset creation: Question categories
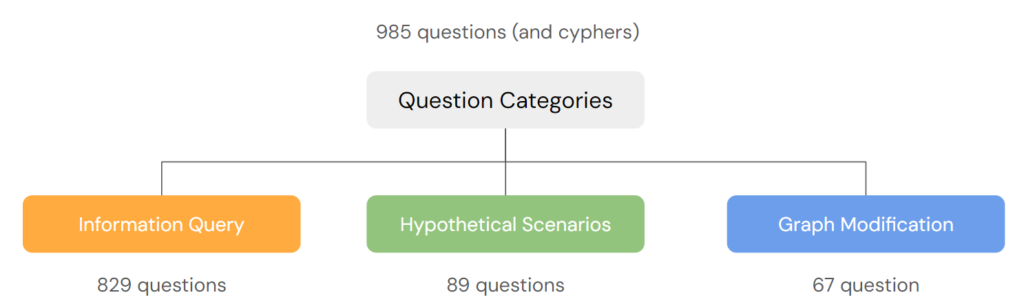
The dataset comprises three primary question categories: Information query with 829 questions, hypothetical scenarios with 89 questions, and graph modification with 67 questions. For further details, please refer to the open-source dataset available at: https://huggingface.co/datasets/evagelnjy/text2cypher
Dataset creation: Information query
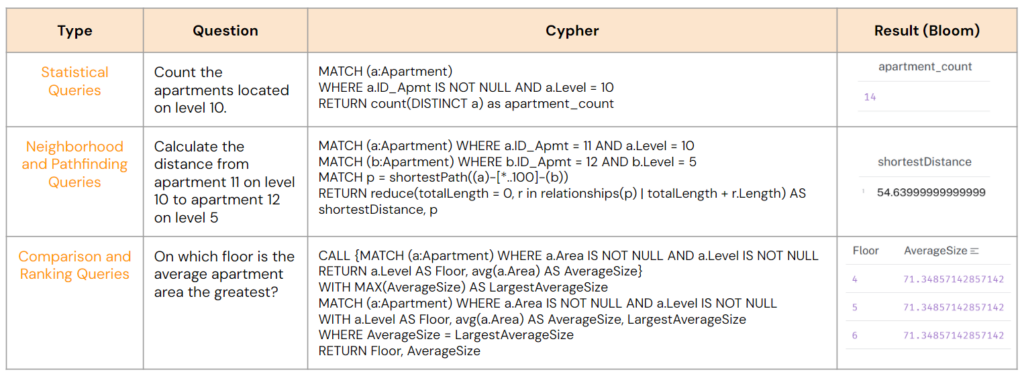
Information query is categorized into three types:
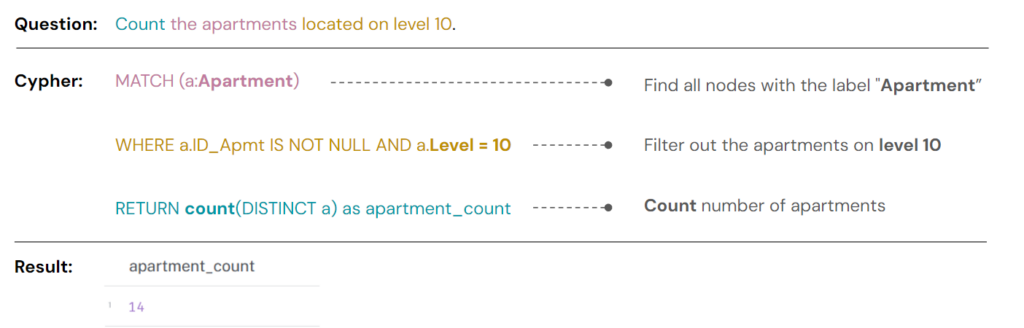
- Statistical Queries: This category covers tasks such as counting the number of apartments, calculating the total area for a specific function, or identifying apartments based on given characteristics.
- Neighborhood and Pathfinding Queries: Examples include calculating distances or finding routes between locations.
- Comparison and Ranking Queries: This involves determining which apartment type is most common or which amenity is the largest.
Dataset creation: Hypothetical scenarios
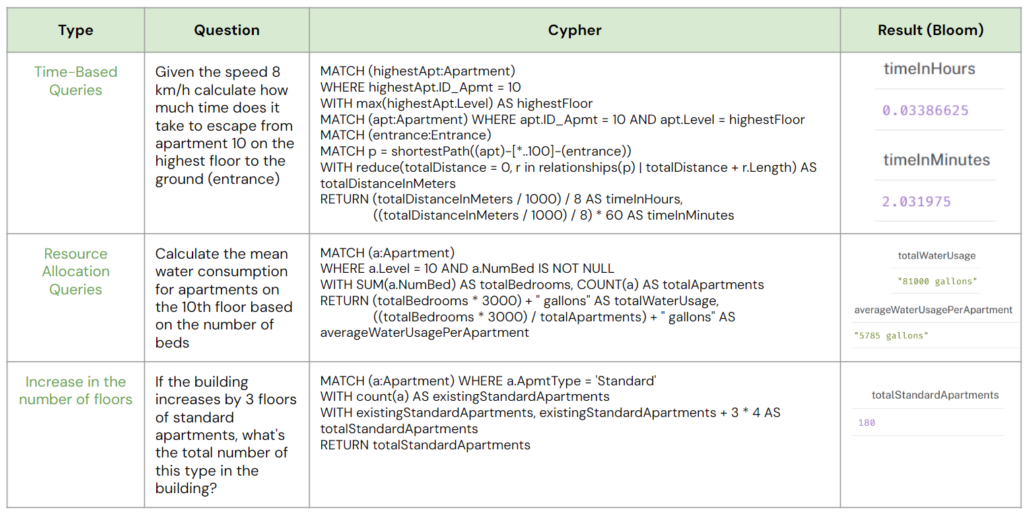
Hypothetical scenarios can be divided into three types:
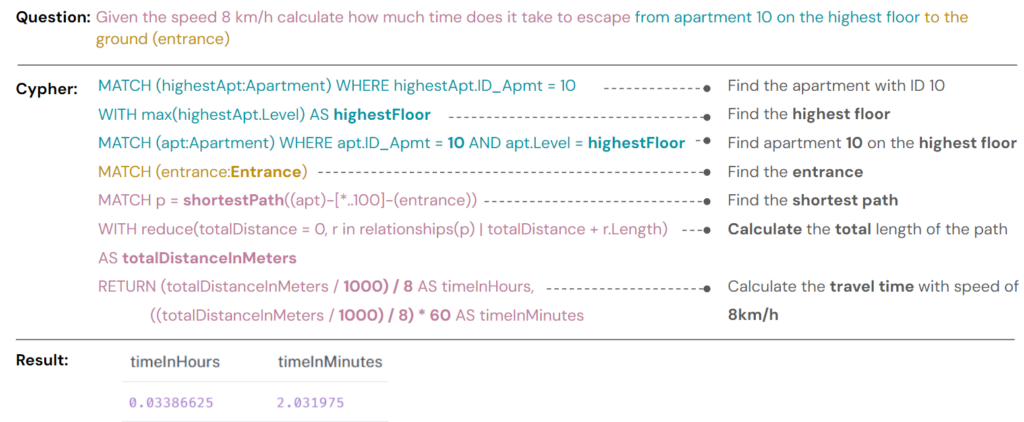
- Time-Based Queries: For instance, calculating the time it takes to travel a specific route given a certain speed.
- Resource Allocation Queries: This includes tasks such as estimating water consumption or determining the number of people present at a certain time based on occupancy rates.
- Floor Expansion Queries: An example would be calculating the number of a specific apartment type if additional floors are added.
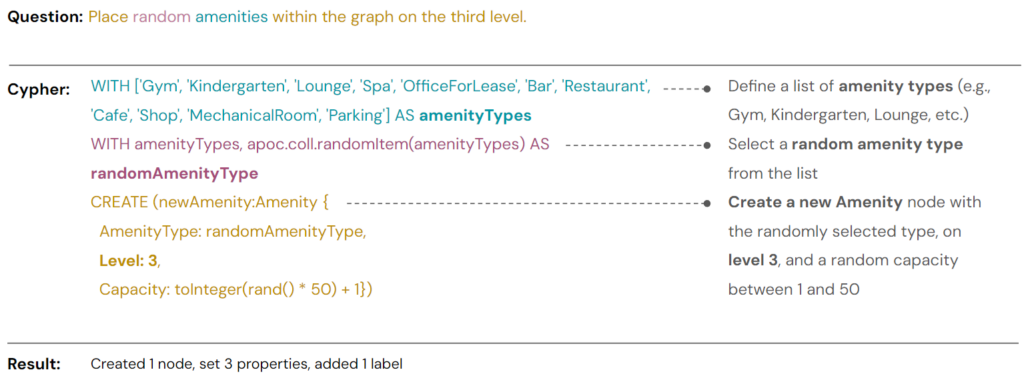
Dataset creation: Graph modification
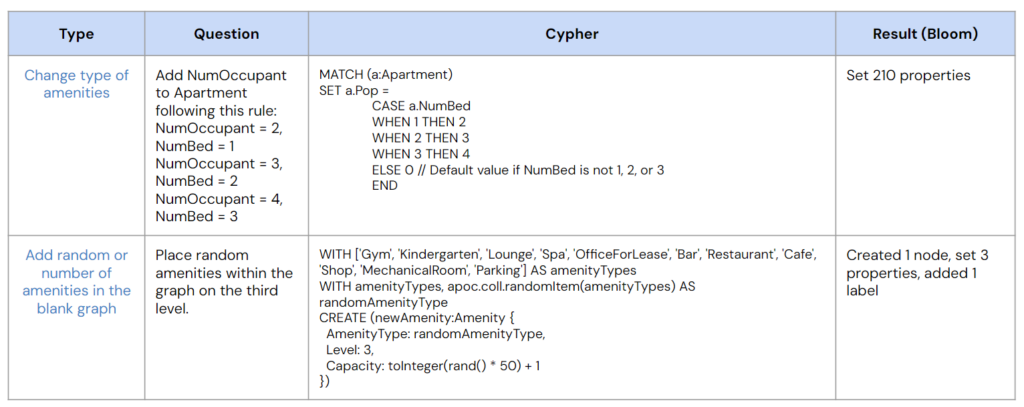
The graph modification category can be split into two types:
- Change type of amenities. For instance, adding new attributes to existing nodes
- Add random or number of amenities in the blank graph. This involves placing a random selection or a specific number of amenities in an empty graph. An example would be adding random amenities to a designated level.
Fine-tuning process
The fine-tuning process involves several key steps:
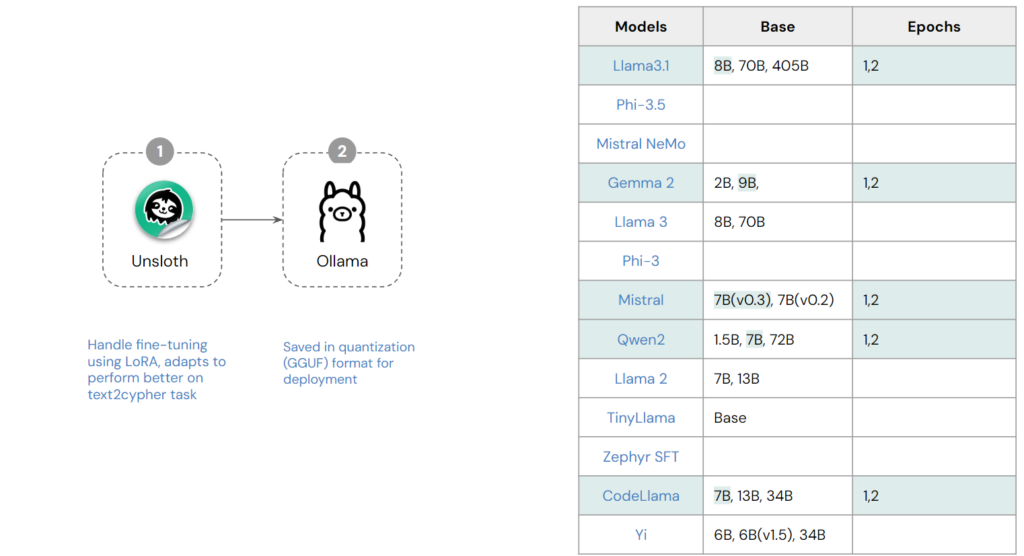
- First, we select an open-source model from a well-known large tech company, choosing one with approximately 7B to 9B parameters to suit our hardware capacity. We train the model for 1 and 2 epochs. Training with 1 epoch allows the model to retain some flexibility and creativity in generating responses, reducing compute power. However, additional epochs improve the model’s ability to meet the specific requirements, so we also train for 2 epochs to enhance accuracy.
- Next, we utilize Unsloth to handle fine-tuning for the text-to-Cypher task. Finally, the based model and it’s LoRA are combined in quantization (GGUF) format for deployment in Ollama
Human evaluation
After fine-tuning, we have humans review and verify the generated code for quality (good or bad). A self-debugging mechanism is also implemented: if the model produces erroneous results after three attempts, it automatically skips the problematic case.
Evaluation metrics
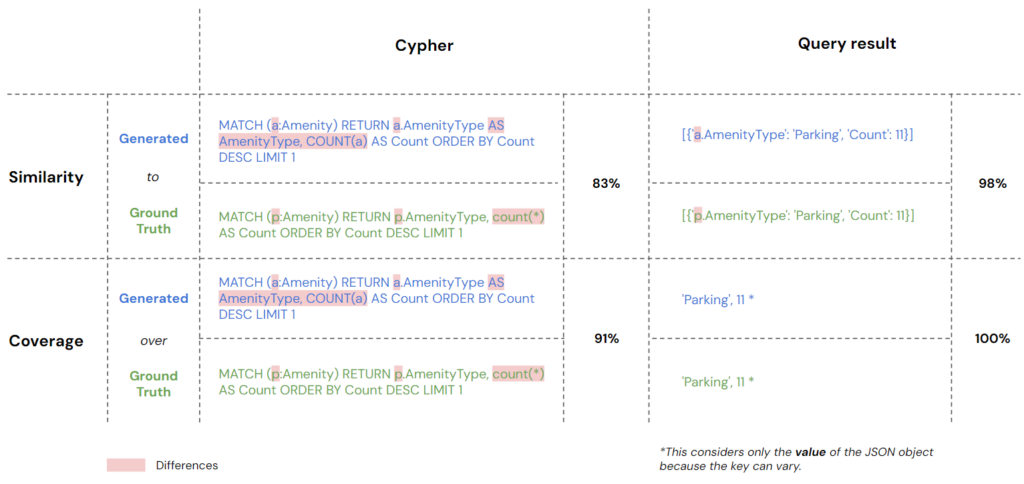
Additionally, we use 2 programmed metrics to compare the generated cypher and its query result to the ground truth query and also its query result
The Similarity metric is to compare how many percent the generated cypher and its query result are similar to the ground truth cypher and result. While the Cypher queries may not be identical, the query results show a high similarity of 98%, with differences only in key naming.
The Coverage metric is to evaluate whether the generated cypher and its result can cover the ground truth. So, even if the generated cypher is over-generated by the model, and its result is excess, as long as the necessary data is included, it’s considered acceptable. This metric on query result focuses solely on the values within the received JSON objects, as the key names (e.g., “a” or “p”) can vary
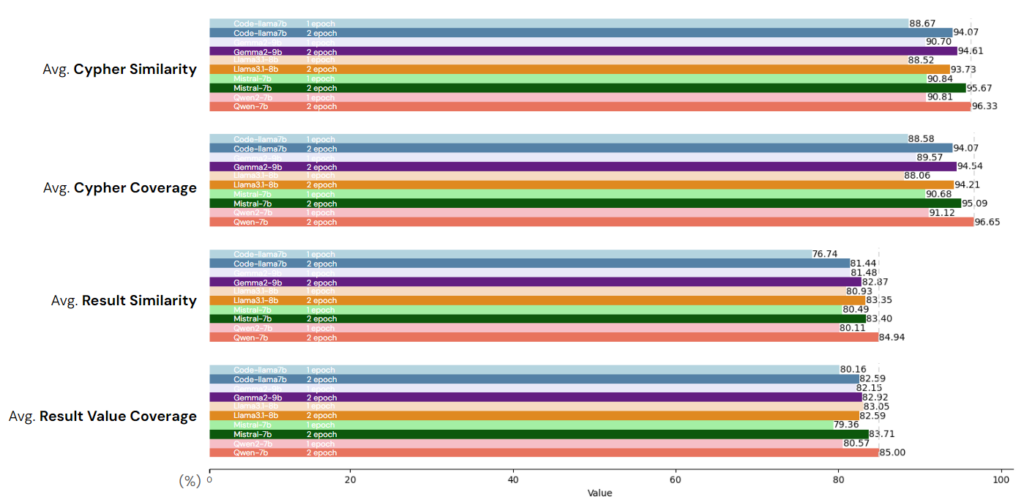
We benchmarked five different models using both 1 and 2 epochs of training. According to our metrics, Qwen7B performed the best. Training for 2 epochs showed a notable improvement over 1 epoch, with a significant performance increase of around 5%.
Deploying an application
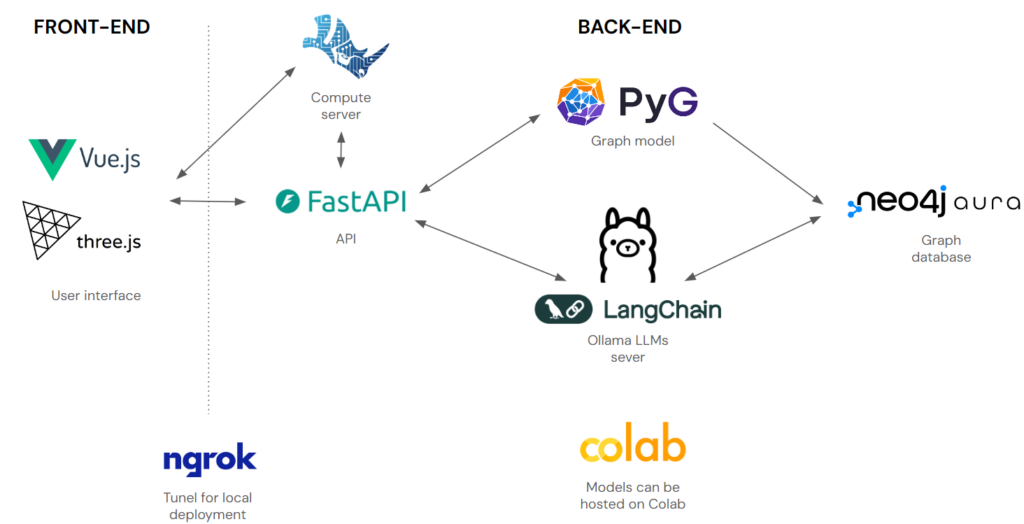
For now, because the performance is slow, we skip the first component classification. The user can generate random building from our tool, or upload their file following our template.
Conclusion
This thesis investigates the spatial graph-based approach to classify spaces in a conceptual 3D building model to construct a knowledge graph for it. Then investigates the potential of graph databases, cypher query languages, and LLMs as a tool for interacting with the building’s knowledge graph, particularly in the early stages of a project, to not just query information but explore design options.
This project also provides 3 datasets: the solid component, the solid space massing, and the text2cypher designed for our building graph
Key Findings:
- By incorporating neighbor awareness, the graph models for 3D solid classification perform significantly better than the basic neural network.
- The graph database and cypher enabled flexible and insightful exploration of design alternatives.
- The performance on fine-tuning open source LLMs for cypher generation is varied; the best one is Qwen 7b from Alibaba Cloud.
- With various tools, all models can be smoothly combined into a single application.
Limitation:
- This project is now only focusing on a specific type of building and specific datasets. So it would require more work to be used within different scenarios.
- Advanced 3D segmentation techniques can also be used to optimize the conversion from solid component to space massing. Benchmarking between various methodologies will be necessary for the project to determine whether this is the best solution for this dataset.
Implications:
- This project contributes valuable insights into the use of graph databases, Cypher queries, and LLMs for architectural design exploration. The implications suggest a potential shift towards a more data-driven, interactive, and collaborative design process, empowering architects to create innovative and optimized solutions from the earliest stages of a project.
Future work
Our future work will go in two directions:
- Building a database for building code, integrating graphRAG
- Using graphs to generate 3d models.
