
01_Introduction :
The growing focus on sustainable transportation, particularly walking and cycling, is not just about reducing CO2 emissions and promoting physical activity, but also about shaping urban planning strategies (Frank et al., 2004). This highlights the importance of evaluating built environments for their ability to encourage sustainable transportation, especially walking, a concept known as Walkability.
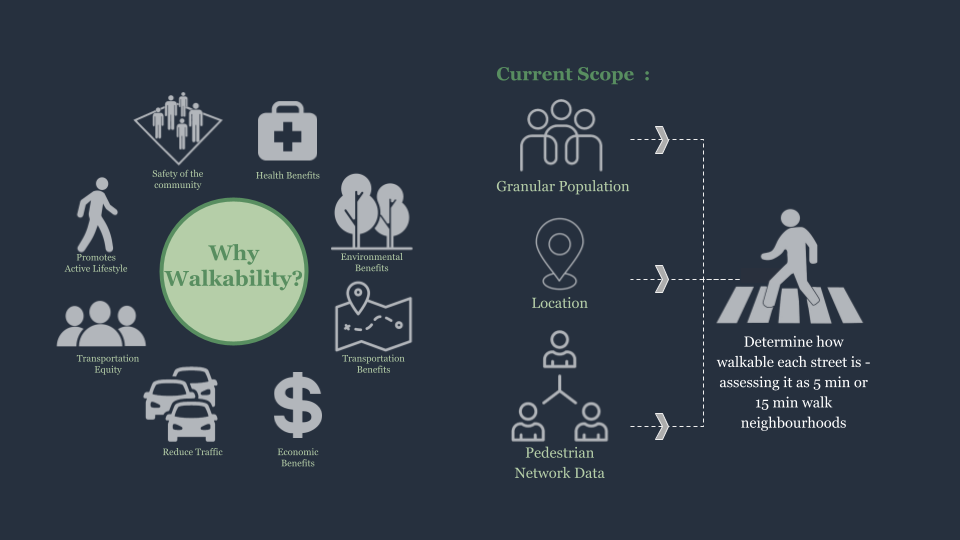
The current scope of Walkability measurement applications involves a detailed analysis of population density and distribution, geographic evaluation of areas for accessibility and connectivity, and the use of pedestrian network data to assess the walkability and safety of pathways. This comprehensive approach provides a robust framework for understanding the dynamics of urban movement and planning.
Possibilities that can be explored further with Walkability Measurement Metrics :
- Data-Driven Tool for Policymakers: The proposal suggests developing an analytical tool that helps policymakers make informed decisions based on direct data inputs, emphasizing a scientific approach to urban planning.
- Analyzing New Designs: By applying walkability metrics to potential new projects, the tool can forecast the pedestrian-friendly nature of these designs, assisting in planning and development decisions.
- Open Platform for Analysis: The creation of an open platform would allow both the public and policymakers to access and analyze proposals and neighborhood layouts. This platform would serve as a critical tool for assessing walkability, ensuring transparency and community engagement in urban development.
02_Research Questions :
Data-Driven Urban Planning and Policy Making :
Innovative Tools for Policymakers: How can a data-driven analytical tool directly assist policymakers in making informed decisions to optimize urban planning?
Public and Policymaker Engagement: How can we create an open platform using public data that enables both the public and policymakers to collaboratively analyze proposals and assess neighborhood walkability?
Design Evaluation and Urban Analysis Automation :
Automating Urban Site Analysis: How can we automate the process of urban site analysis in a systematic, logical, and efficient manner to support transparent and data-backed decision-making in urban development?
Feedback Loop for Designers: How can designers integrate a feedback loop system to continuously evaluate and improve their designs based on walkability metrics and urban analysis?
03_Defining the Proposal :
Tool Building- City Level Analysis :
“A Platform which visualize walkability index in accordance with 5D Criteria i.e Density, Distance to Transit, Destination Accessibility, Diversity of Land Use, Design“
Design Evaluation :
“A Platform which analyzes the Urban Design Proposals based on the 5D criteria of walkability index“
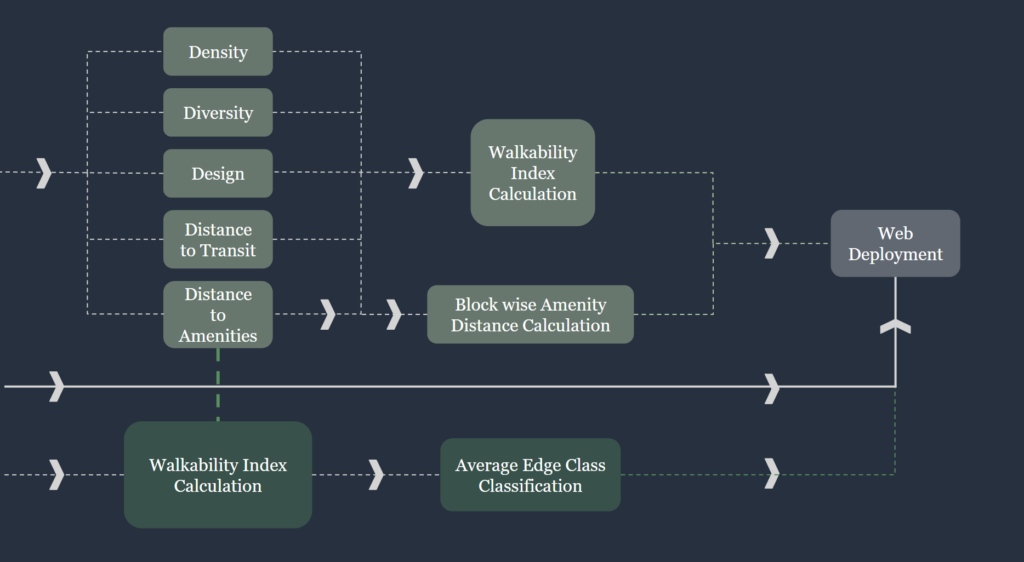
04_Project Workflow :
The workflow integrates a series of data-driven steps, including literature review, indicator standardization, advanced spatial analysis using machine learning and graph theory, and multi-criteria decision-making. The final outcome is a walkability analysis tool that can be deployed online for public use.
The project workflow begins with a literature review and site analysis to gather data, followed by the standardization and computation of walkability indicators like density, diversity, and transit access. These indicators are combined into a walkability index, visualized, and then applied to a city-level analysis (e.g., Copenhagen) using graph theory, machine learning, and MapBox API. Architectural proposals from firms like Cobe, BIG, and Snohetta are evaluated for walkability through a 5D multi-criteria analysis, and geospatial data is converted for further analysis.
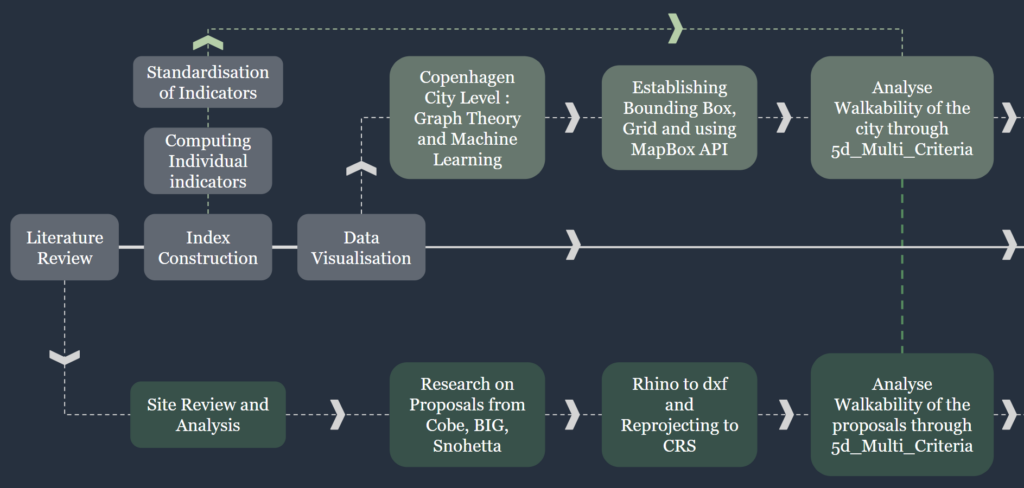
In the next phase, the walkability index is calculated using factors such as design, distance to transit, and amenities, with block-wise analyses for accessibility. Streets and paths are classified based on their walkability, and the results are deployed on a web platform to allow public and policymakers to interact with and assess neighborhood walkability in real time.
05_Walkability Index Construction :
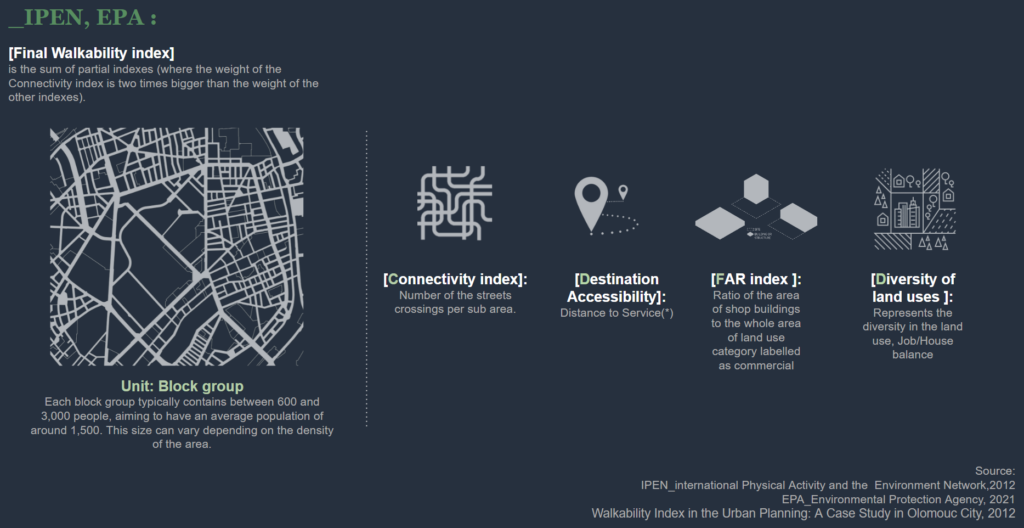
IPEN_EPA :
The methodology by IPEN and the EPA evaluates urban walkability using metrics like the Connectivity Index for street density, Destination Accessibility for service proximity, the FAR Index for commercial space, and Land Use Diversity for mixed-use areas. It emphasizes connectivity to effectively measure pedestrian-friendliness, illustrated through detailed maps and icons.
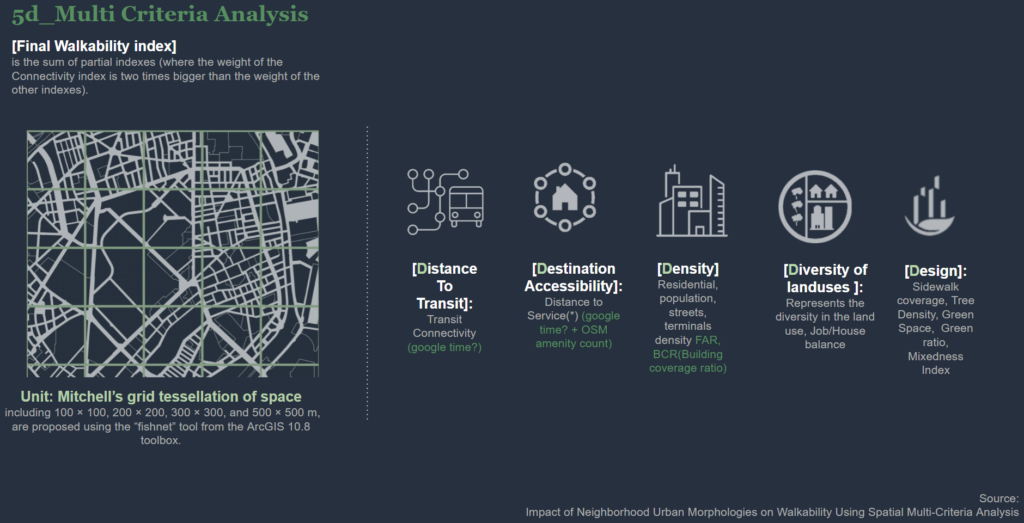
5D_MULTI CRITERIA ANALYSIS :
The “5d_Multi Criteria Analysis” methodology focuses on creating a walkability index using five key metrics: Final Walkability Index, Distance to Transit, and Destination Accessibility. It emphasizes connectivity, weighting it twice as much as other factors. Tools like Google Maps and OpenStreetMap are used to evaluate transit access and service proximity.
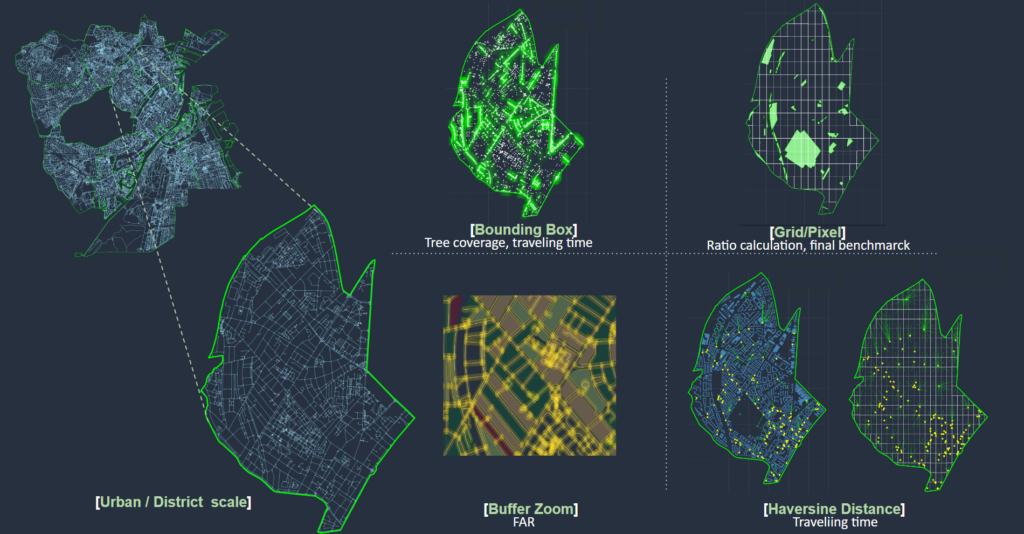
06_Tool Building : Grid, Bounding Box and Buffer Zone
Various GIS tools were used in building the tool . It featured different layers including an urban district scale for broad structural layouts, a bounding box for localized data analysis like tree coverage, and buffer zones to assess impacts within specific radii. Additionally, a grid/pixel layer for detailed ratio calculations and the Haversine formula was used to measure distances and connectivity. This multi-layered approach facilitated comprehensive analysis and decision-making in the tool building process.
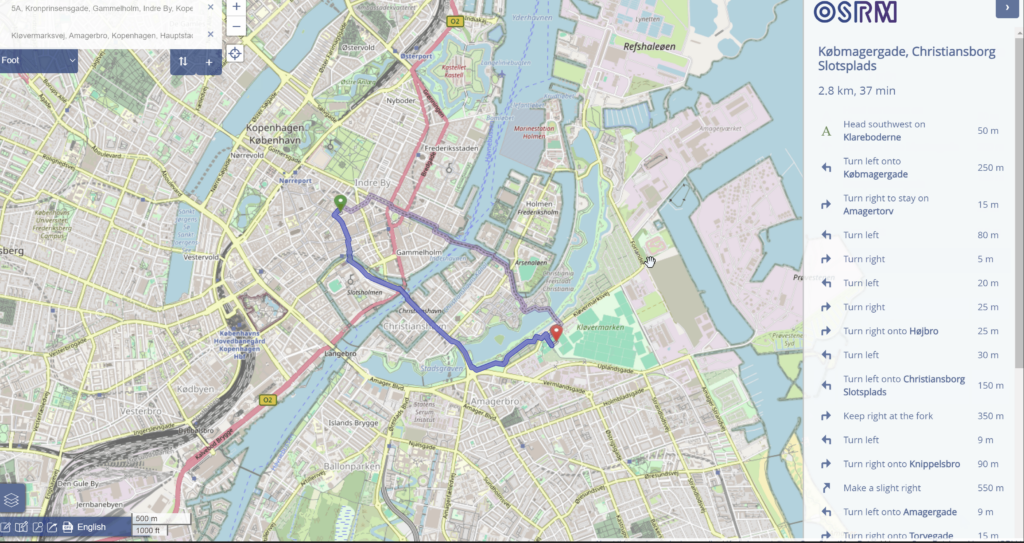
API_Travelling time :
In the first trial, “API_traveling time,” employs the Open Source Routing Machine to calculate the fastest travel times between coordinates, leveraging tools like ngrok and Docker for local hosting and API management.
API_Mapbox Tiling :
In the second methodology, “API_mapbox tiling,” uses the Vector Tile API from Mapbox to handle large datasets efficiently by querying 380 tiles, allowing detailed geospatial analysis of urban elements such as building heights and types, illustrated through various visualizations that filter and categorize buildings and non-buildings within a cityscape. These tools and techniques provide powerful, scalable solutions for real-time urban data analysis and visualization.
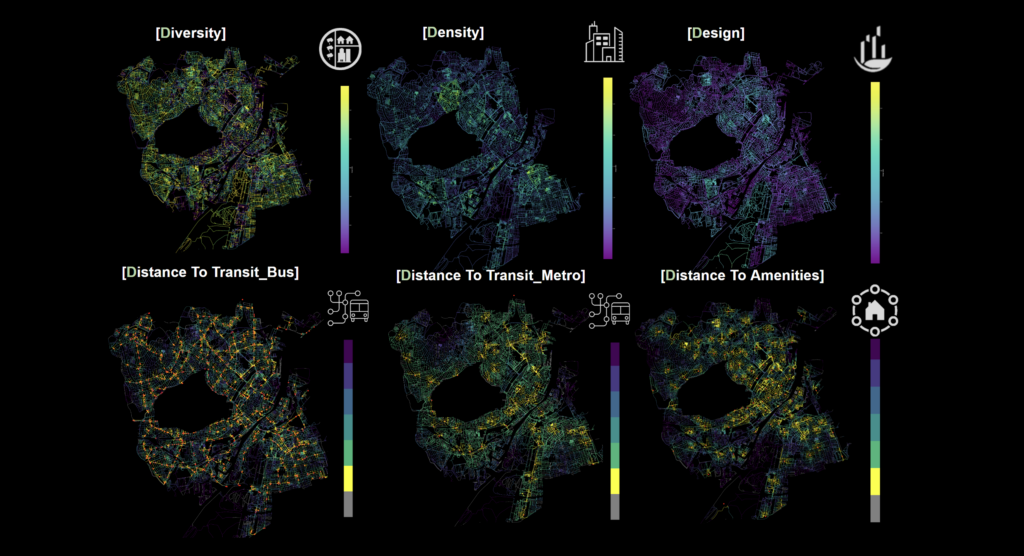
07_5D Multi -Criteria Analysis :
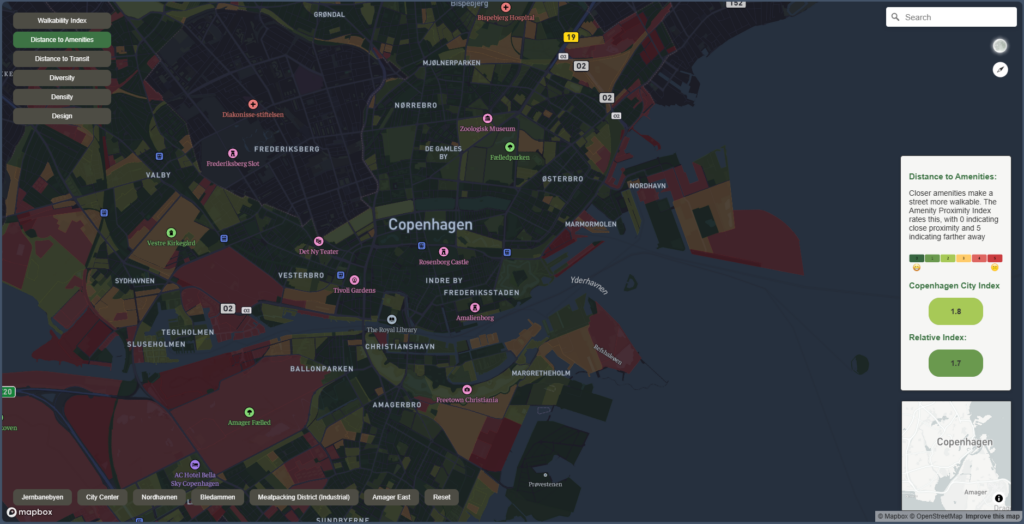
The 5D multi-criteria analysis applied to Copenhagen effectively visualizes key urban metrics such as land use diversity, population density, urban design, and proximity to bus and metro transit, along with other critical amenities. By employing color gradients, these maps depict variations across the city, offering a comprehensive view of the urban landscape. This detailed visualization aids urban planners and stakeholders in identifying strategic areas for development or improvement, thus facilitating informed decisions to enhance Copenhagen’s livability and sustainability.
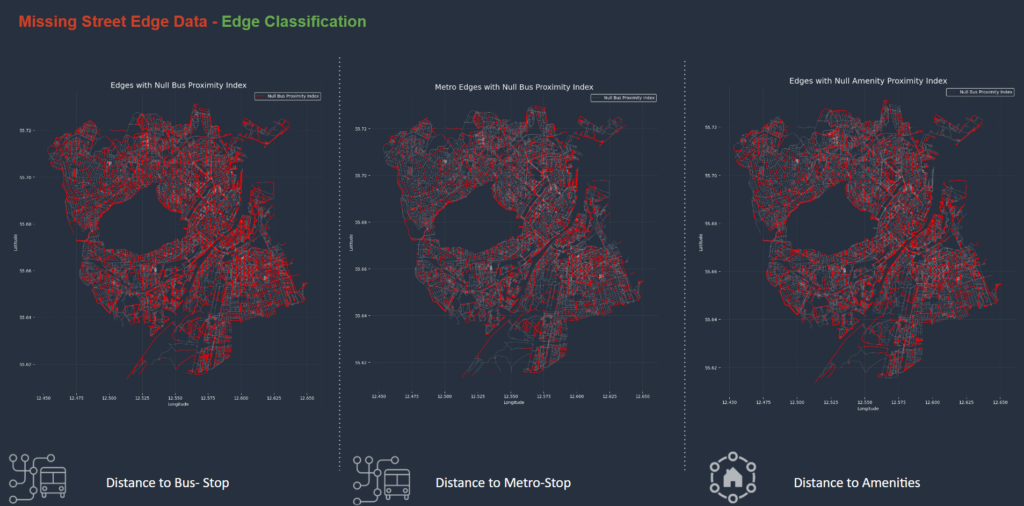
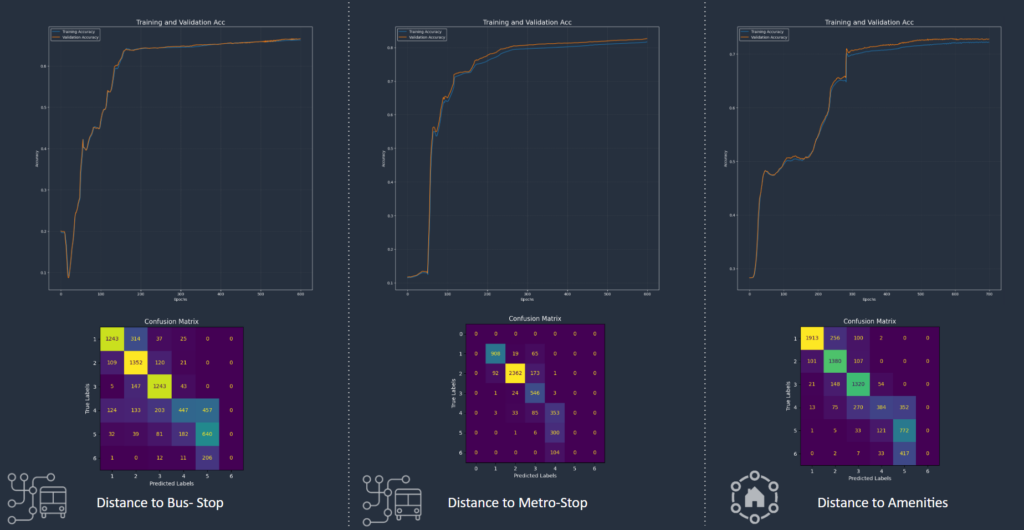
08_Graph ML for Missing Street Edge – Edge Classification :
Graph machine learning is a subfield that uses graph structures to analyze and predict relationships between interconnected data points, employing techniques like graph neural networks.During our analysis, we identified missing data for Distance to Bus, Metro, and Amenities, prompting us to apply graph machine learning and edge classification to fill these gaps.
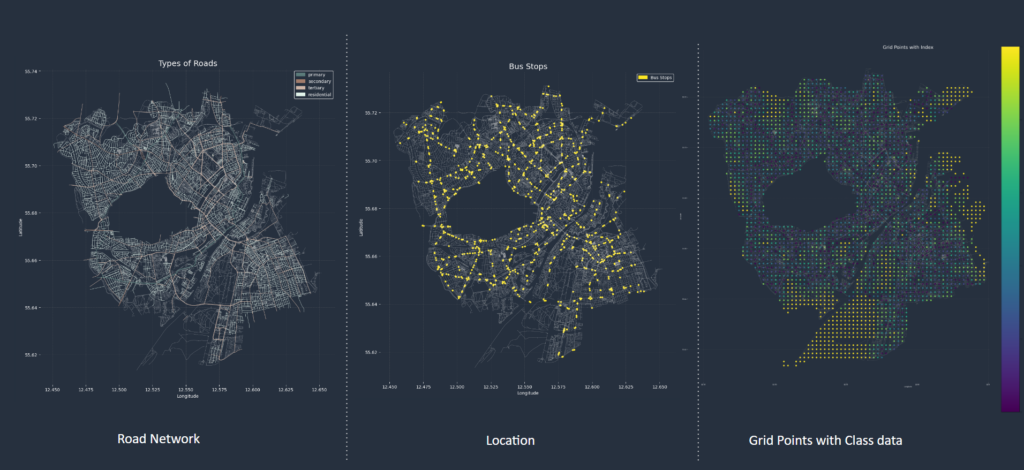
DATASETS AND DATASET PROCESSING :
Our primary datasets include the road network, the locations of bus stops, metro stations, amenities, and grid point class data.The road network is categorized into primary, secondary, tertiary, and residential roads, with each category transformed into distinct features for analysis. Likewise, the grid points, which are divided into six classes, are treated as individual features, as depicted in the accompanying figure.
The modeling process begins by loading the city graph nodes and edges using OSMnx. Once the graph is established, we assign features to the nodes and edges based on the collected datasets. Given that our objective is to predict the missing edge classes, we utilize an edge classification method.This process involves assigning dataset features to nodes within a specified radius, allowing us to link these features to the edges for accurate classification. By doing so, we can enhance the model’s ability to predict and fill in the missing data effectively.
Training and Final Completed Graphs :
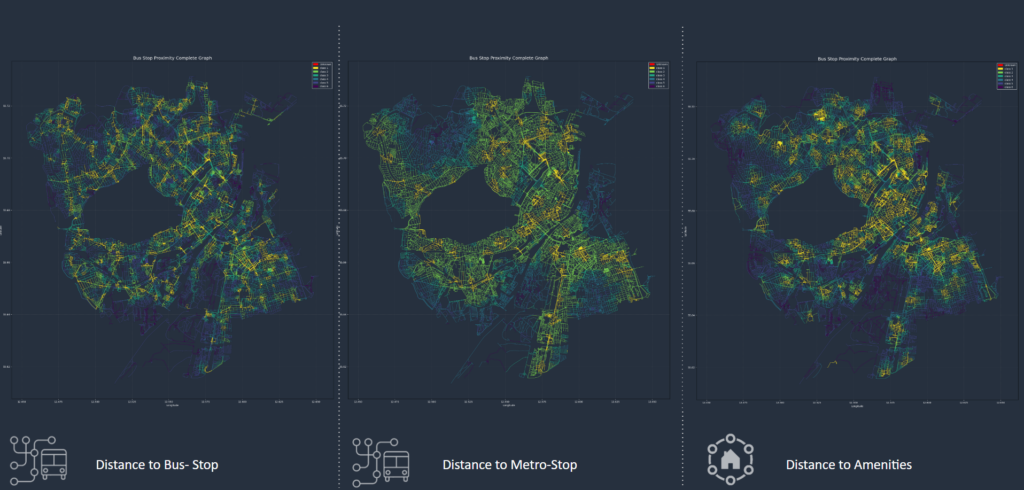
Once features are assigned, classes are allocated to nodes, identifying those with missing classifications. The graph is then converted to DGL for graph machine learning, starting with preparation for transductive edge classification and model training. The model achieves 70 to 80% accuracy, with balanced training and validation curves indicating no overfitting or underfitting. The confusion matrix shows strong predictions for classes 1 to 4, but weaker for classes 5 and 6. The final analysis highlights Copenhagen’s strong transit facilities, though accessibility to amenities diminishes further from the city center.
09_Tool Deployment : Copenhagen City Scale
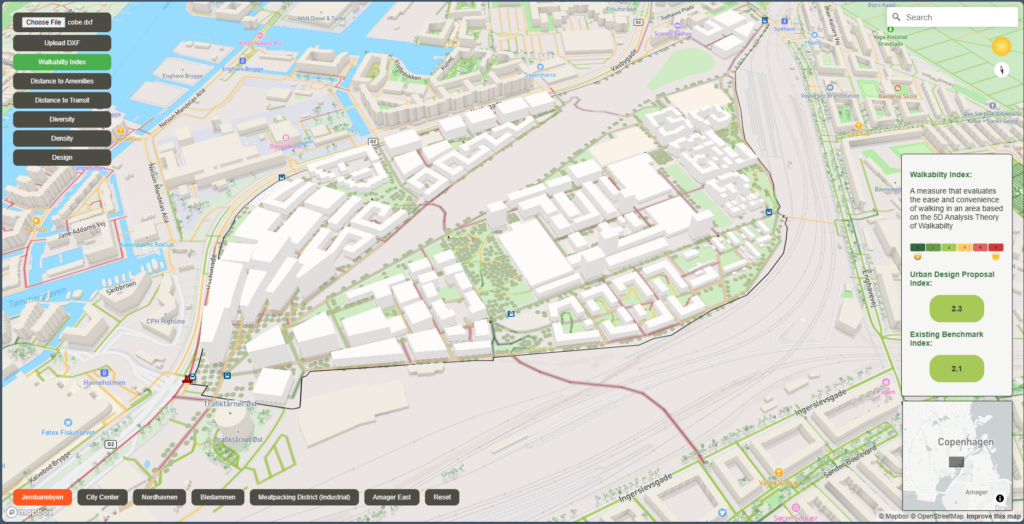
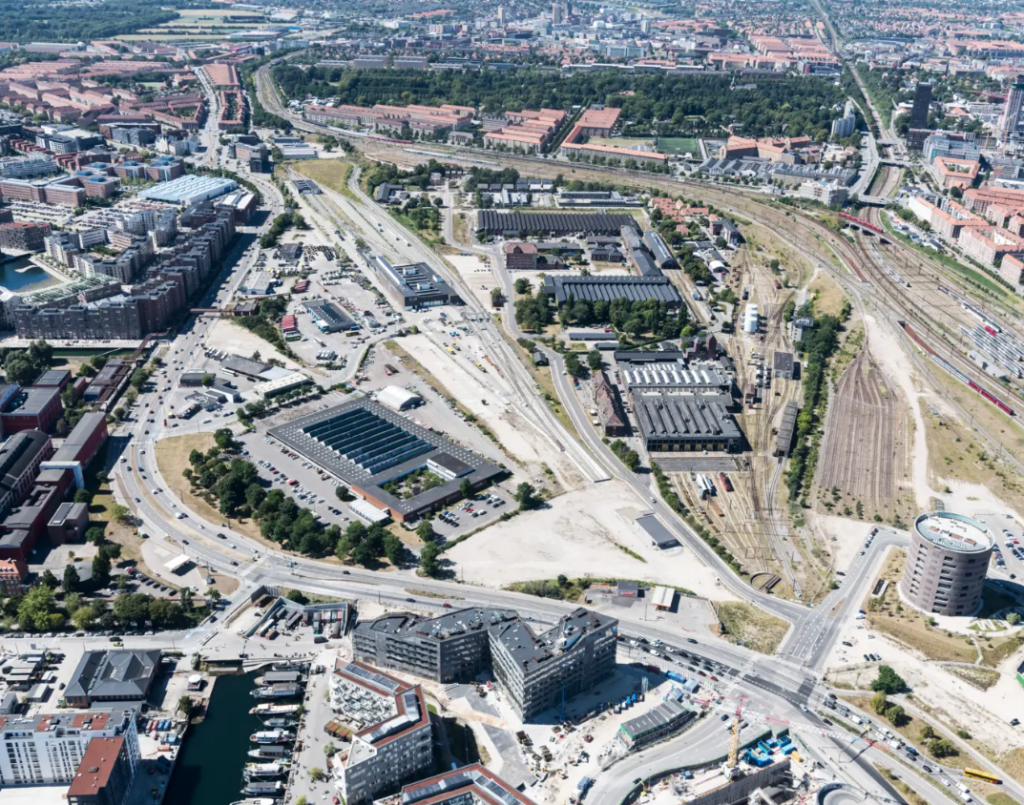
10_Walkability Analysis : Jernbanebyen Scale
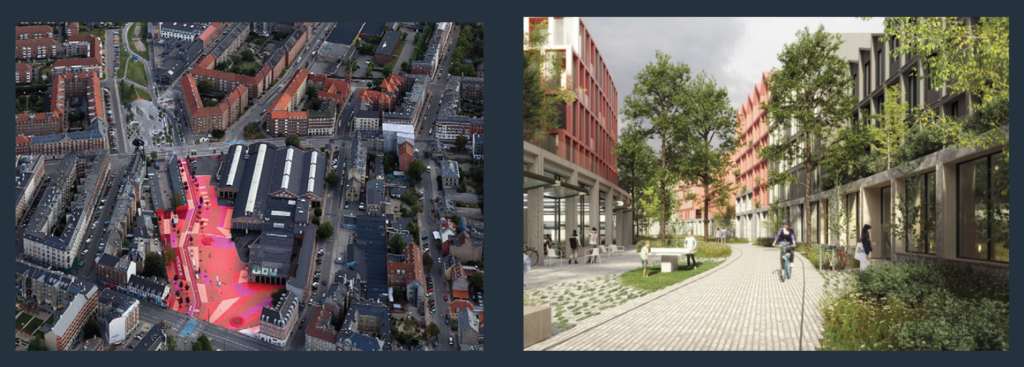
“Jernbanevien: The Railway District“ features a central area in Copenhagen. Covering 550,000 square meters, it stands as one of the last undeveloped industrial zones in the city. Recognized as a global pilot project by the C40 city network, it serves as a model for sustainable urban development. The key events and transformations for the railway district includes the establishment of a freight station in 1901, the creation of allotment gardens for World War II refugees in 1939, the repurposing of railway warehouses in 1985, and the adaptation of a school into temporary housing for politicians in 2007.
In 2020, an architecture competition involving five interdisciplinary teams took the form of a parallel assignment, with each team submitting proposals. These proposals will serve as foundational urban designs for analysis using a specialized tool. Cobe Architects emerged as finalists and have detailed their proposal on their website, which is utilized as a primary data source. Additionally, BIG and Snohetta, also finalists, have extensively documented their proposals on their respective websites, further enriching the data sourcing for our tool.
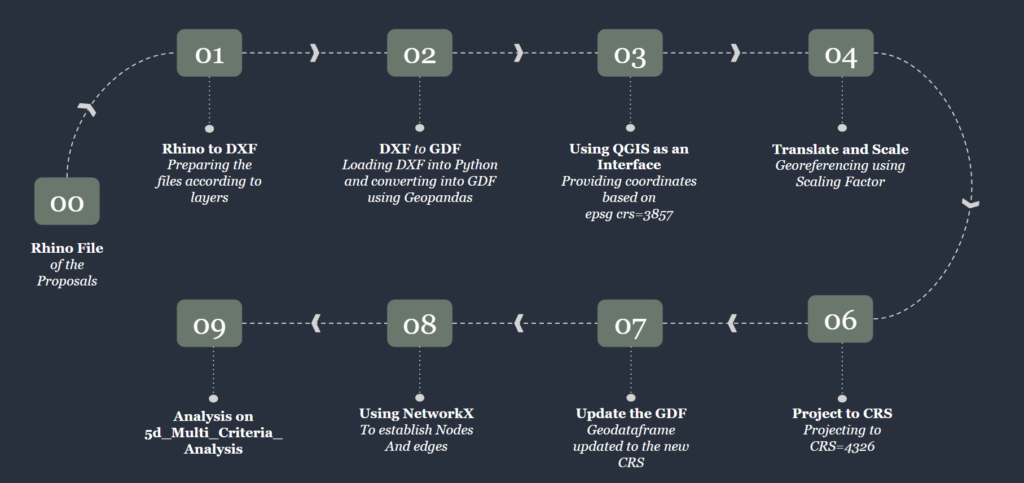
Site Analysis : Initial Workflow – Steps Leading to Analysis
The workflow outlines a process for converting and analyzing architectural proposal data. It begins with Rhino files of the proposals, which are first prepared in layers and then converted to DXF format. Subsequently, these DXF files are loaded into Python and transformed into GeoDataFrames (GDF) using GeoPandas. The process continues with QGIS serving as an interface to provide coordinates based on the EPSG CRS-3857. Following this, the data undergoes georeferencing adjustments using a scaling factor and is then projected to the CRS-4326 coordinate reference system. Once in the appropriate CRS, the GeoDataFrame is updated to reflect the new coordinate system. Using NetworkX, nodes and edges are established to create a graph structure of the data. Finally, a detailed 5D multi-criteria analysis is performed on the adjusted data to assess various aspects of the architectural proposals. This comprehensive workflow facilitates the thorough evaluation of urban design proposals by transitioning through multiple stages of data manipulation and analysis.
File Preparation for Processing :
The documented proposals are systematically converted into Rhino files based on a specific set of rules, facilitating the seamless transfer of data into DXF format for further Python analysis.
Rules for Processing the File:
- All elements must be modeled within designated layers to maintain organization.
- Sub-layers should be used to categorize data; for instance, within the “Buildings” layer, additional sub-layers for residential, commercial, etc., should be created.
- Consistency across documents is ensured by adhering to a predefined layer naming convention.
- Additional attributes like building height and street types are encoded using specific line types.
QGIS serves as the interface, providing coordinate data based on the EPSG:3857 standard, thus supporting the accurate positioning and mapping of the architectural elements.
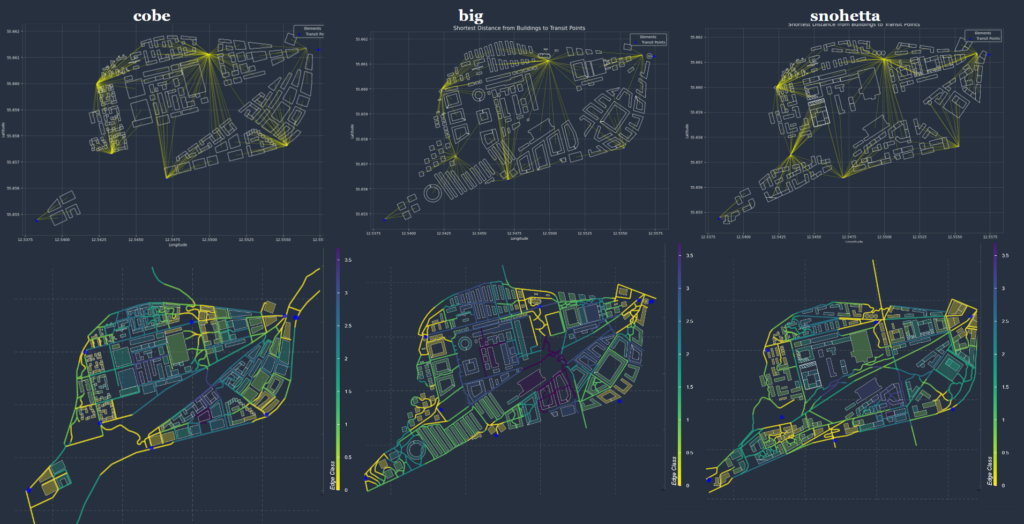
11_Benchmarking Design Proposals :Cobe,BIG and Snohetta
The analysis process involves examining key urban elements such as land use, block compactness, and other spatial features. The workflow begins with converting DXF files into a graph format, which allows for a more structured and detailed analysis. Once the data is transformed, queries are conducted to evaluate various urban components, including land use patterns and block compactness.
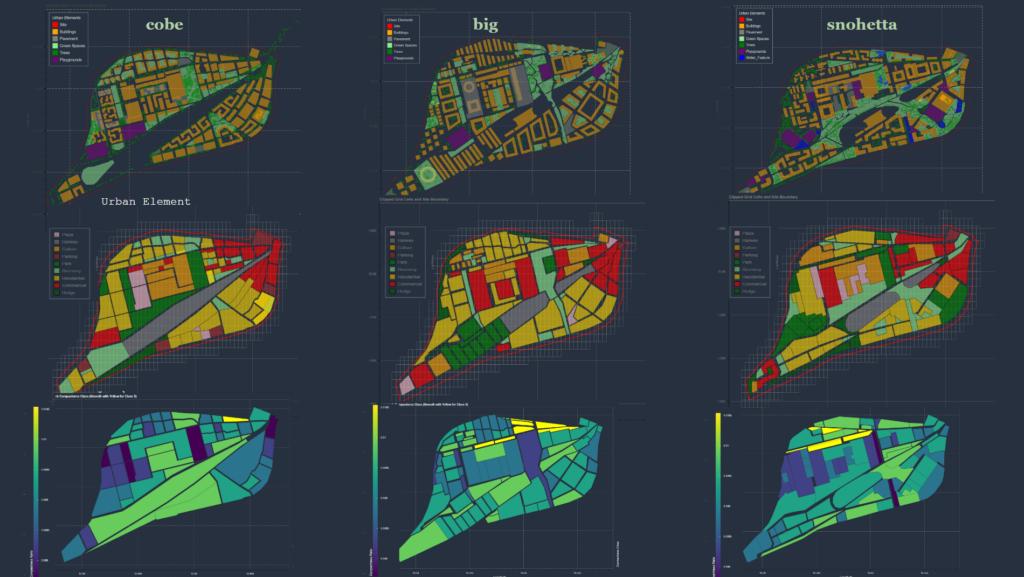
11.1_Design Dimension :
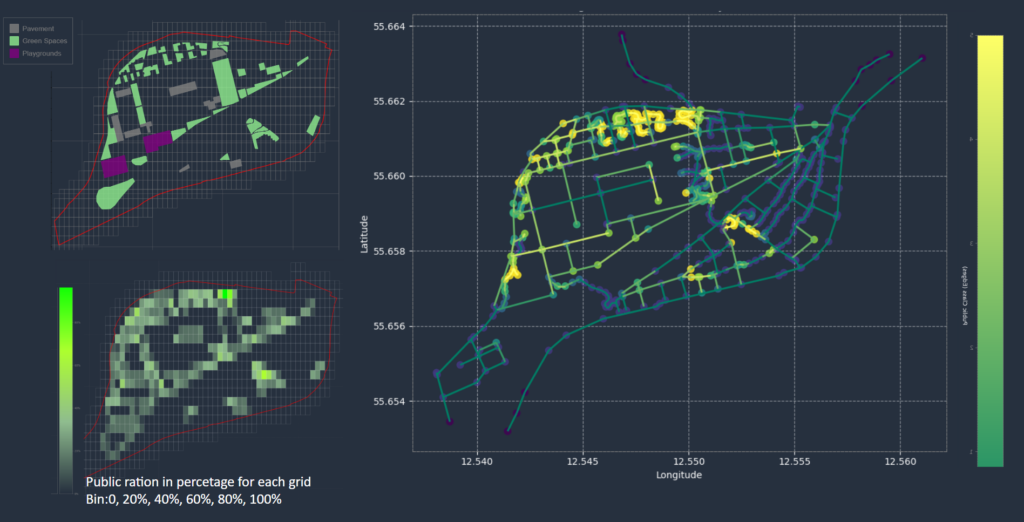
Tree count and public space ratio are two critical factors in the design component. We define greenery, parks, plazas, and playgrounds as public spaces and calculate the percentage of public space within each grid. In this analysis, the park pathways stand out with higher values for both tree count and public space ratio, indicating a rich concentration of trees and an ample proportion of accessible public areas.
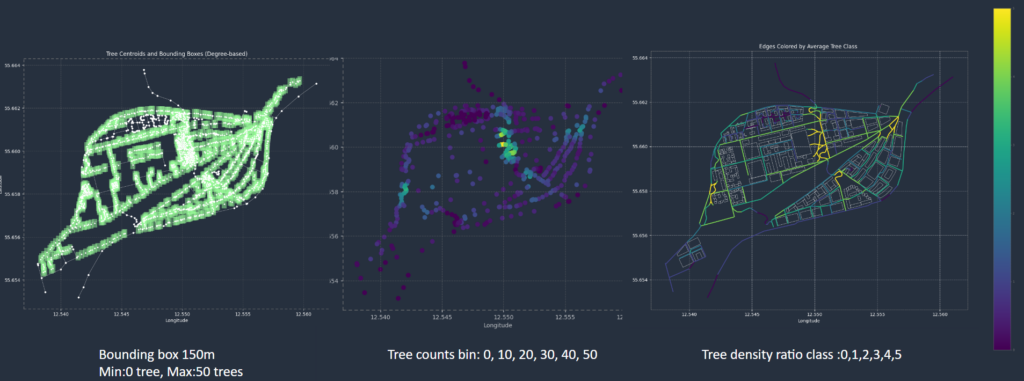
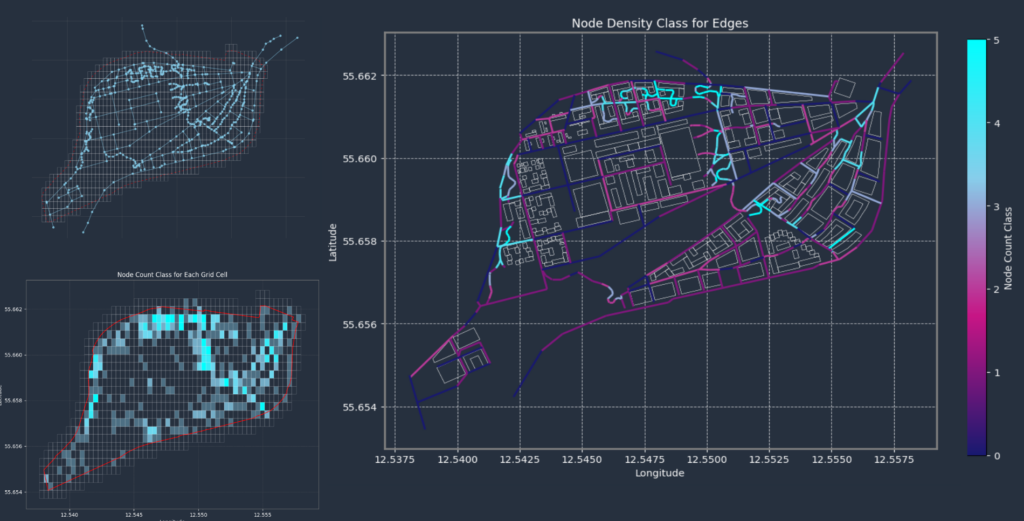
11.2_Density Dimension :
The node density analysis shows that park pathways with multiple turns have higher density values. This suggests that the winding routes create more connectivity points, contributing to a denser and more accessible network within the park.
11.3_Diversity Dimension :
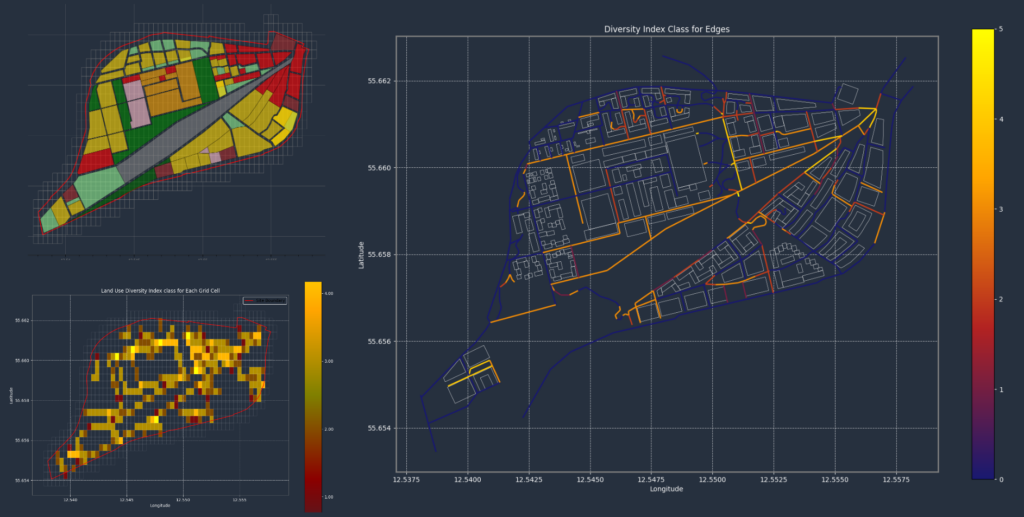
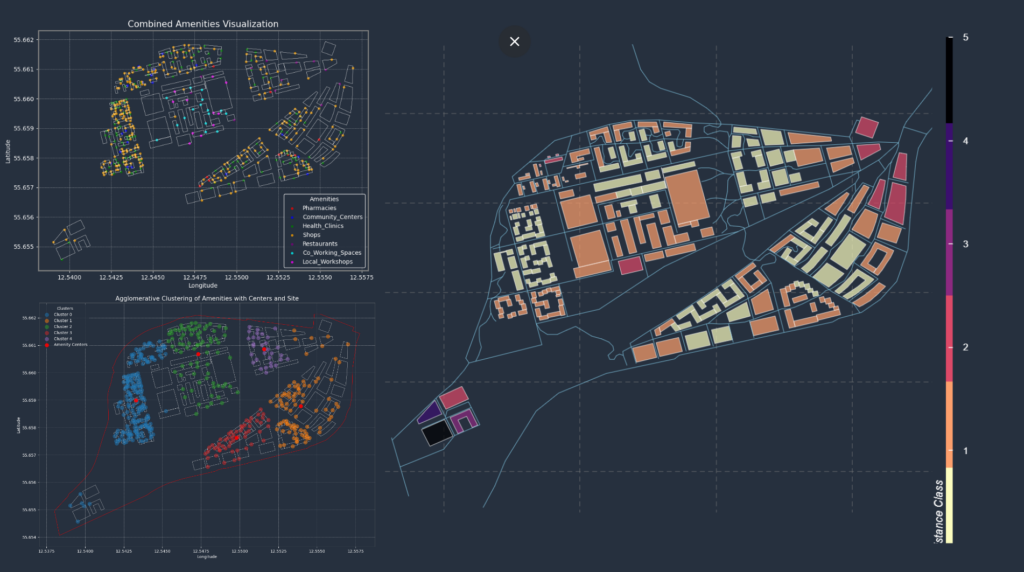
11.4_Amenity Distribution and Distance to Amenities :
Jernbanebyen will form the framework for a new urban development where past and present merge, providing 4,500 new homes and workplaces for 8,000 people. Jernbanebyen will be a dense city district with more than 11 hectares of green areas and 8 hectares of green streets.
Amenity Factors (Defined using 15-Minute City Principle) :
This concept aims to ensure that key amenities (such as shops, healthcare, and workplaces) are within a 15-minute walking distance from residents, promoting walkability and reducing car dependence.
Amenity Demand Profiles :
This section defines demand profiles using Python code. The profiles indicate what percentage of each type of amenity is necessary based on the population’s needs. This breakdown helps city planners understand how much space and resources are required for different amenities based on population demand.This methodology presents an analytical and data-driven approach to urban planning for Jernbanebyen, using Python to model activity demand profiles and spatial allocation of amenities. The workflow aligns with the 15-minute city concept to ensure sustainable, accessible living with a mix of residential, commercial, and civic amenities distributed based on population needs. These numbers are then used in the grasshopper workflow for visualisation
11.5_Distance to Transit :
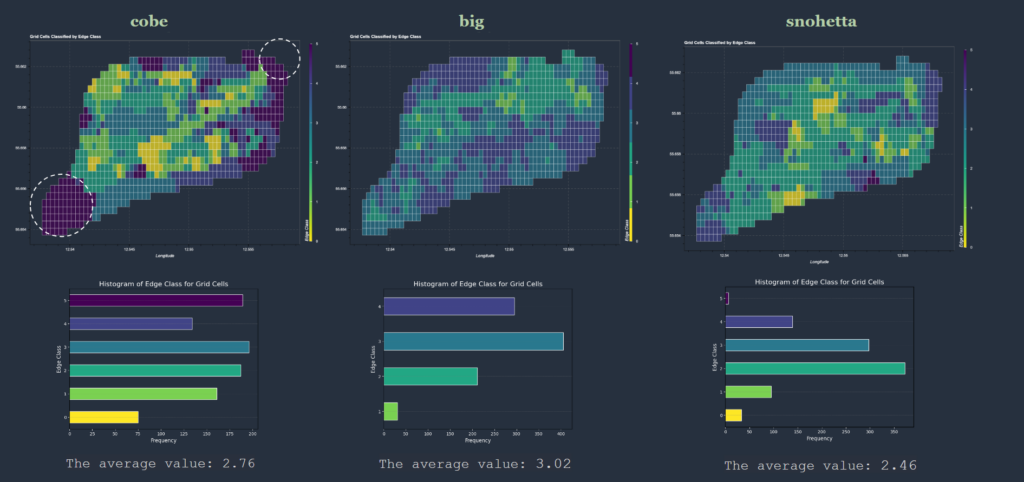
12_Benchmarking Indices using Pixelation :
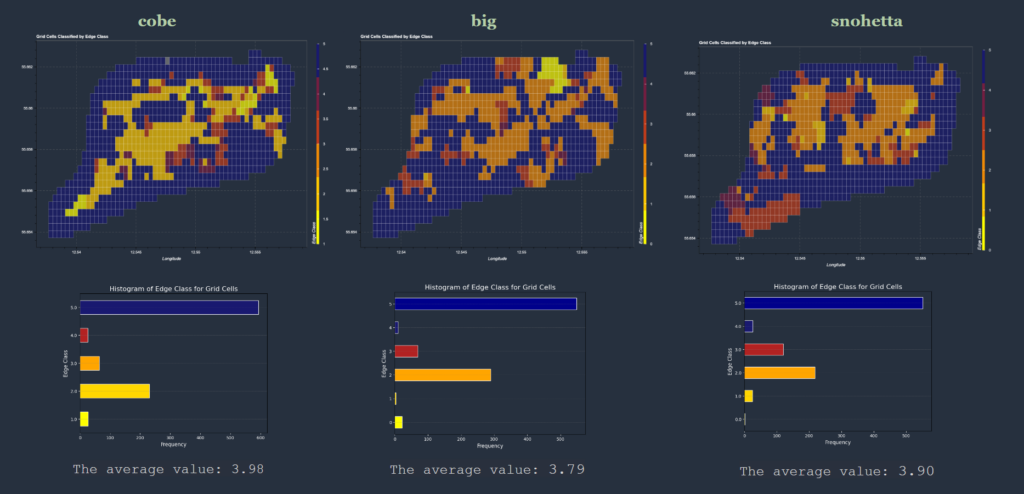
In the benchmarking session, we organize all components into a pixelated format allowing for more precise classification and comparison.Pixellation method enhances the effectiveness of evaluating each component‘s contribution.
Design Index:
Below is the design score, reflecting the combined impact of factors like tree count, public space ratio, and land use diversity.A higher number of intersections between various land-use categories within a single grid significantly boosts its value. These diverse intersections create a more dynamic and multifunctional space, enhancing accessibility and walkability by bringing different amenities and services closer together.
The Cobe proposal successfully creates a centralized public space, fostering a vibrant, accessible hub for community interaction.
Diversity Index:
Density Index:
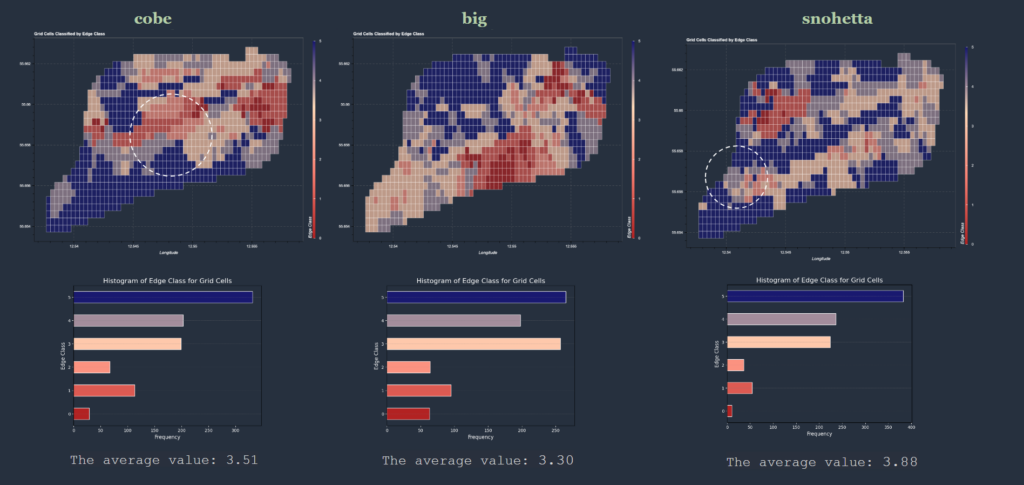
Distance to Amenities Index:
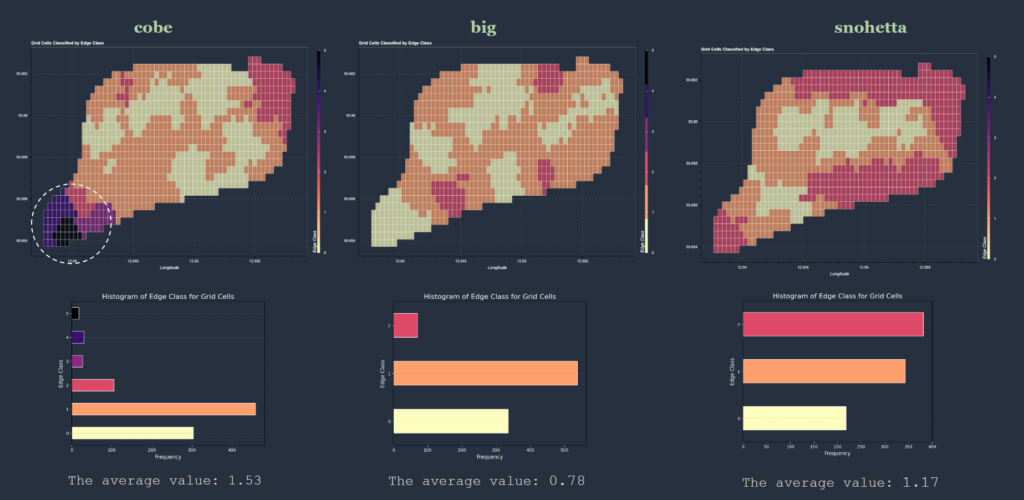
Distance to Transit Index:
13_Benchmarking Final Walkability Index :
13_Benchmarking against Norrebro :
A final benchmark comparison was conducted between Jernbanebyen, a newly planned district, and Nørrebro, an older neighborhood in Copenhagen. This comparison enabled the evaluation of differences in walkability between the two areas. By analyzing factors such as connectivity, green space ratio, and land use diversity, valuable insights were gained into how the new development aligns with or diverges from traditional Copenhagen urban planning characteristics.
14_Web Deployment : Jernbanebyen Scale :
References :
1.”An Adaptive workflow to generate street network and amenity allocation for Walkable Neighborhood Design.”
https://www.proceedings.blucher.com.br/article-details/using-open-data-to-derive-local-amenity-demand-patterns-for-walkability-simulations-and-amenity-utilization-analysis-34315
2.”Using open data to derive local amenity demand patterns for walkability simulations and amenity utilization analysis.”
https://www.researchgate.net/publication/361123235_Using_Open_Data_to_Derive_Local_Amenity_Demand_Patterns_for_Walkability_Simulations_and_Amenity_Utilization_Analysis
3.”Interactive urban synthesis computational methods for fast prototyping of urban design proposals.”
https://www.researchgate.net/publication/315183895_Interactive_Urban_Synthesis_Computational_Methods_for_fast_Prototyping_of_Urban_Design_Proposals
4.”Impact of neighborhood urban morphologies on walkability using spatial multi-criteria analysis.”
https://www.mdpi.com/2413-8851/8/2/70
5.”Big data informed urban design and governance.”
https://www.researchgate.net/publication/331521181_Big_Data_Informed_Urban_Design_and_Governanc 6.”Is Seattle a 15-minute city? It depends on where you want to walk” https://nathenry.com/writing/2023-02-07-seattle-walkability.html
