Some Japanese monk said “Eat well, work hard, and sleep well. This harmony is the basis of a good spirit.”
From this maximum, I assumed the cities with a good work-life balance, have many delicious restaurants.
Subject goal
In this class, I make the graph from the open data by Pthon.
Hypothesis
There are many restaurants that have Michelin stars in the cities that have a high score and are high rank.
As well as, The cities in which there are many restaurants, are good scores and work-life balance.
Data
I use two data. Both data are used from Kaggle.
・Michelin Restaurants This data is originally from the Michelin Guide. Someone scrapped.
・Cities with the Best Work-Life Balance 2022 This data is originally from this site.
In my case, I made the bar chart graph from these data.
Research
The Michelin Gude Rstaurant data.
I made Top 15 cities. the number of stars. and separated the rank of the star.
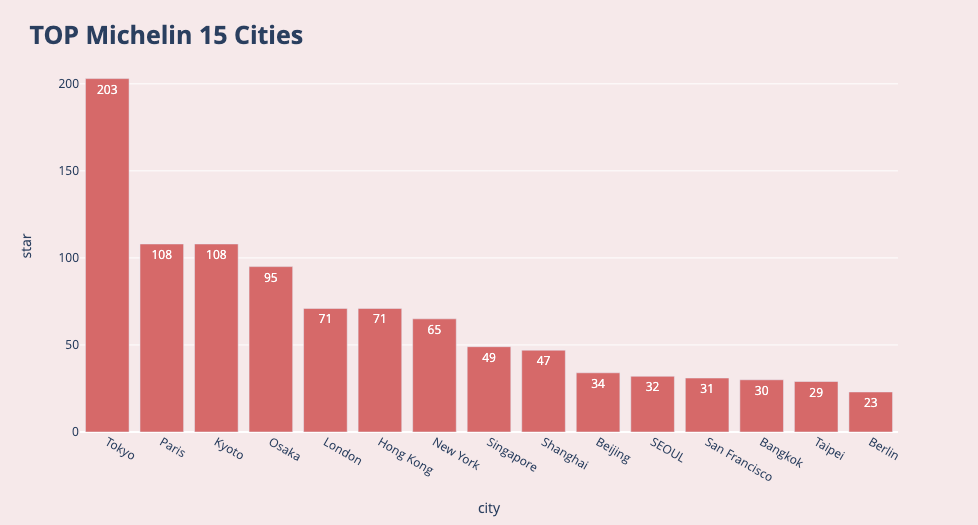
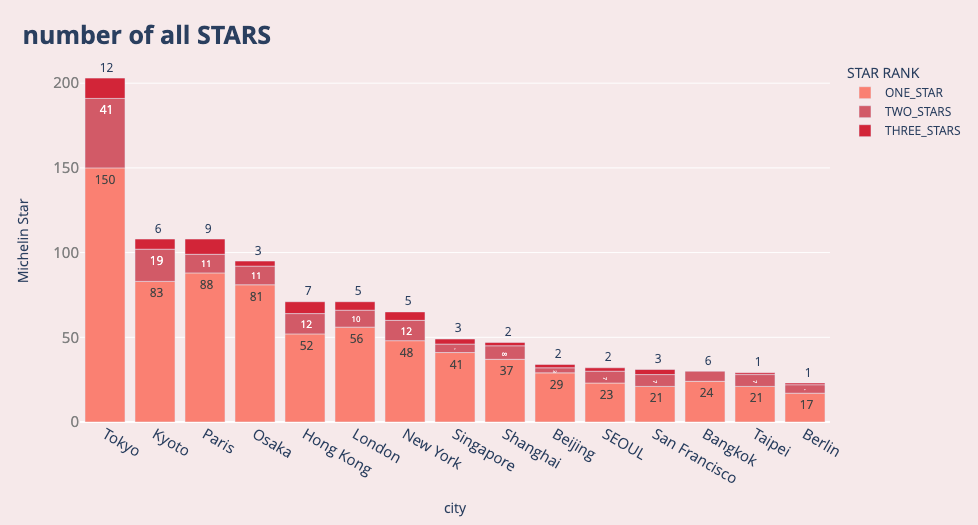
There are many restaurants in Tokyo, It’s about twice as many as in Paris and Kyoto. And 1st city is Tokyo, 2nd cities are Paris and Kyoto, and the 3rd one is Osaka.
3 Japanese cities are Top. I’ve heard There are many restaurants ha the stars, but I didn’t know that.
Cities with the Best Work-Life Balance
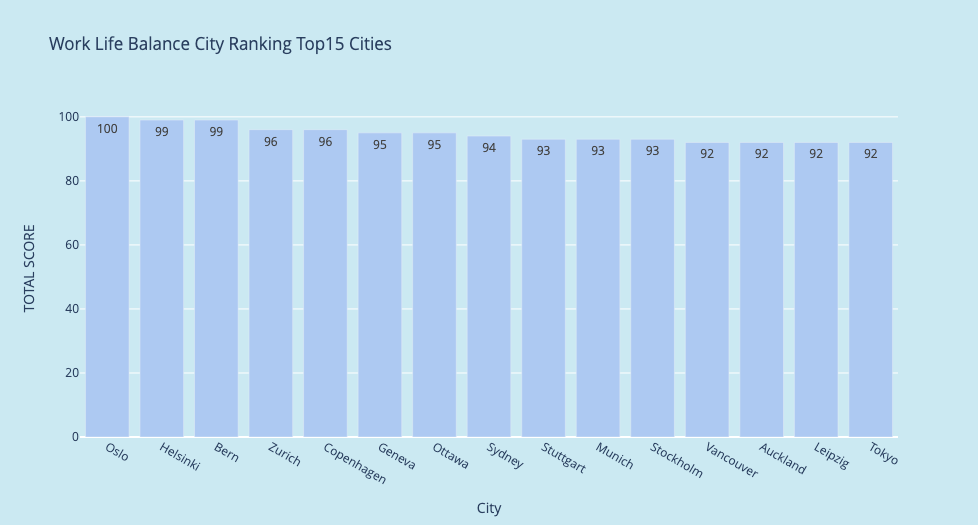
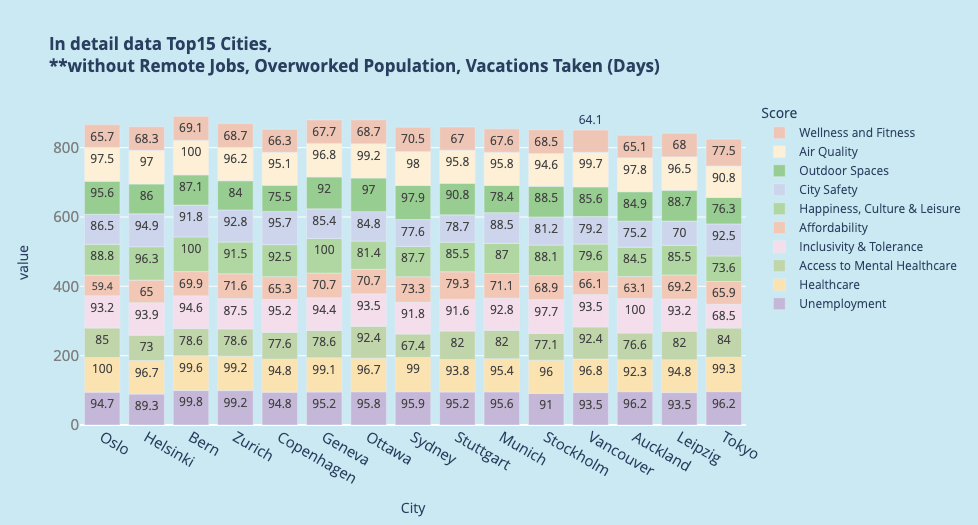
Oslo is the No1 city for good balance. And the next Helsinki, Bern, Zurich, Copenhagen, and Geneva.
North European cities and cities in Switzerland are good for humans.
Merge 2 data.
And the last, I merged two datasets by city names.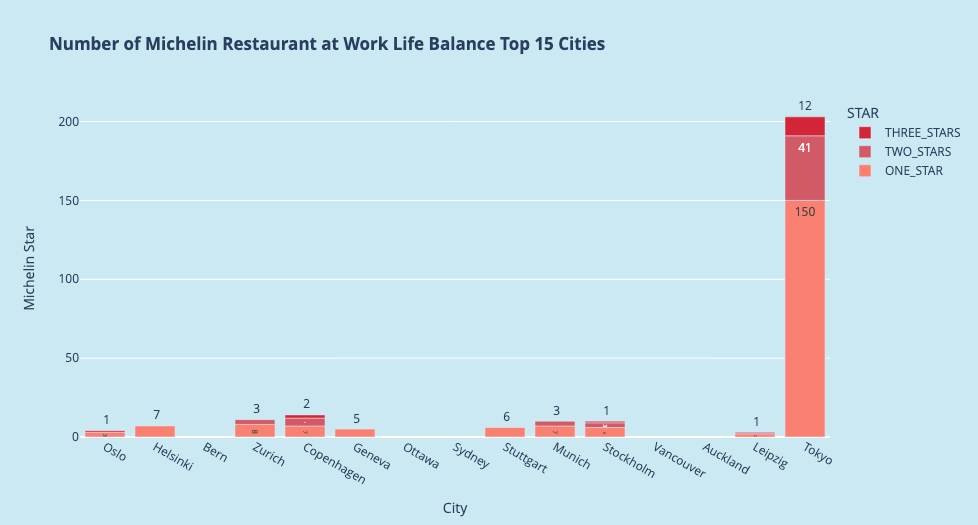
From the graph, It doesn’t matter Michelin Guide Restaurants and Work-Life Balance.
Some cities don’t have Michelin-starred restaurants, and some cities do.
Tokyo has an unusually large number of shops
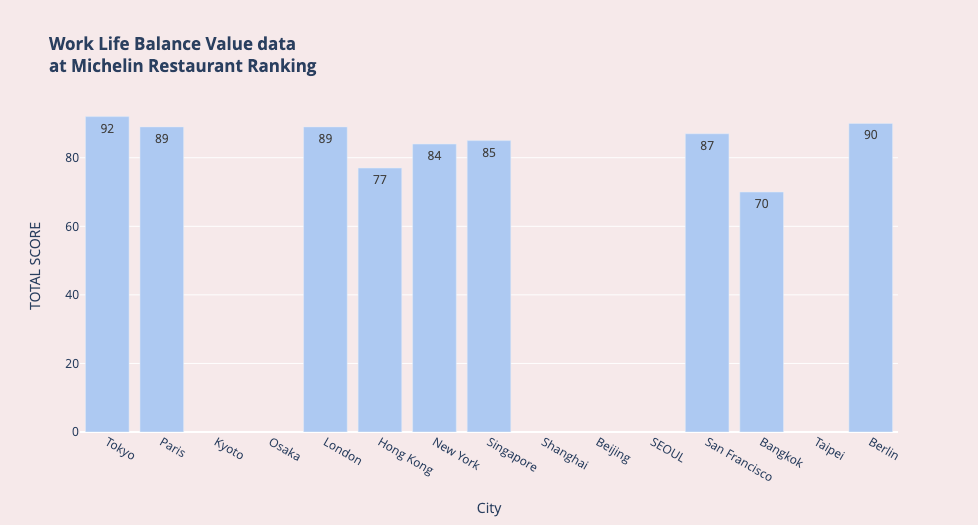
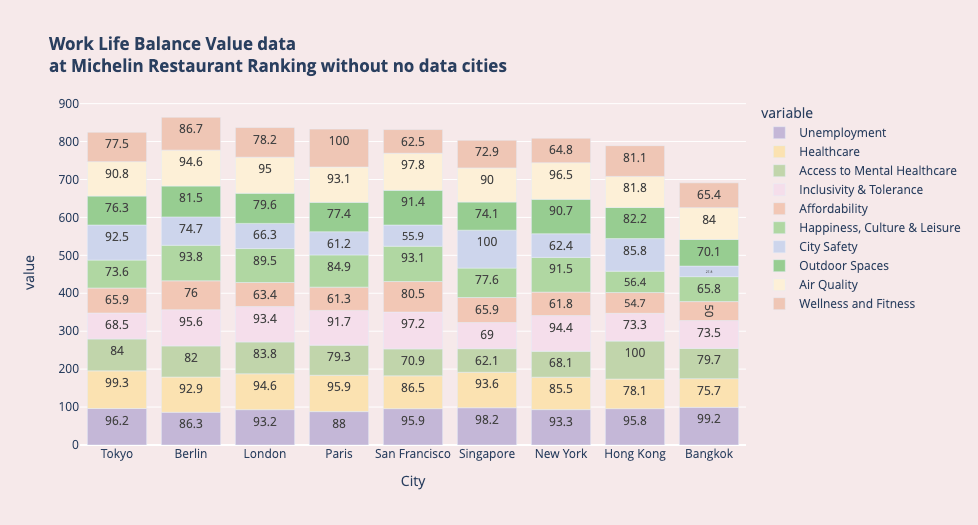
I make this graph the total work-life balance score on Michlin Top15.
From these data, I know that good work-life balance cities do not necessarily have many good (Michelin star) restaurants.
From this submission, I understand how to make a bar graph by plotly from Python, and how much Japanese like eating.
Extra
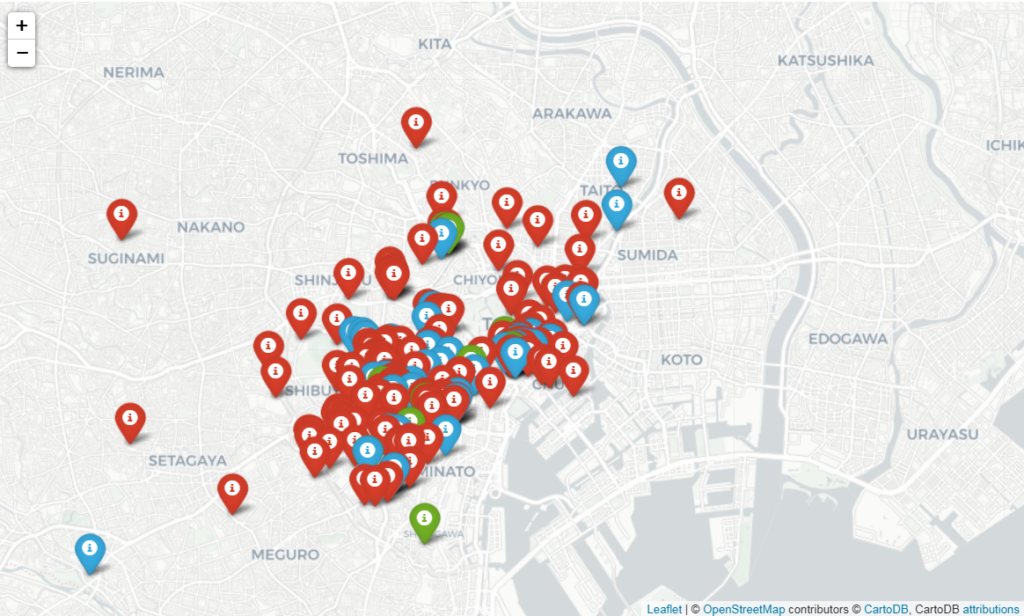
I became hungry!! I created the Michelin Guide Restaurants map about the Top 3, Tokyo, Paris, and Kyoto.
Tokyo
Paris

Kyoto


