Abstract
Architecture enthusiasts face a dilemma when planning their travel visits. Either they spend a lot of time and effort researching and planning their routes, or they can rely on mainstream websites and blogs that tend to recommend well-known works, ruling out works with the same architectural interest that have received less media coverage.
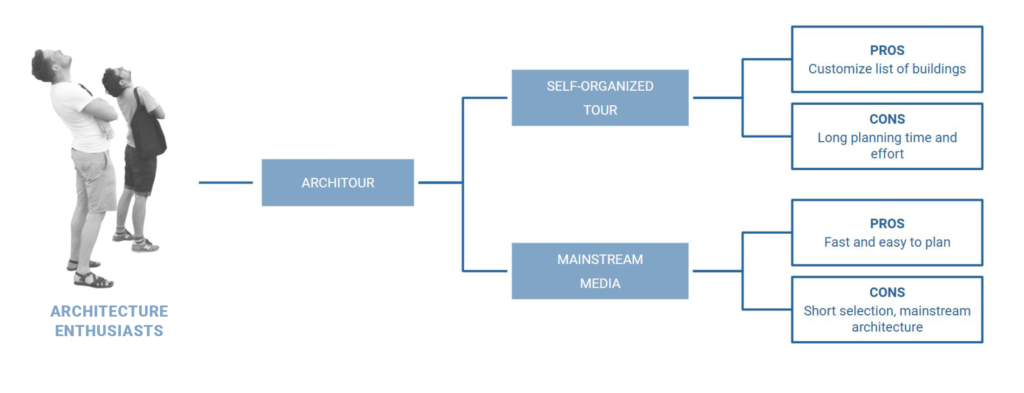
The main objective of this thesis was to investigate new approaches for developing an Advanced Architectural Guide for the city of Barcelona, proposing architectural visit routes customized to user preference without investing substantial time and effort.
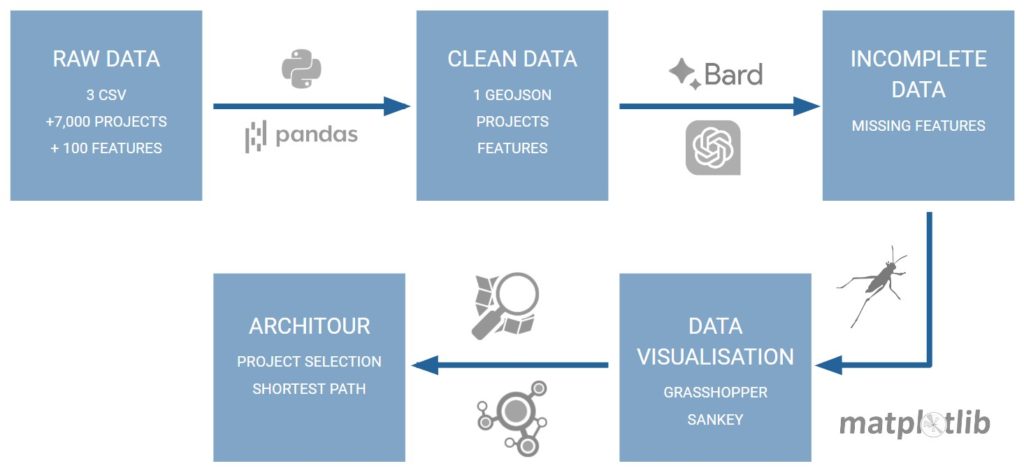
The research was divided into three: The first focused on cleaning and combining the raw data by selecting the relevant data features and simplifying it; the second part explored the potential of using the Chat GPT API in Python to automate the process of generating new and missing data. The final section explored methods for curating a list of recommended buildings to visit and how to calculate the most optimal route connecting all the selected projects.
Data Cleaning
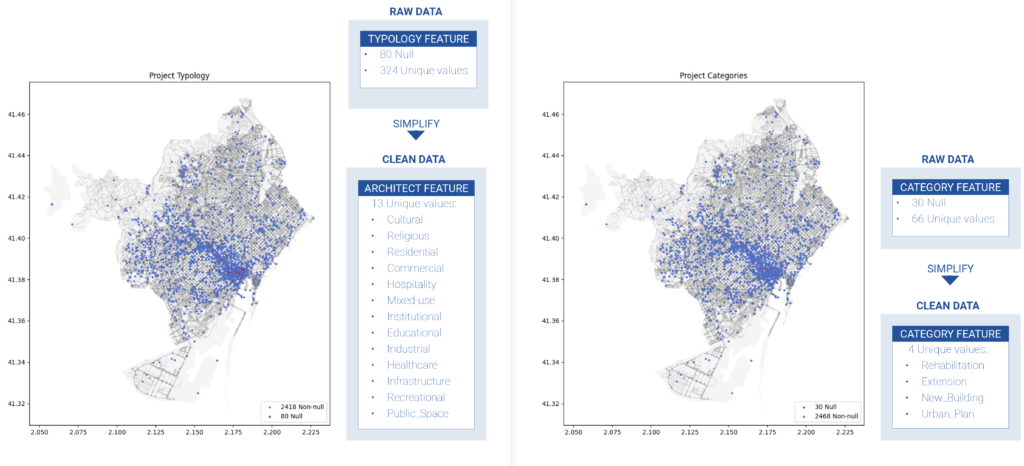
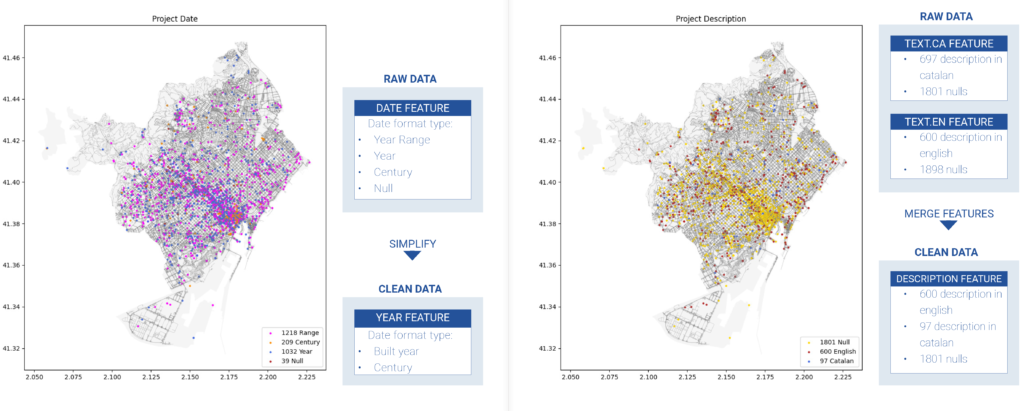
The data source used to develop the architectural guide consisted of three large datasets spanning thousands of rows and features, representing a wide range of information for each architectural work archived. The initial step in the data cleaning process is merging the dataset and selecting the relevant features for the research. Then, clean and simplify all the feature information and examine the null cells to complete after.
Data Generation
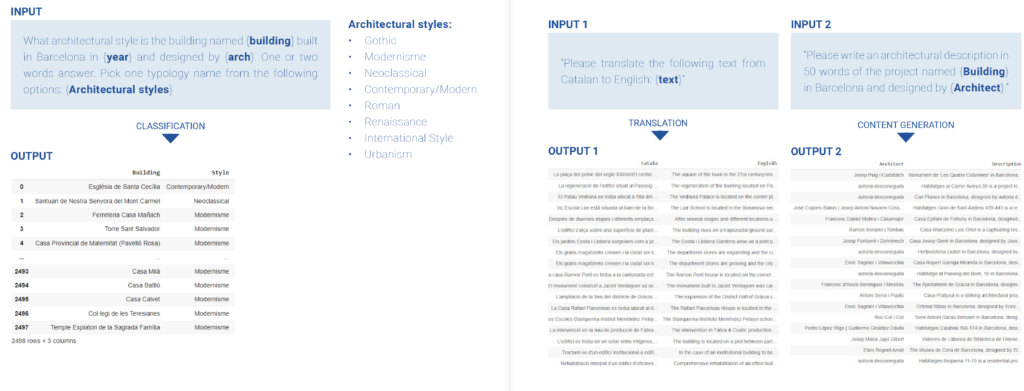
I utilized the Chat GPT API in Python to automate the data completion process and store the response in a data frame, avoiding the tedious task of individually inputting requests on Chat GPT. The goal was to analyze the outputs and determine The goal was to examine the output’s accuracy depending on the types of requests, such as seeking specific information, filling in the missing categorical data from a provided list, translating text, creating a new feature, and creating a building description based on the related information given by the other features.
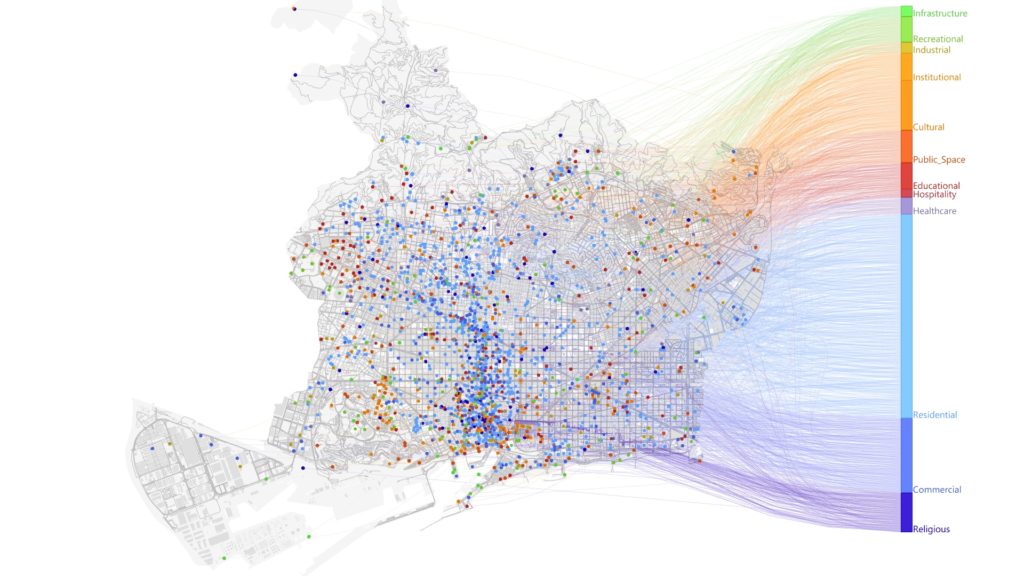
Data Visualisation
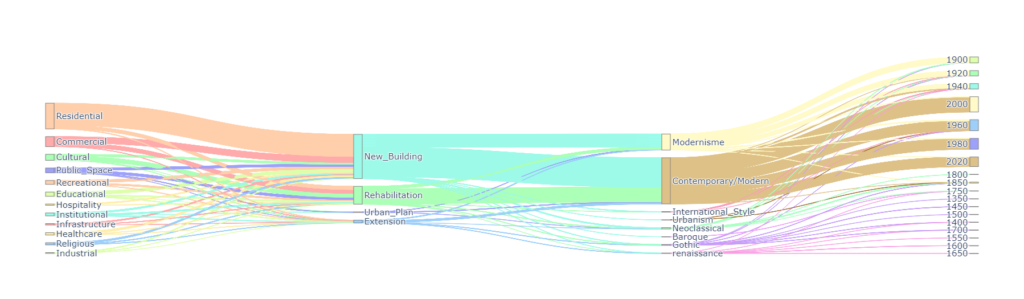
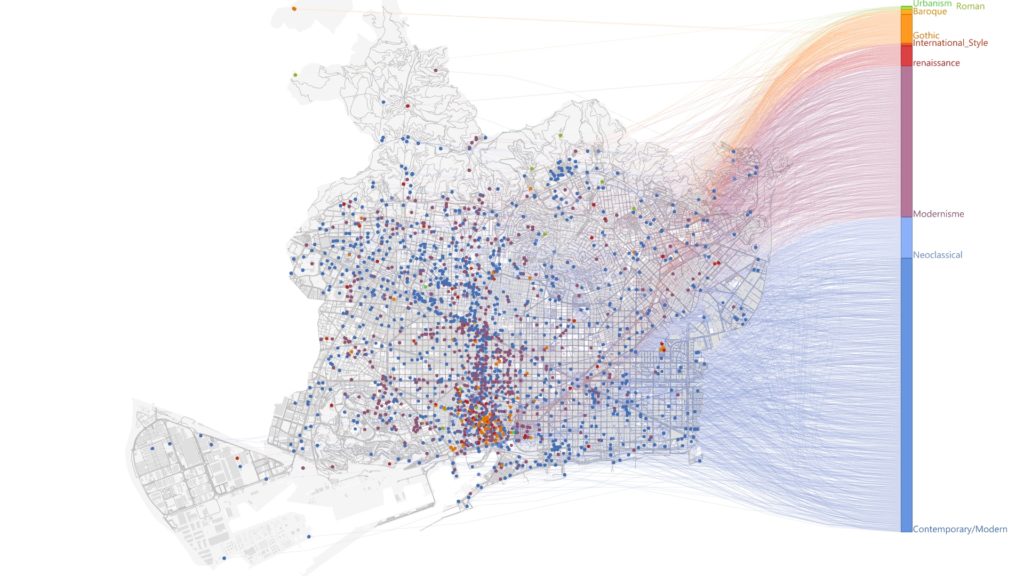
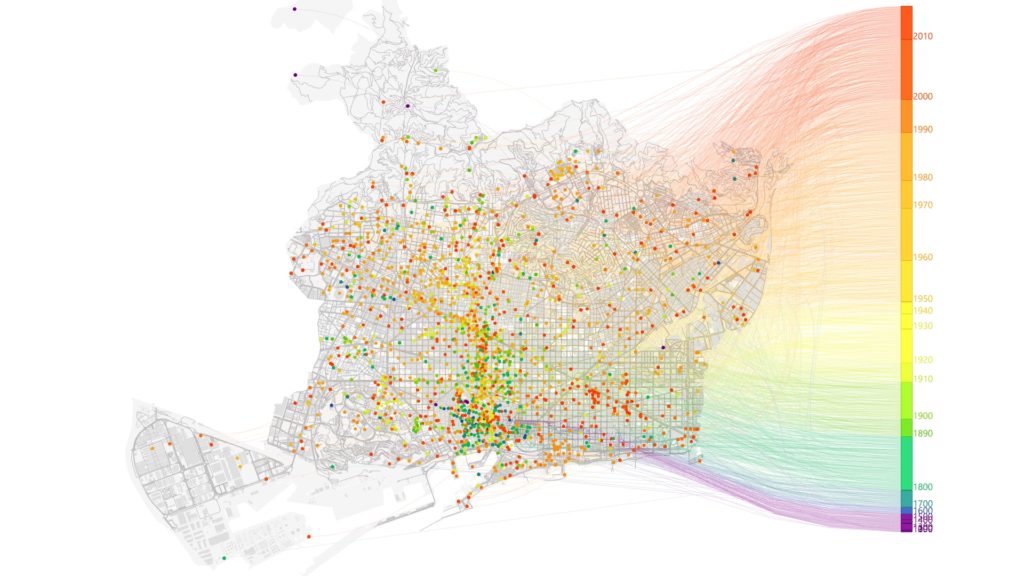
After finalizing the dataset, I visualized the results in a Sankey diagram, which is particularly effective for visualizing the connections between different features. I also created my data representation in Grasshopper to map each feature individually on the Barcelona map. The intent of presenting the data in this manner is to understand better how each feature type interacts and relates to different parts of the city.
Architour
This section is divided into two phases: project selection and route determination. The initial phase dives into two methods to select the list of projects from the extensive dataset of 2,500 architectural works that align with the user’s architectural preferences. The second phase explores finding the most optimal tour route by examining two methodologies to solve the Traveling Salesman Problem (TSP). A classic optimization problem where a salesman has to visit a predetermined number of cities, passing through each city only once while minimizing the total distance traveled.
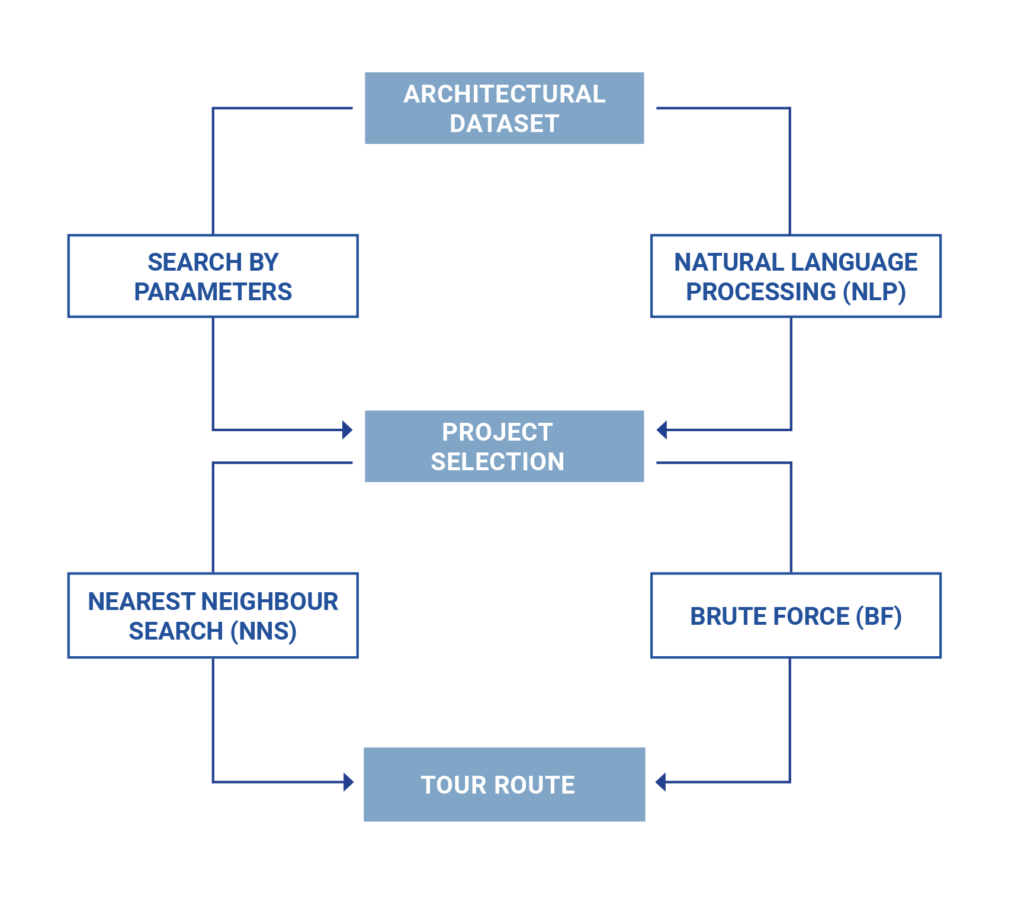
Project Selection
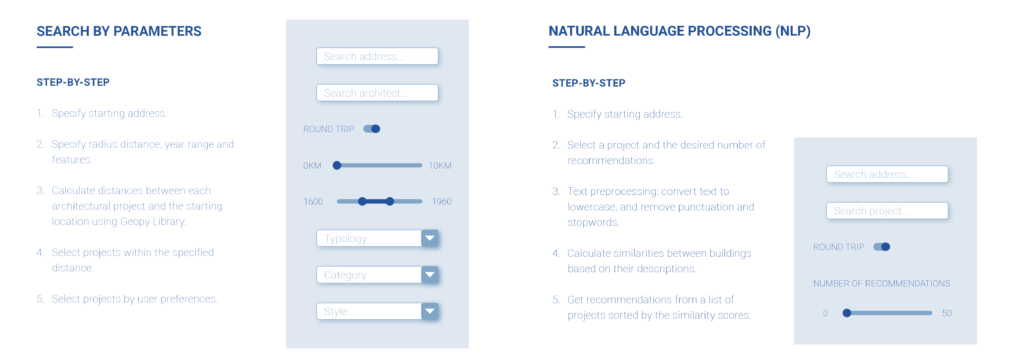
Search by Parameters: Users define their preferences from a predefined set of parameters.
Natural Language Processing (NLP): A field of artificial intelligence focusing on the interaction between computers and human language. Users specify a building name and indicate the number of recommendations they want. Subsequently, the code generates a list of architectural works based on the similarities of their descriptions.
Tour Route
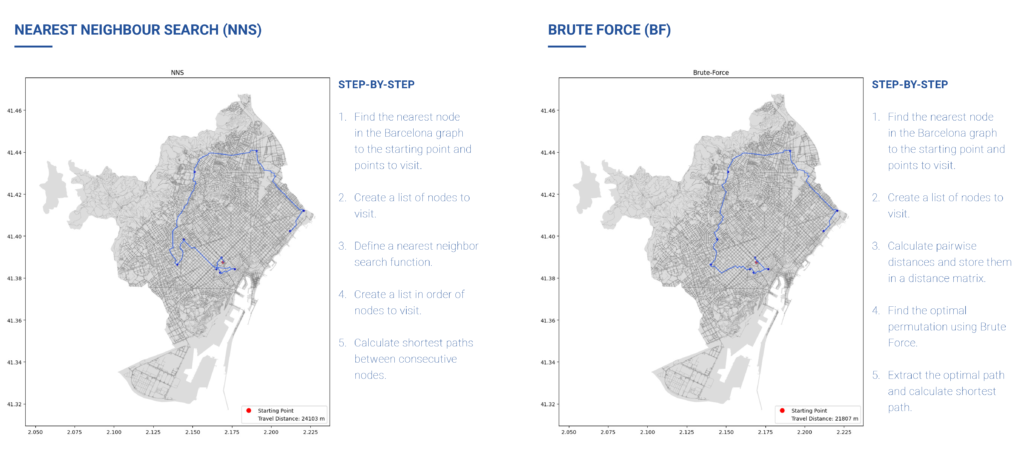
Nearest Neighbour Search: It is a heuristic solution to the problem. It is relatively straightforward to implement due to its speed and not requiring checking all possible solutions. However, it has its disadvantages. It doesn’t guarantee the shortest route because it chooses the nearest node at each step.
Brute Force: A method that always finds the best solution as it explores all possibilities and is straightforward to understand and implement, especially for problems with fewer nodes. The disadvantage is that it is computationally expensive and can be very slow, especially when the number of nodes is vast.
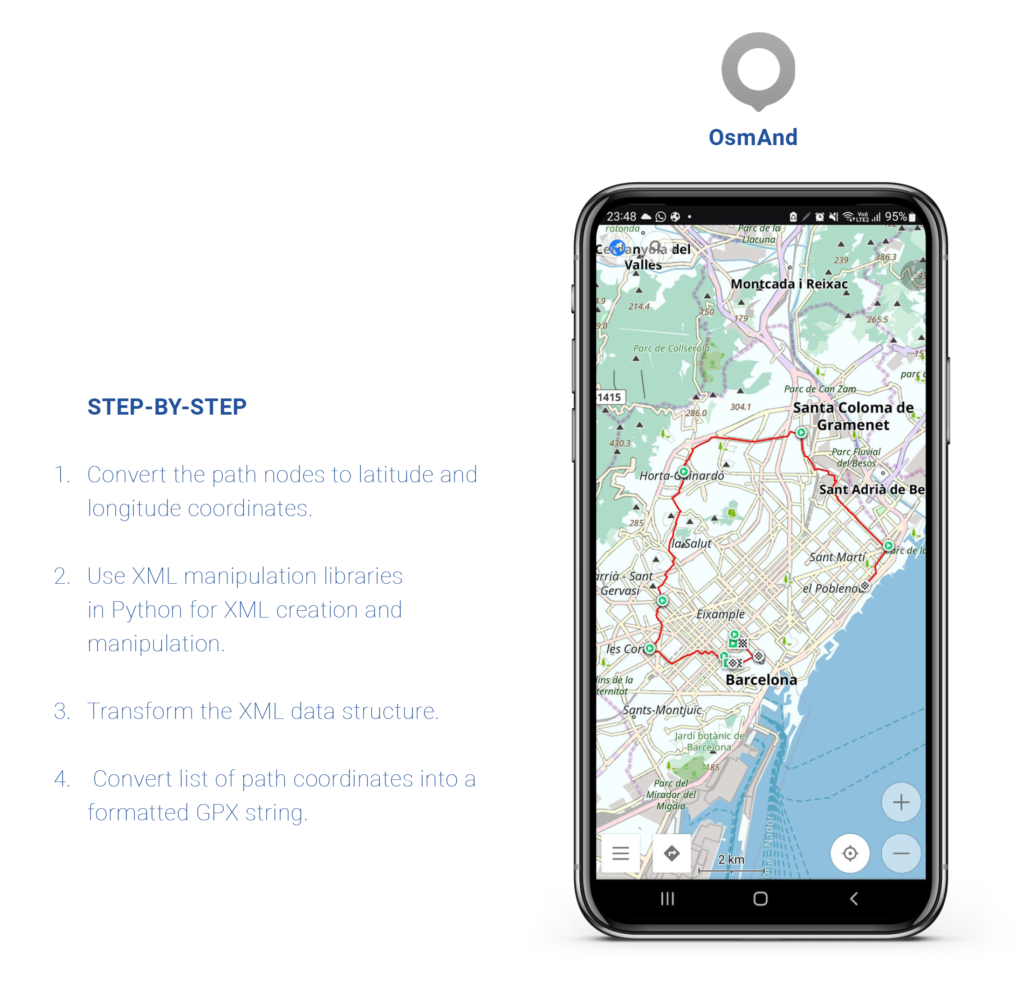
Path Visualisation
Finally, to map the architectural route calculated before, I had to convert the Geo Nodes from the shortest path to GPX (GPS Exchange Format), an XML file type designed to transfer GPS data between navigation devices and applications. I used a navigation app like uMap or OsmAnd to import and display the route.