The purpose of this blog post is to showcase a selection of exercises conducted during the Advanced Computational Class of the first term of MAEBB. My personal interest was initially focused on the algorithmic logic of Grasshopper and its manifestations in nature (Ex. 01 & Ex. 02). As we progressively explored more complex concepts of the plug-in, such as data management (Ex. 03), attractor points (Ex. 04), and finally, meshes (Ex. 05), my understanding grew deeper, and so did my eagerness to grasp the potential of Grasshopper.
Mushroom mini-lamps
Ex.01
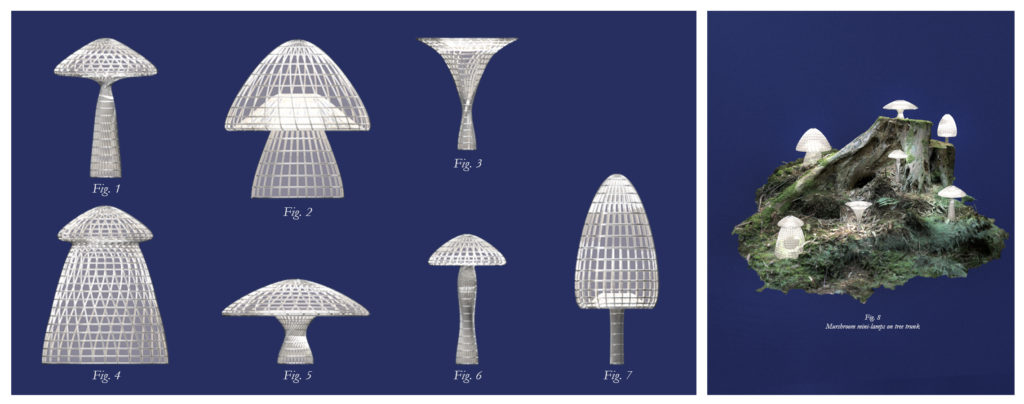
The objective was to craft seven exquisite steel wireframe lamps, each meticulously shaped to emulate the enchanting diversity of mushrooms found in nature. The design process was orchestrated through Grasshopper’s parametric capabilities, allowing for manipulation and iteration of the design.
The steel wireframe, serving as the lamps’ structural backbone, was crafted to not only ensure stability but also to capture the essence of mushroom forms – from the delicate gills to the graceful curves of the caps. This intricate framework was brought to life in the virtual realm, enabling us to visualize and refine every detail before fabrication. To enhance the lamps’ allure, the inner surface is introduced with a semi-translucent plastic material. This choice allowed for the diffusion of light, creating a captivating interplay of shadows and illuminations.
The result was a harmonious blend of organic inspiration and modern technology, where the ethereal glow emanating from within the mushroom-shaped lamps captivated the senses.
Grasshopper script

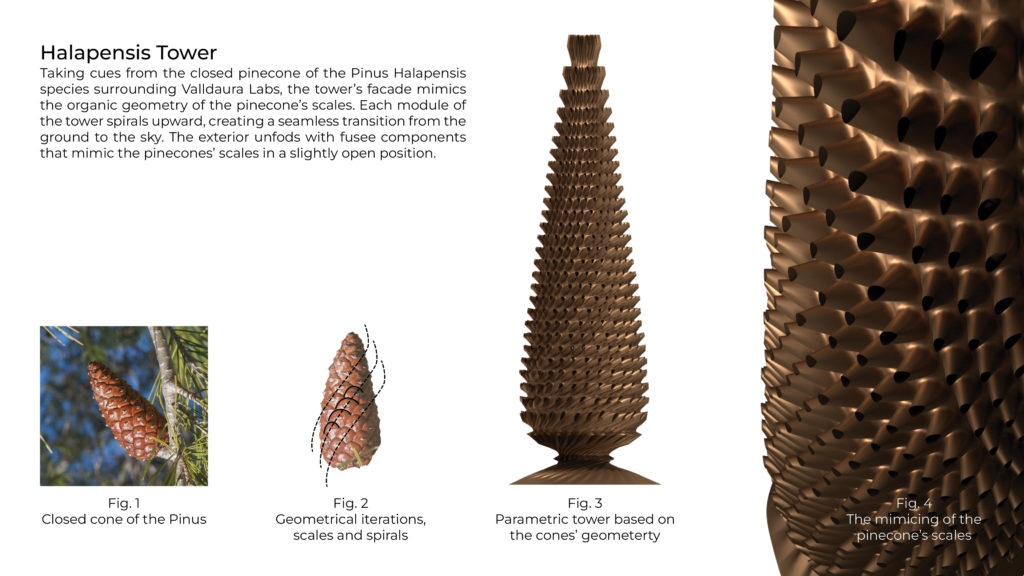
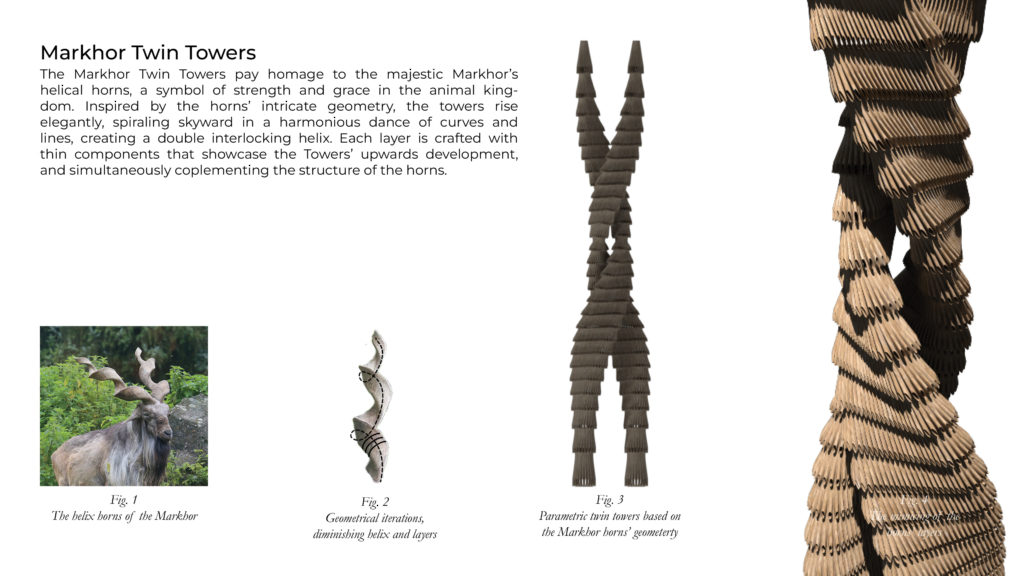
Halepensis & Marhor Towers
Ex.02
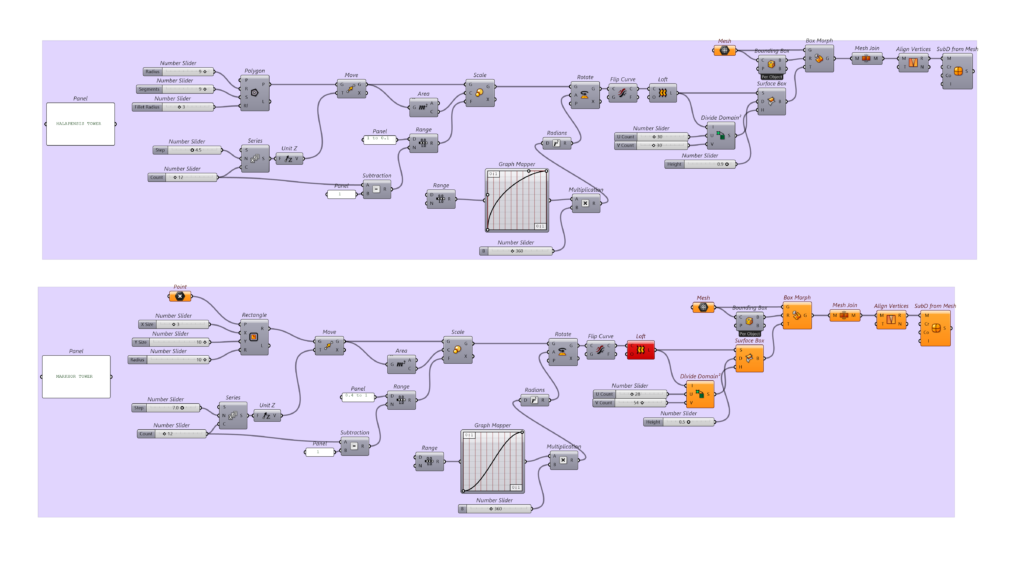
Grasshopper scripts
Panelized Jittered Tower
Ex.03
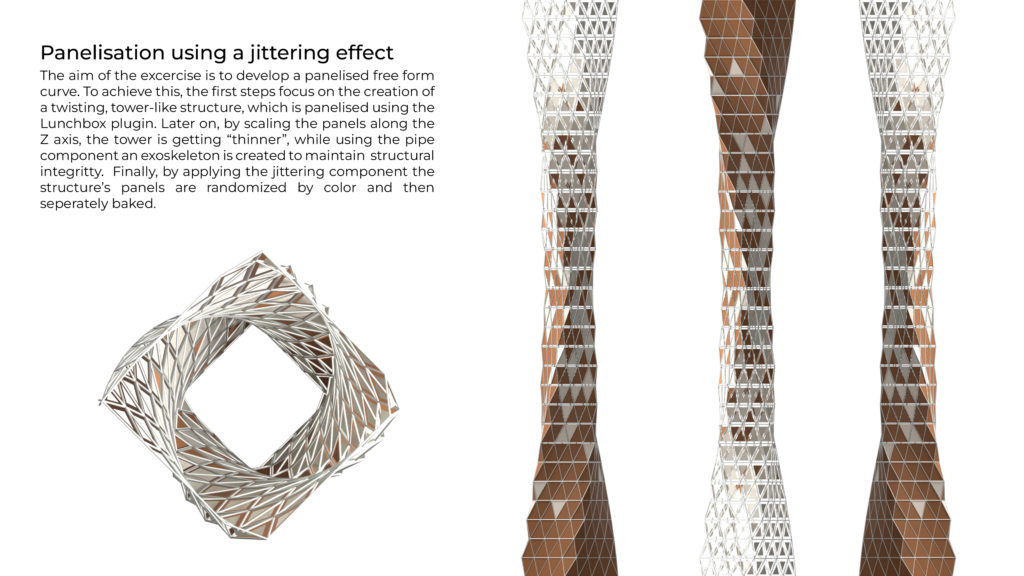
Grasshopper script

Hexagonal Topographies
Ex.04
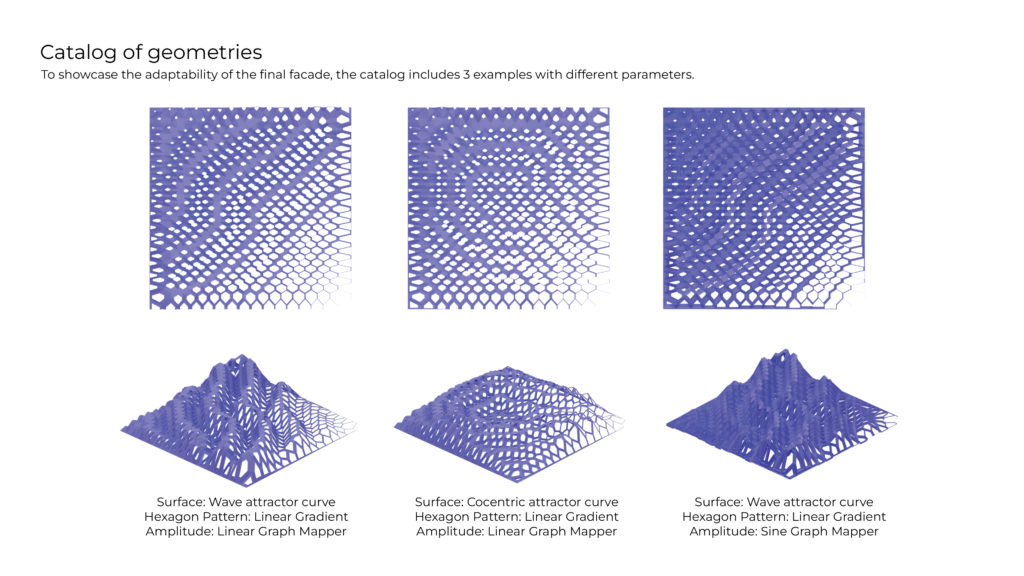
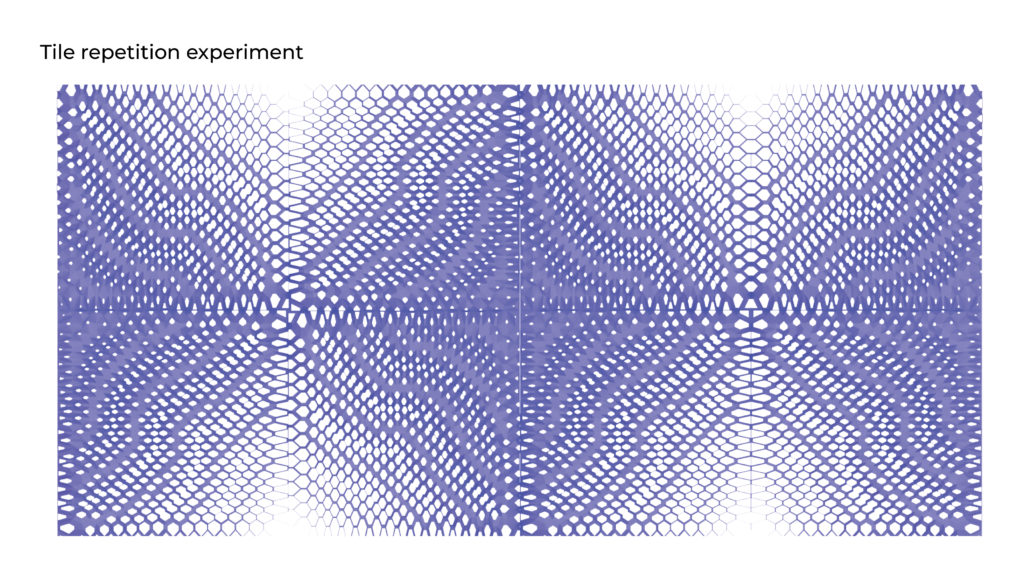
The surfaces produced in this exercise are based on the hexagonal cells and are formed with two attractor curves, one controlling the surfaces’ elevation and the second one controlling the scaling and amplitude of the lofted cells.
Grasshopper script

Mesh Data Visualisation
Ex.05
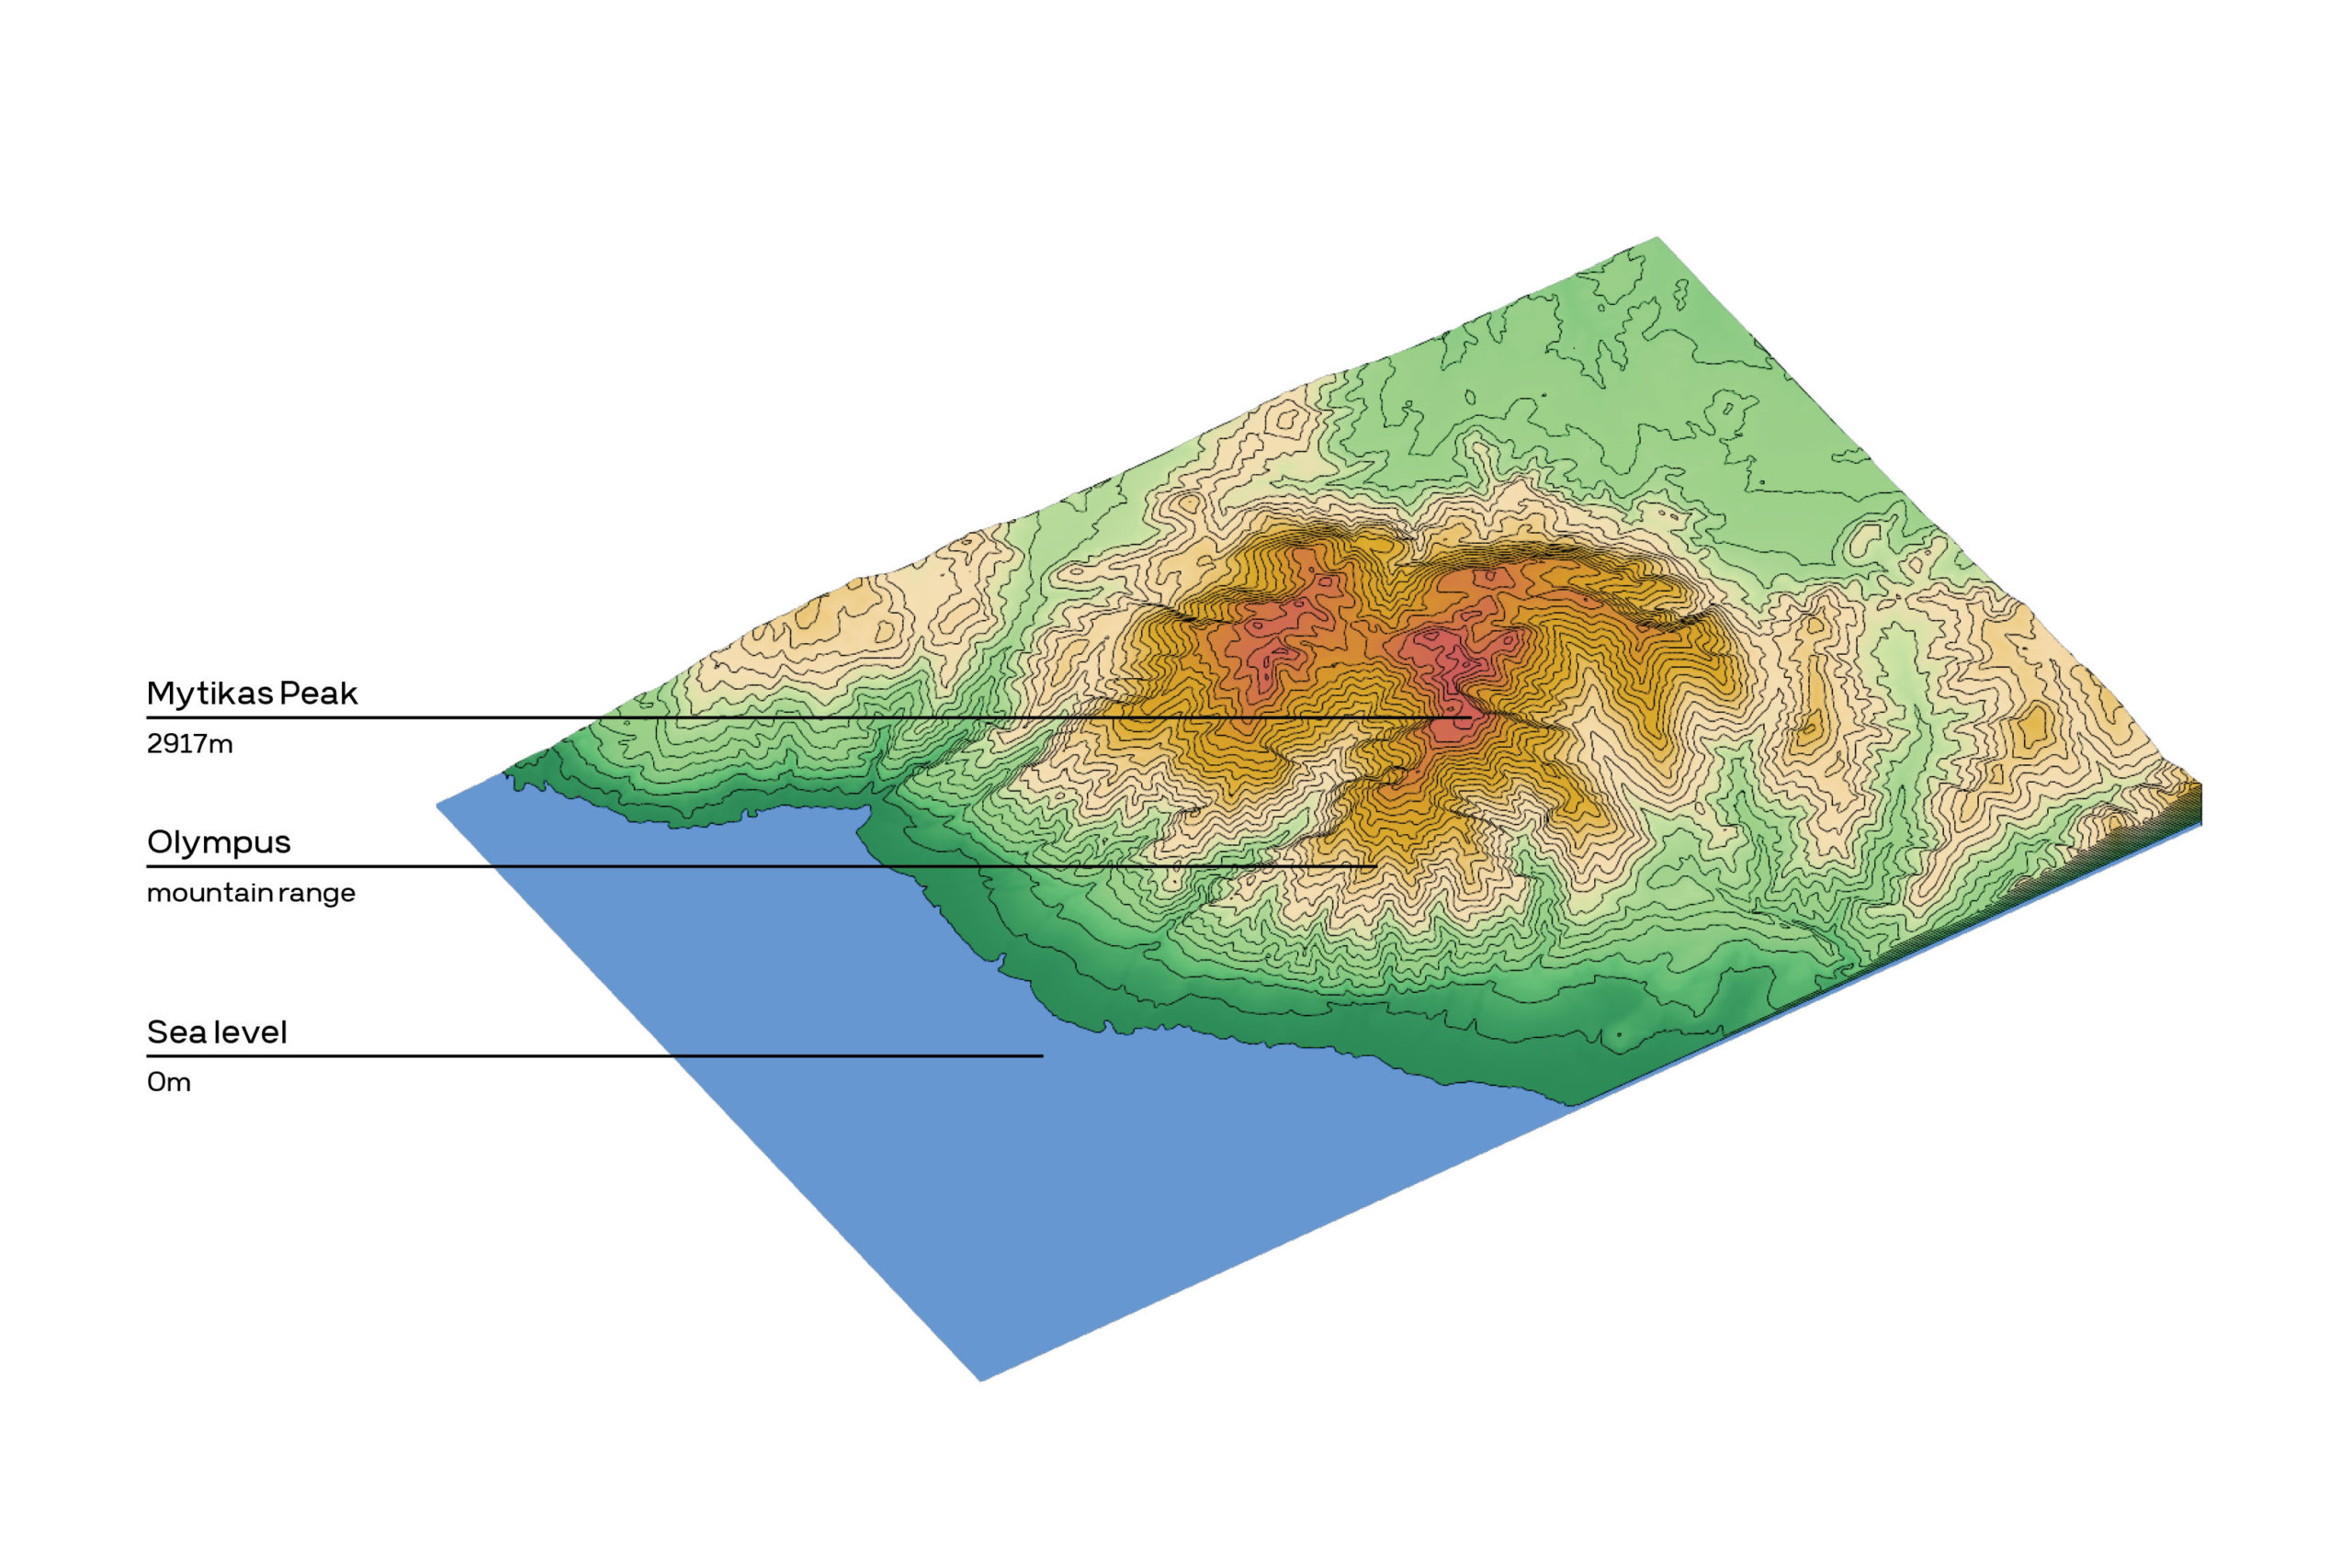
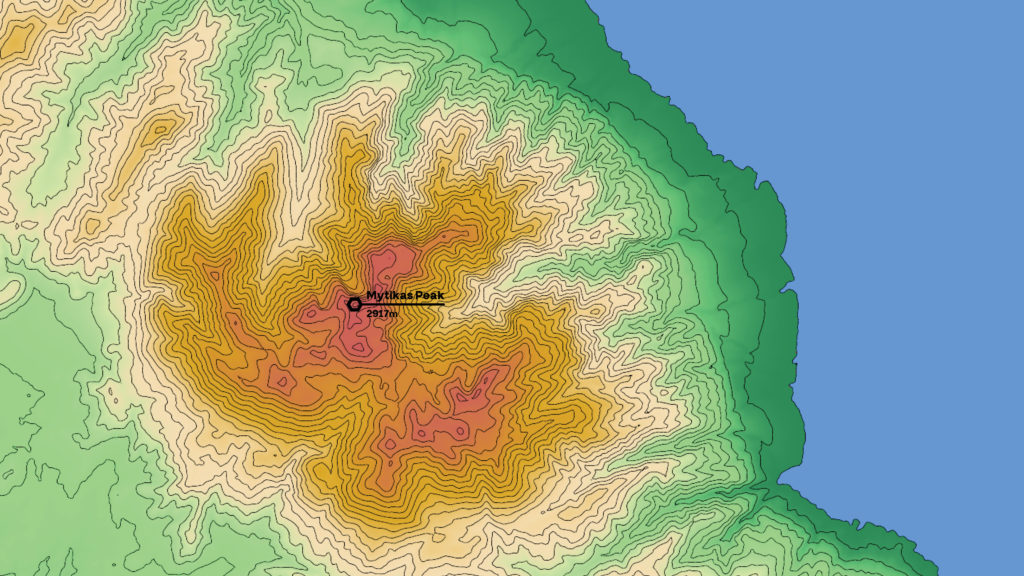
The aim of the exercise is to visualize data on a mesh based on a variable within the model. The mesh used represents the mountain range of Olympus in central Greece and was extracted using the Terrain2STL online tool. After the mesh is imported into Rhino it is split into two meshes (land & sea) and colored according to the altitude.
Grasshopper script


