is a Graph ML Project, to Predict the Potential of agricultural lands according to Soil meniral statistics, River water statistics and waste land types and proximity.
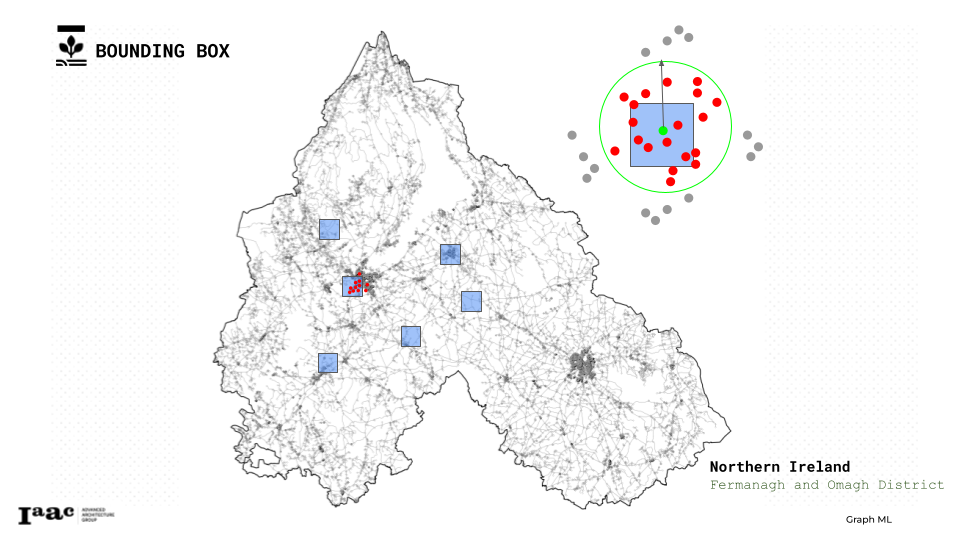
Location: Fermanagh and Omagh, Northern Ireland.
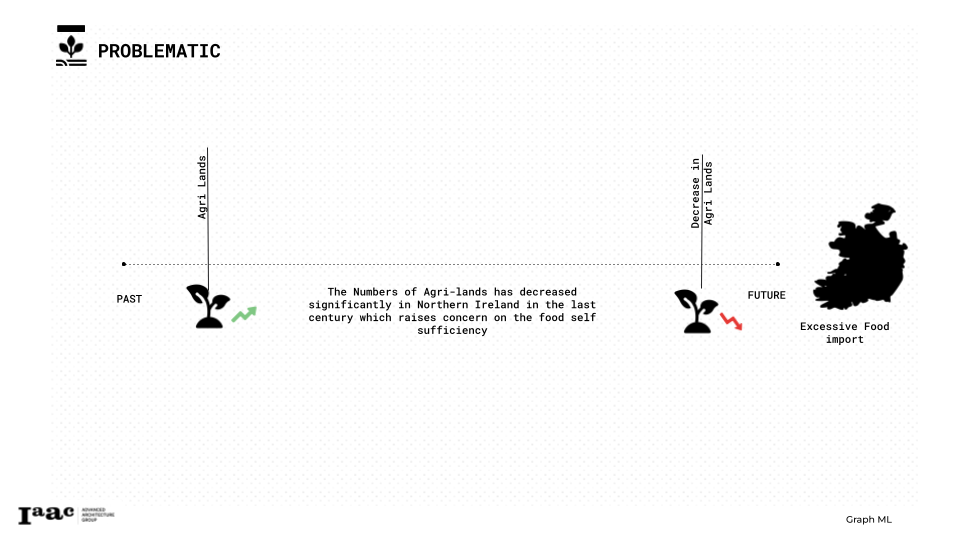
After extensive research on open-source data, we discovered that Ireland provides a wealth of information. We studied the historical land uses we found out that the number of agricultural lands in Northern Ireland is decreasing rapidly, which could put Ireland’s food self-sufficiency at risk.
So we decided to make Ireland Green again by predicting new locations for agriculture lands using graph ML
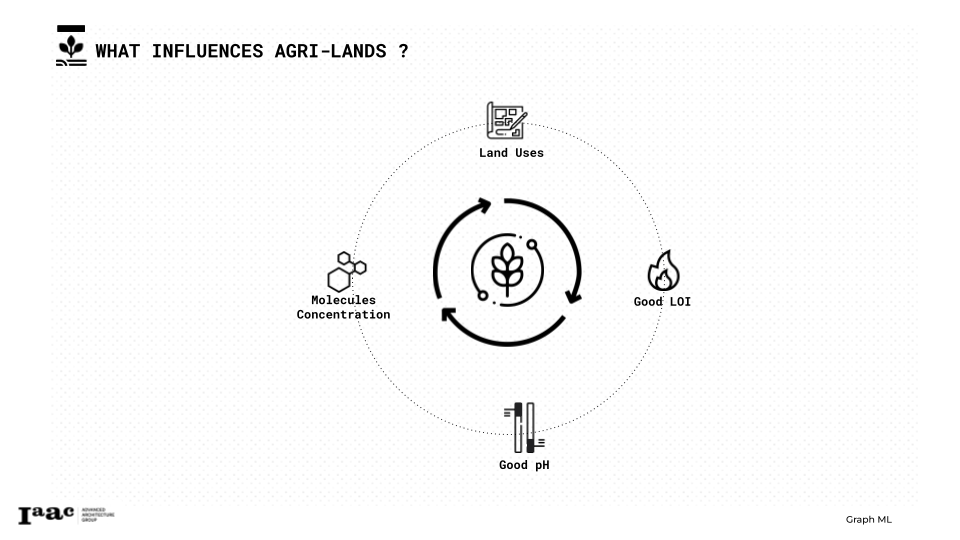
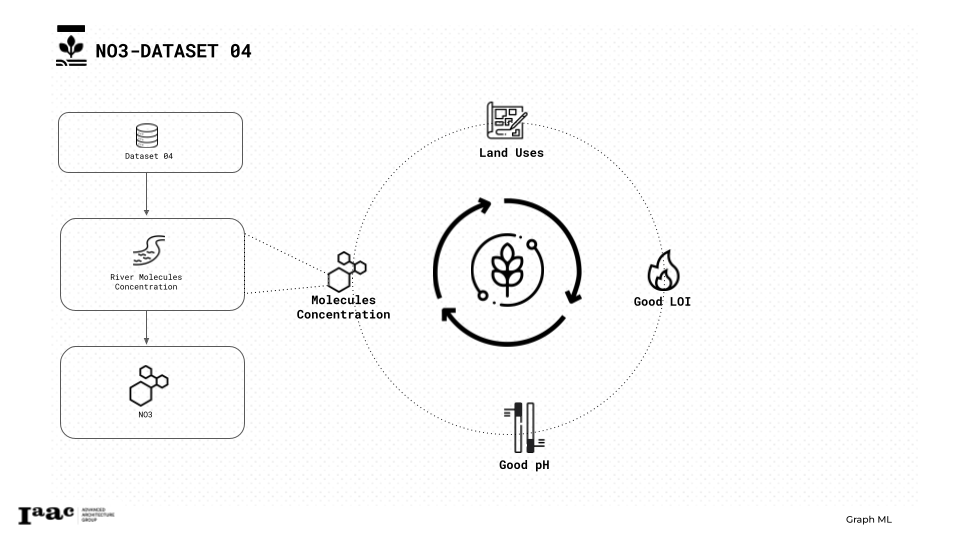
We investigated what influences agriculture and identified key factors: land use, Loss on Ignition (which measures the amount of organic matter in soil), soil acidity, and molecule concentration.
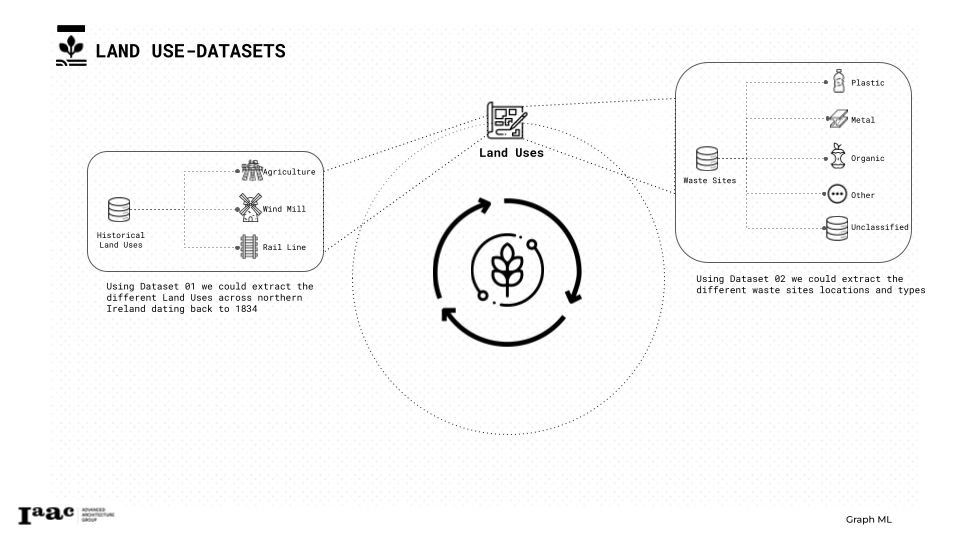
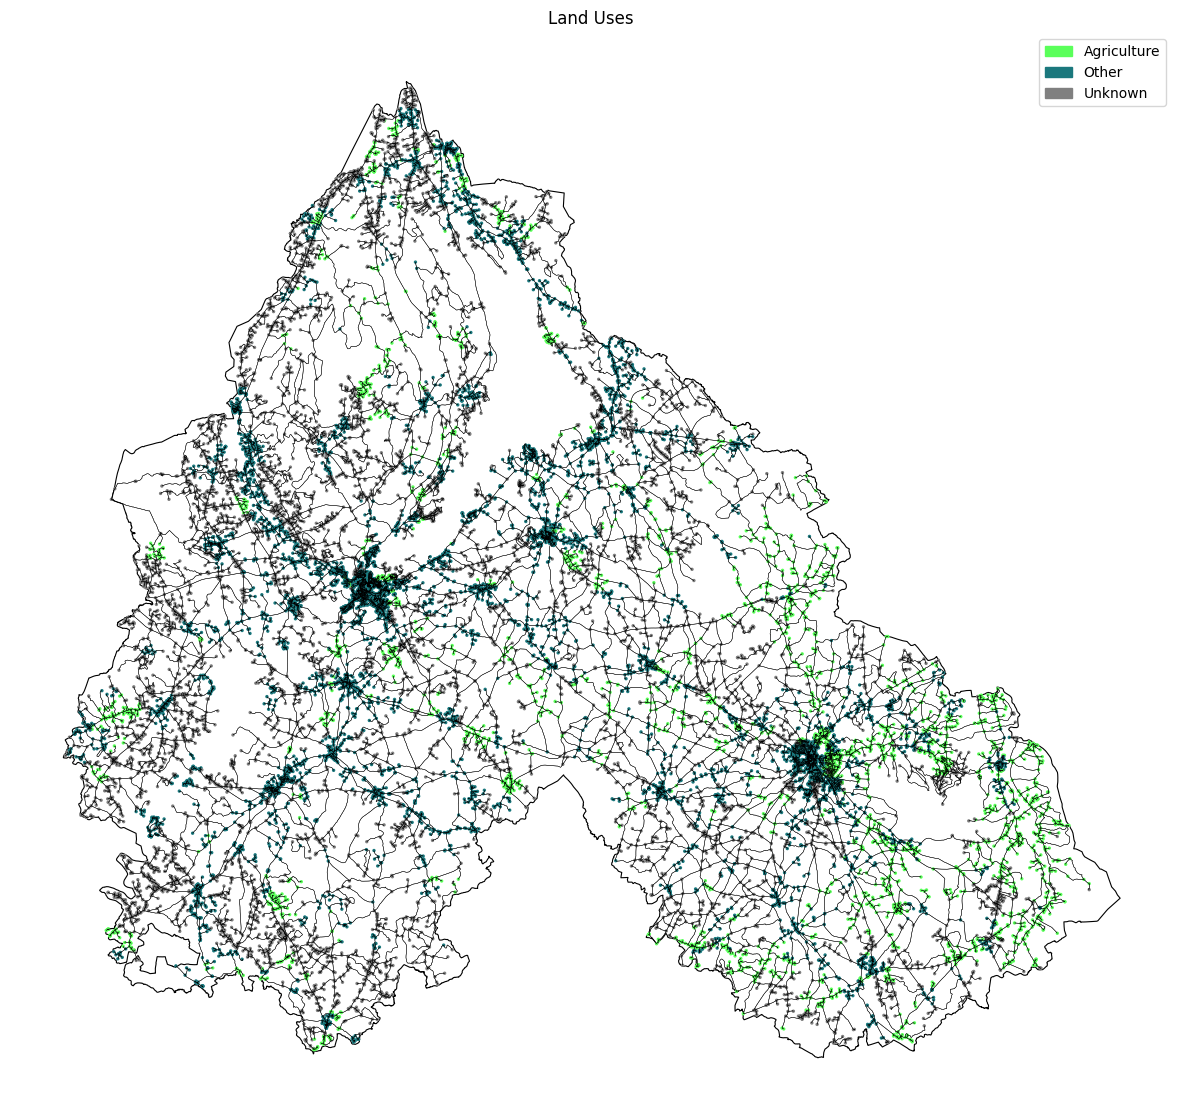
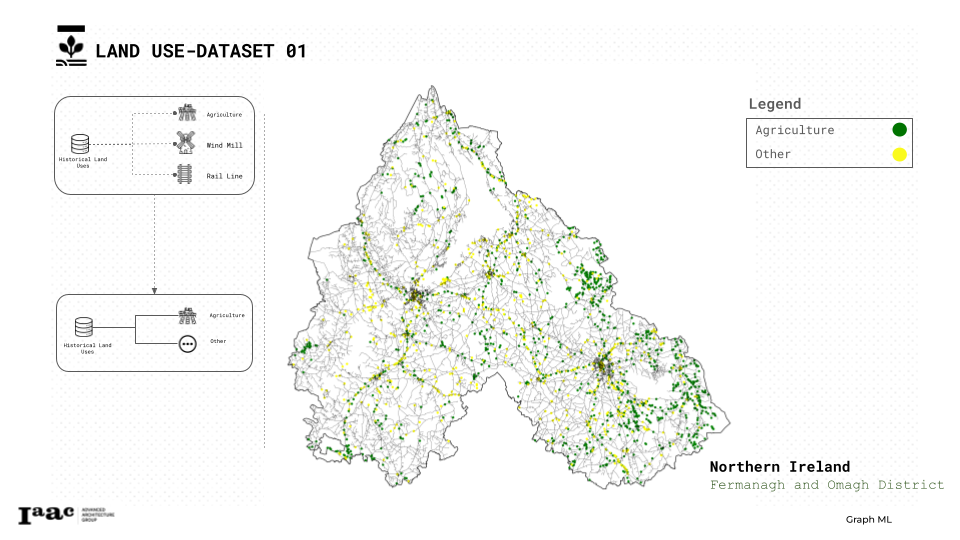
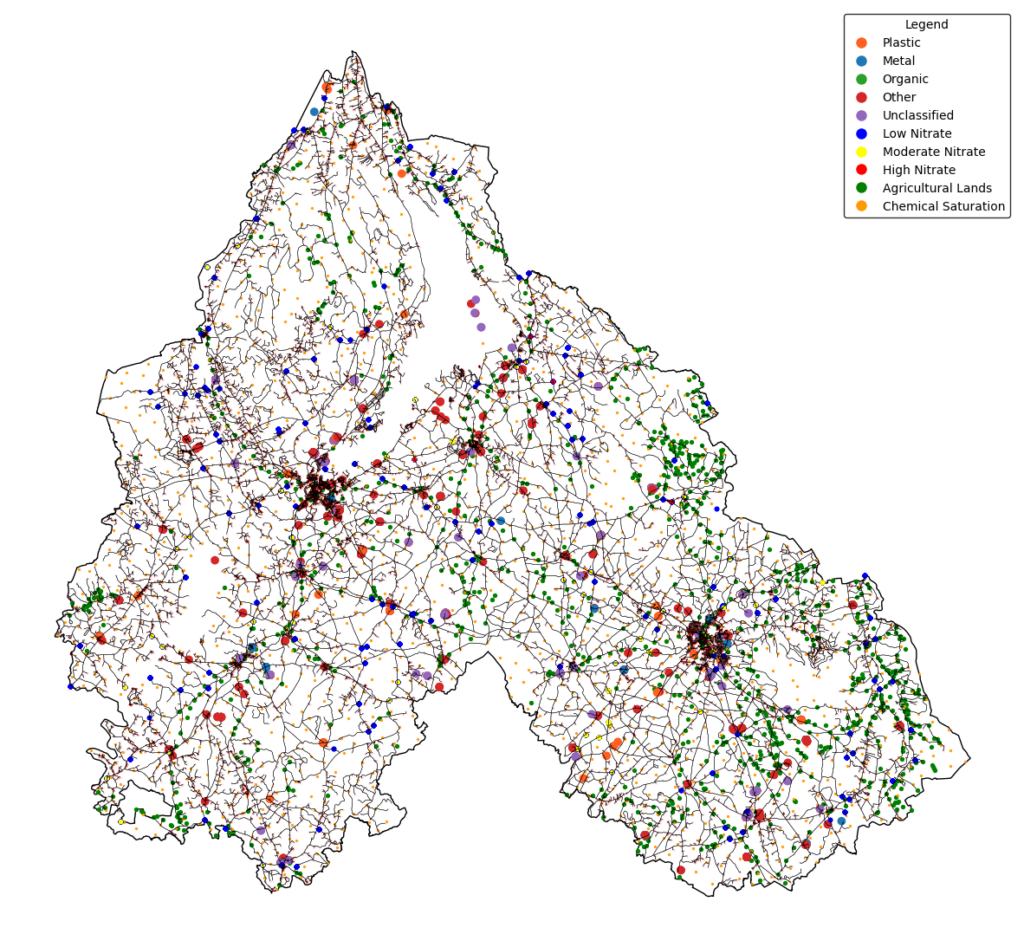
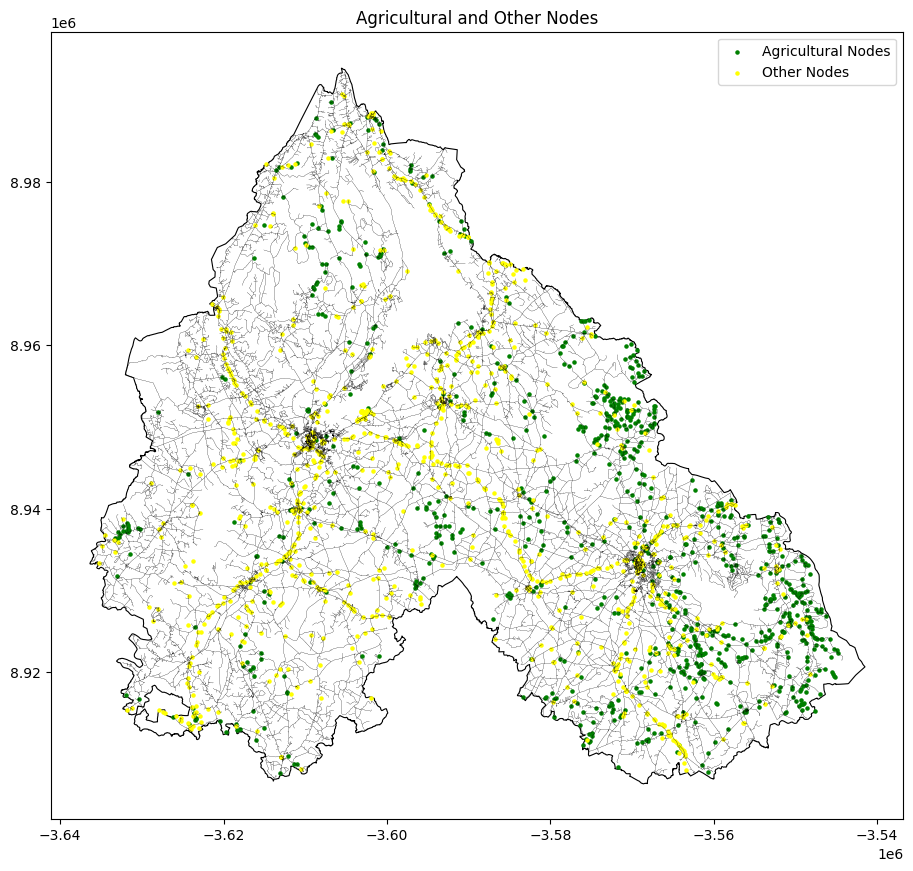
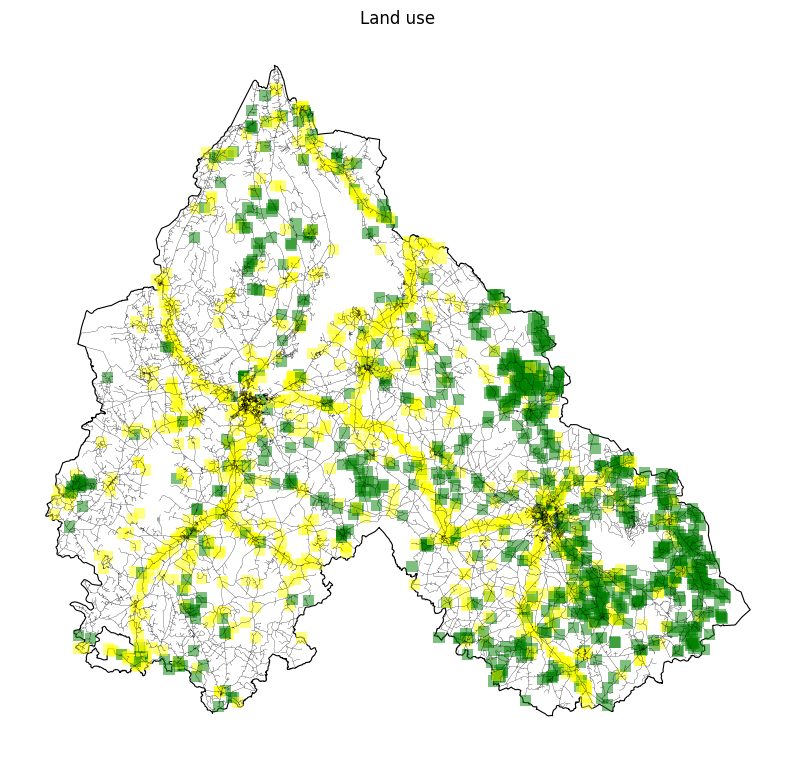
Starting first with the land uses datasets as we can see used two different datasets the first one to extract our agricultural Lands, the second one to classify the waste sites types and locations
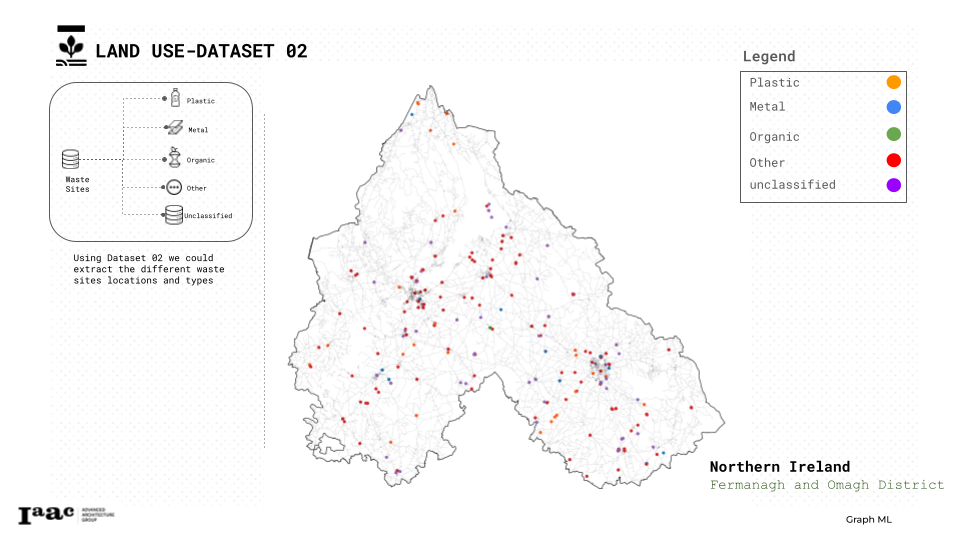
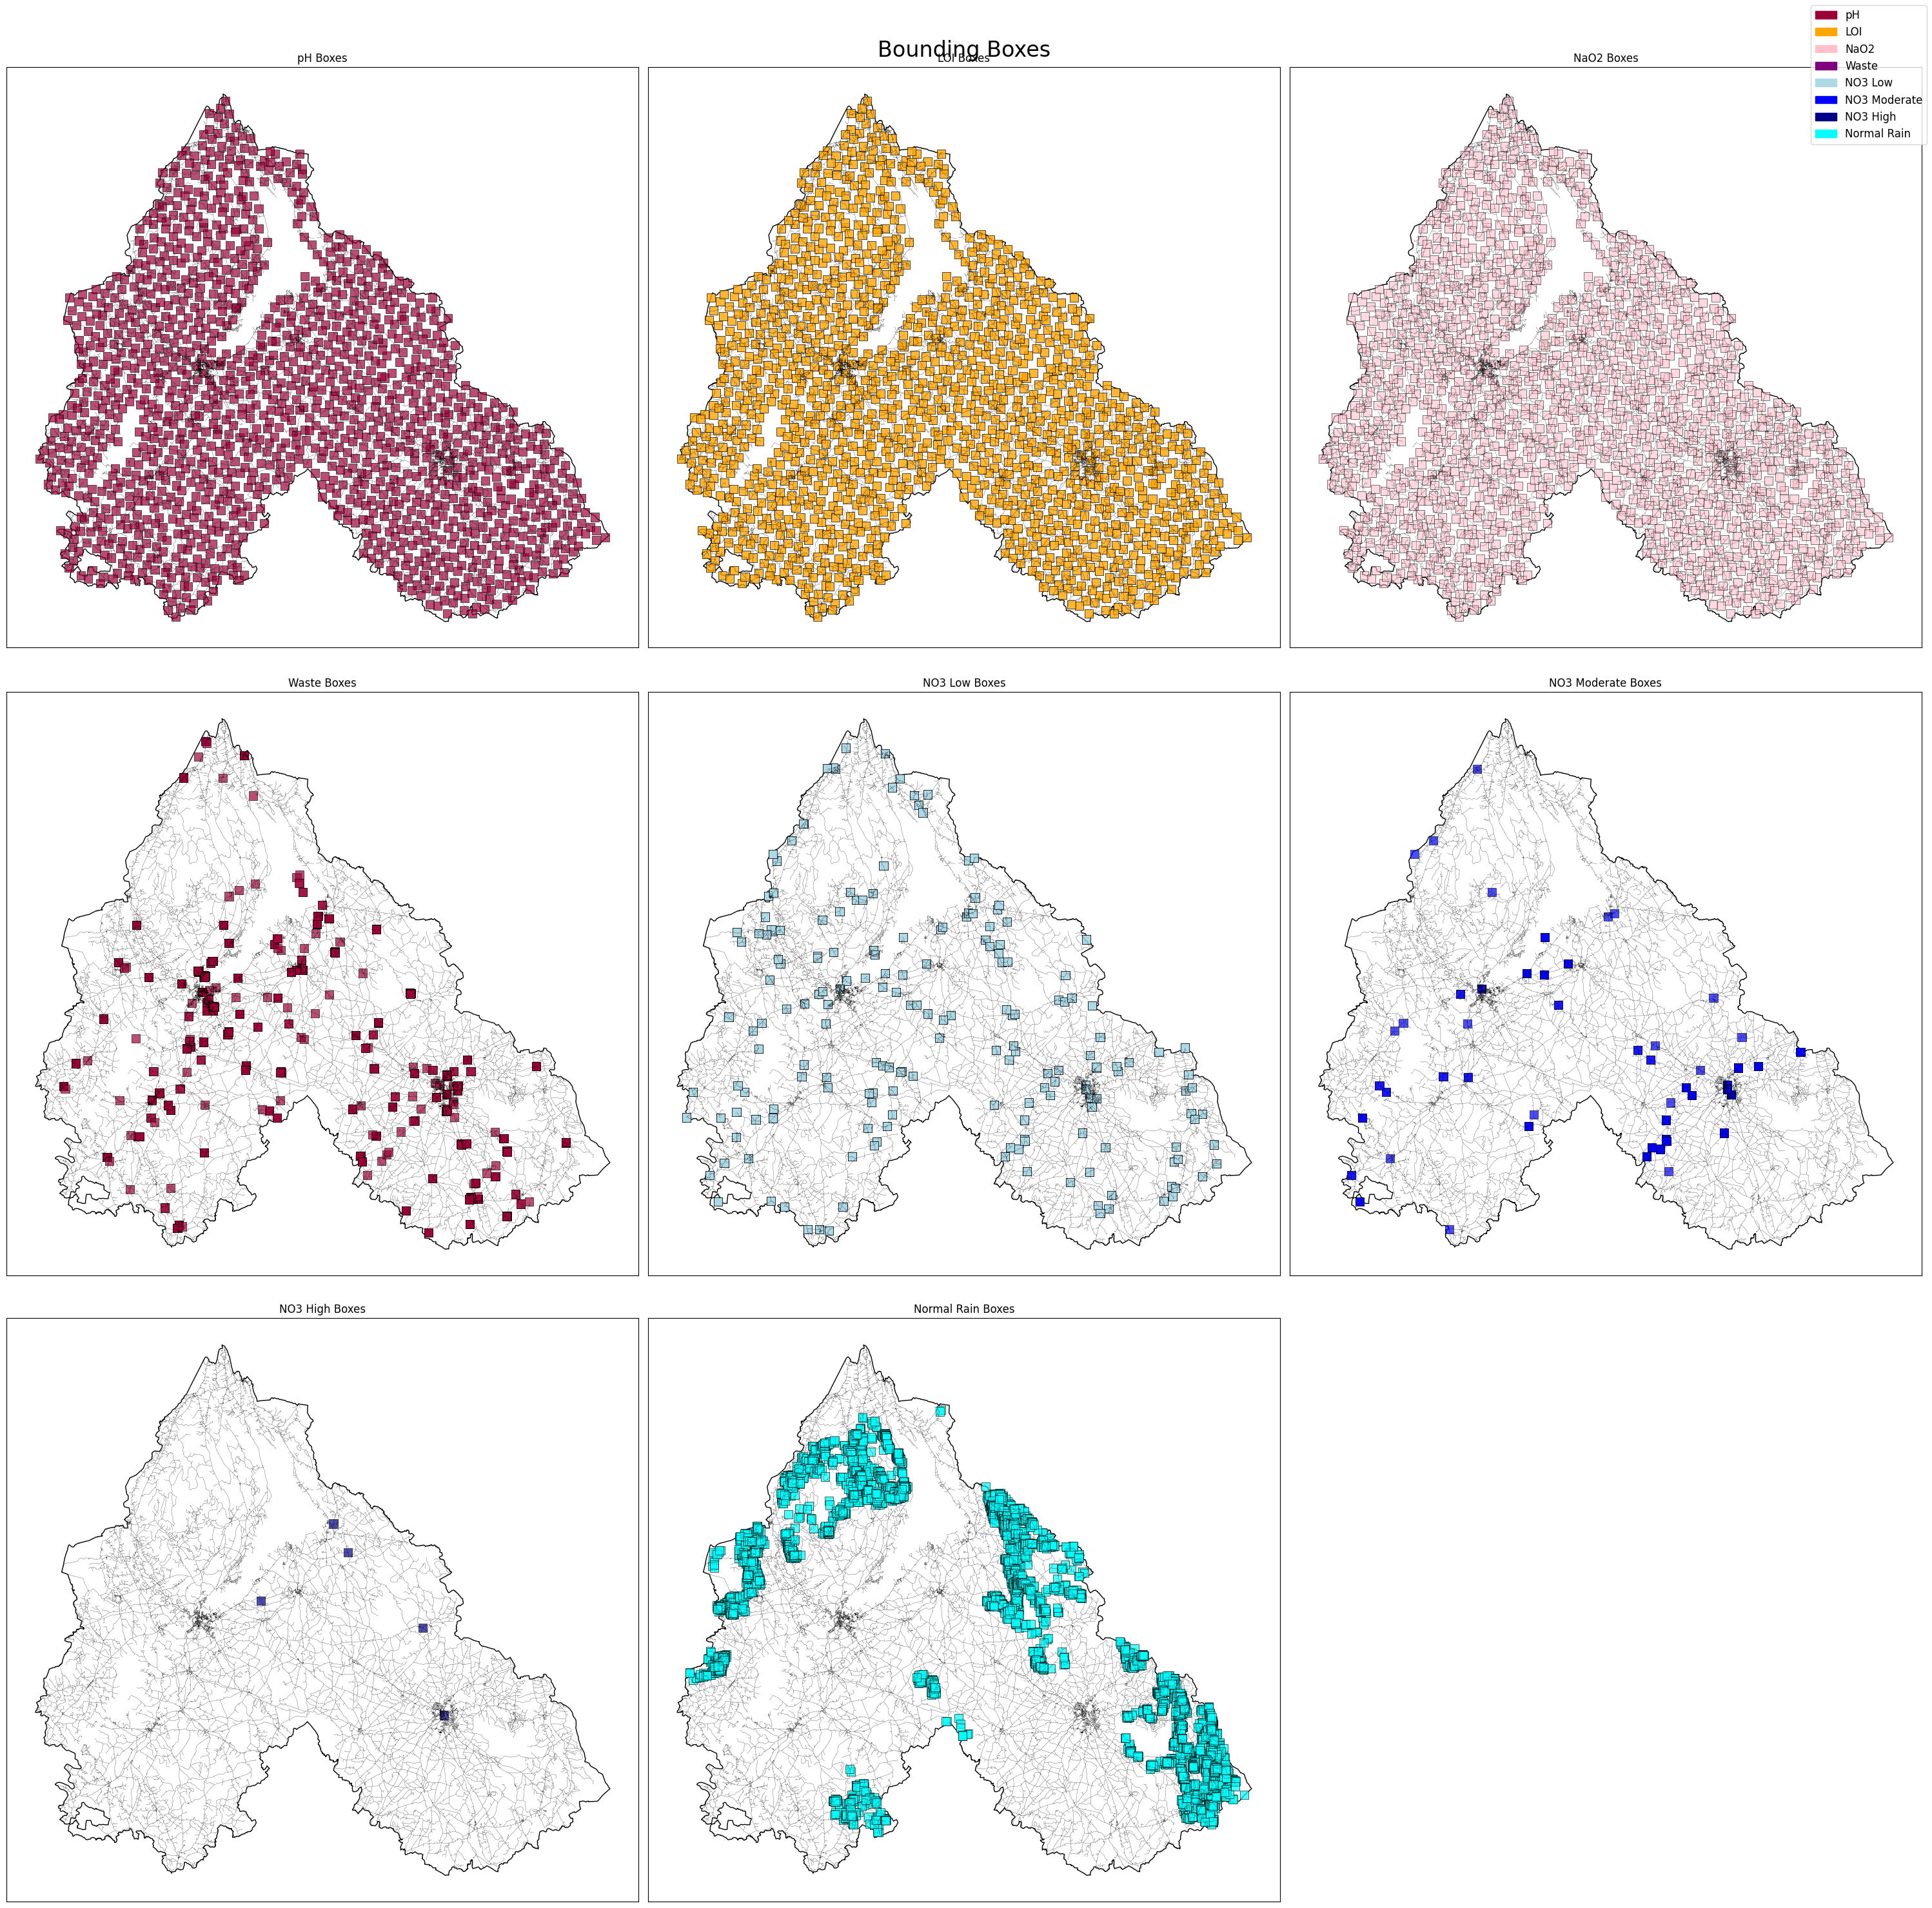
Regarding the wastes we classified them into 5 groups plastic,metal, organic, other(glass, paper, concrete, brick…), and unclassified.
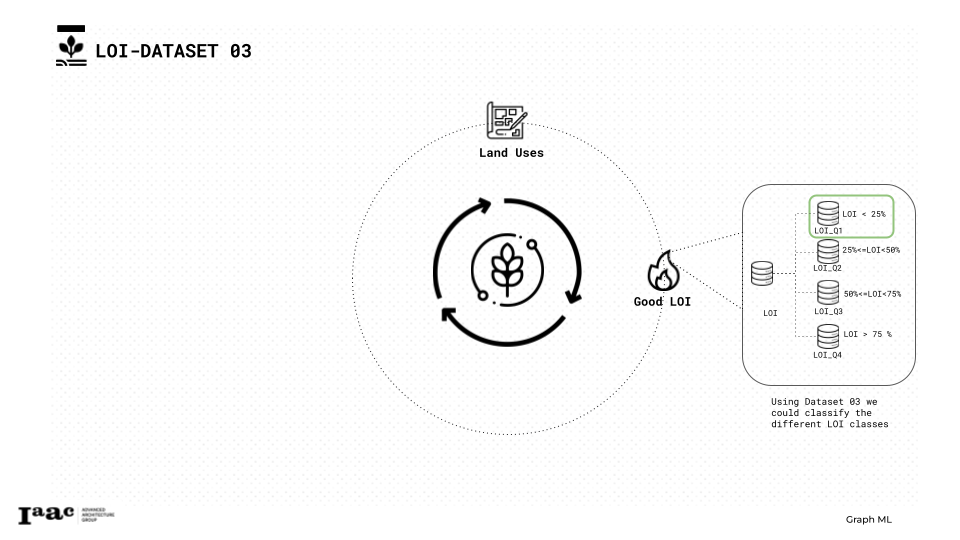
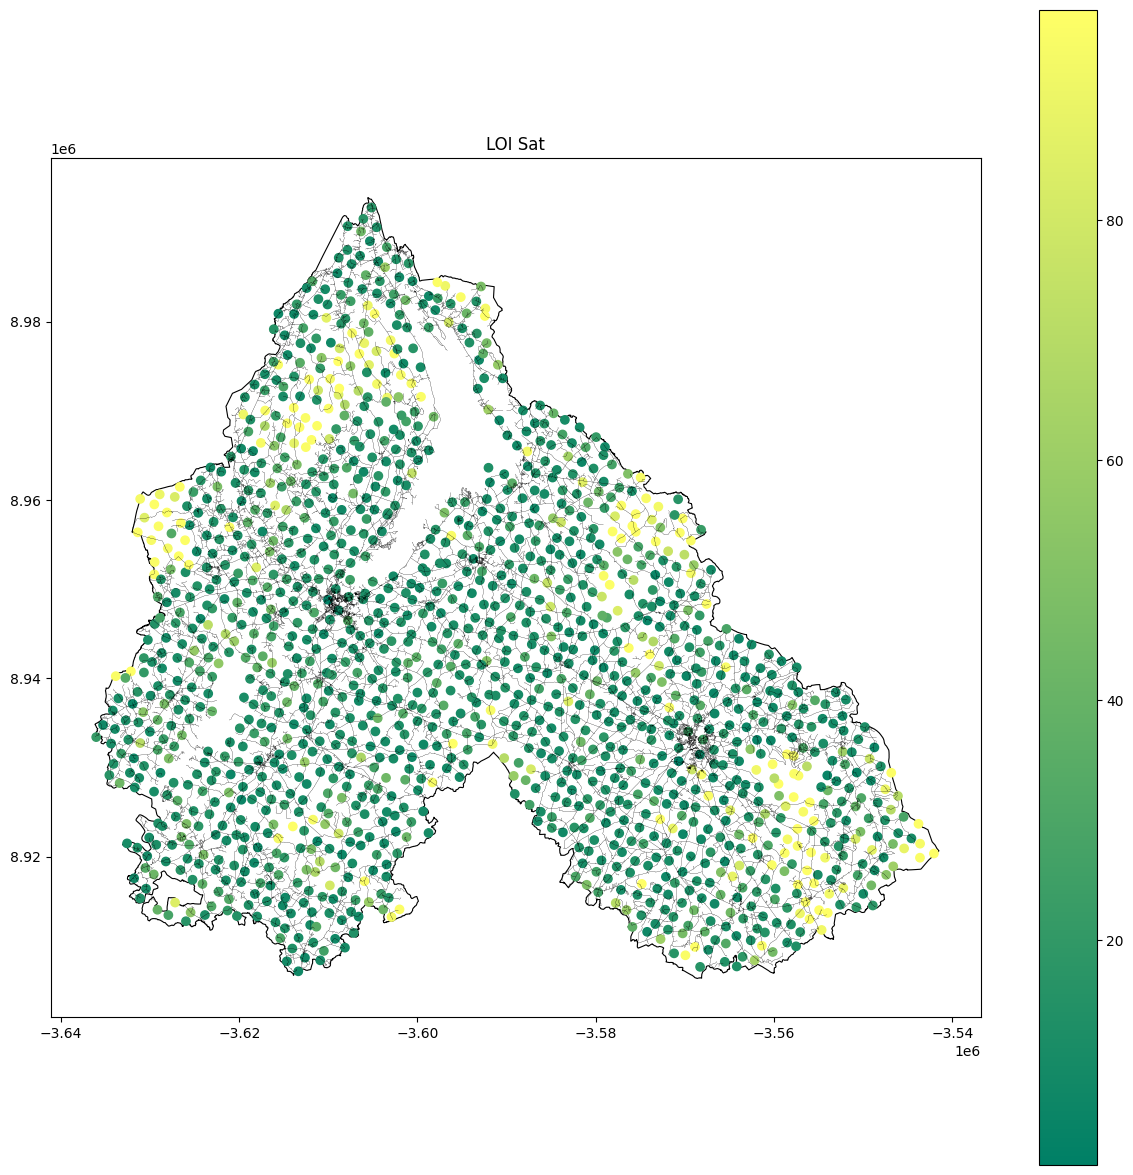
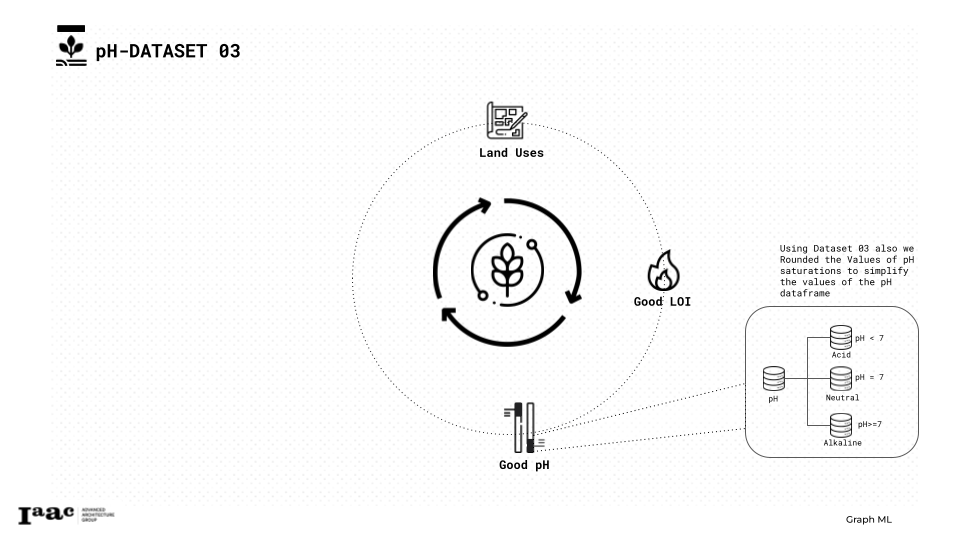
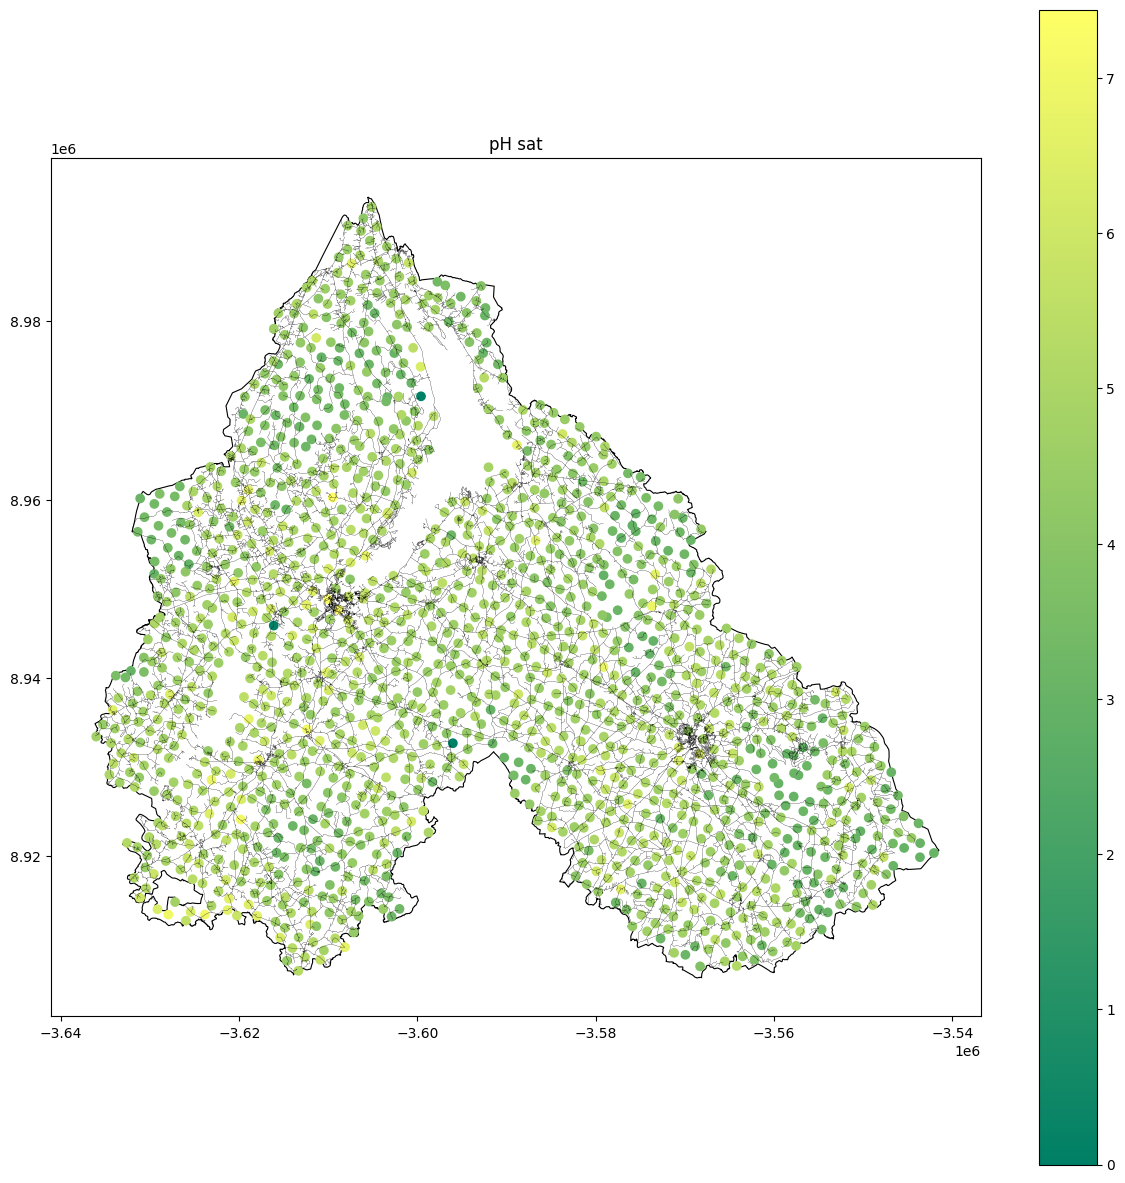
Regarding this slide we used the dataset number 3 to extract the LOI and we classified into Quartile with LOI_Q1 being the best with minimal additions in soil.
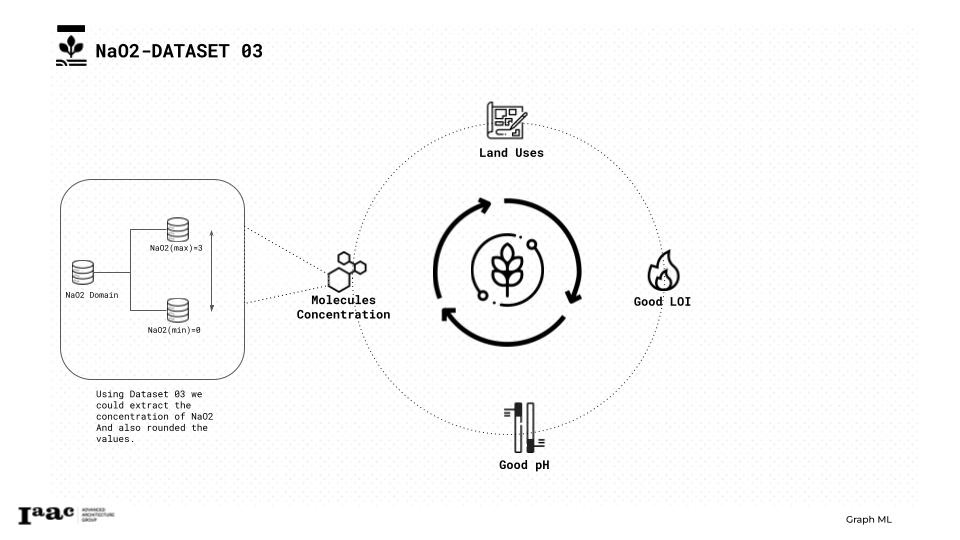
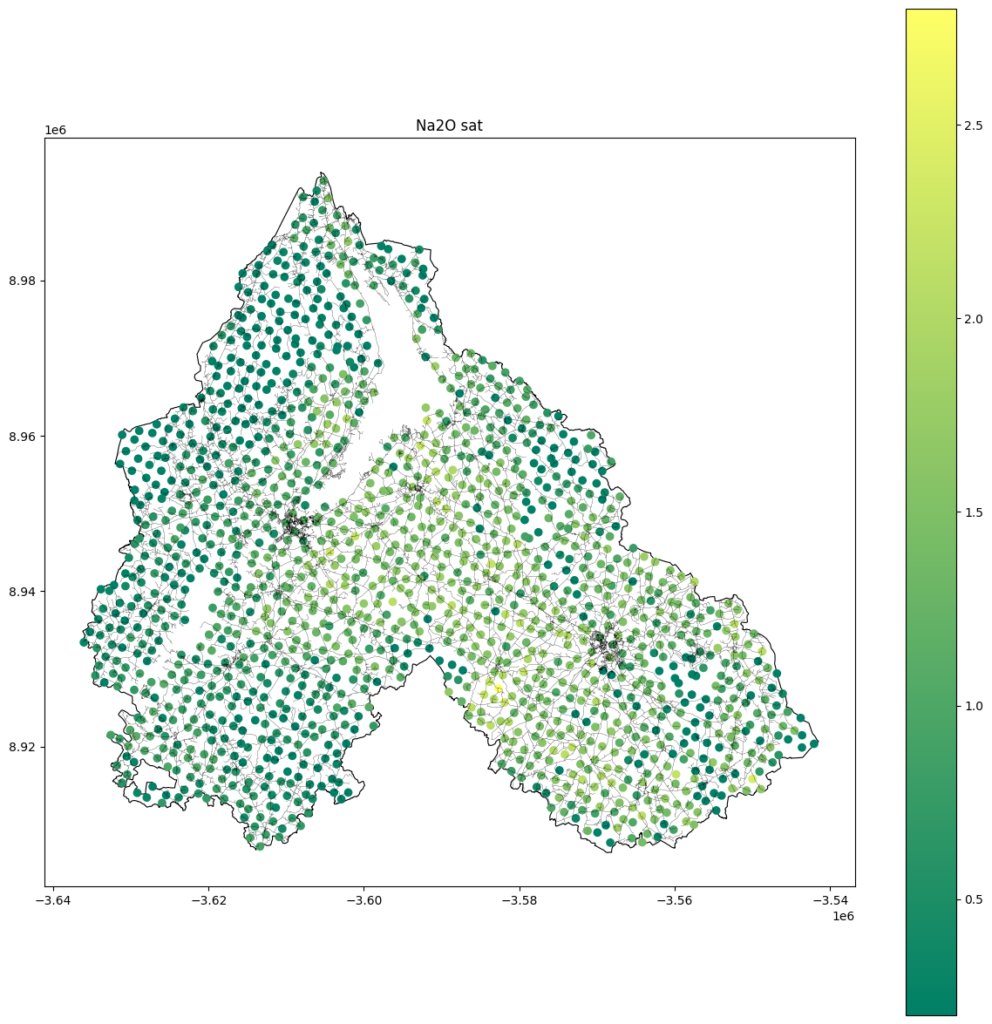
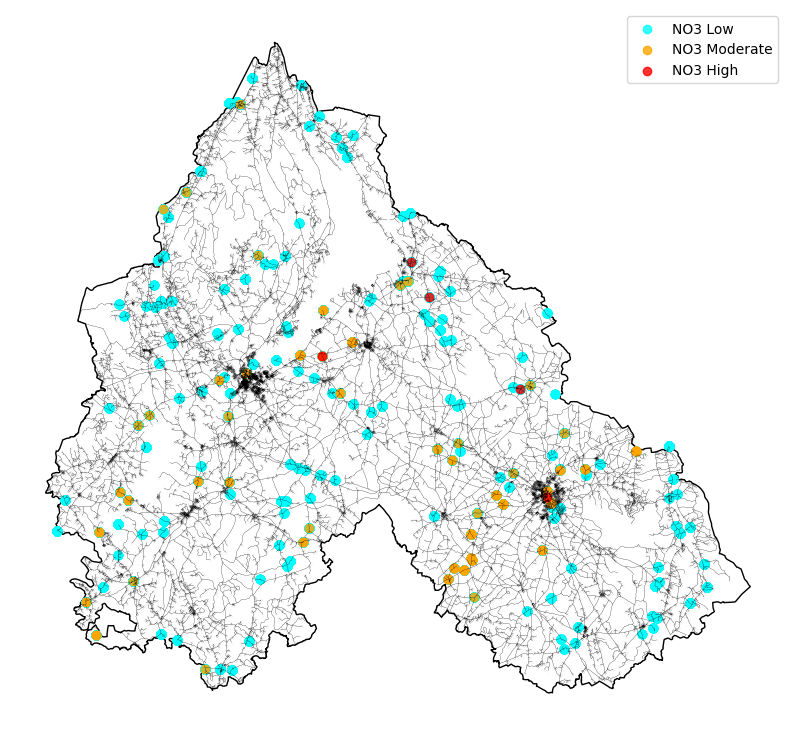
Finally, we used the same dataset to analyze soil molecules, focusing on NaO2 concentration and its impact on soil health.
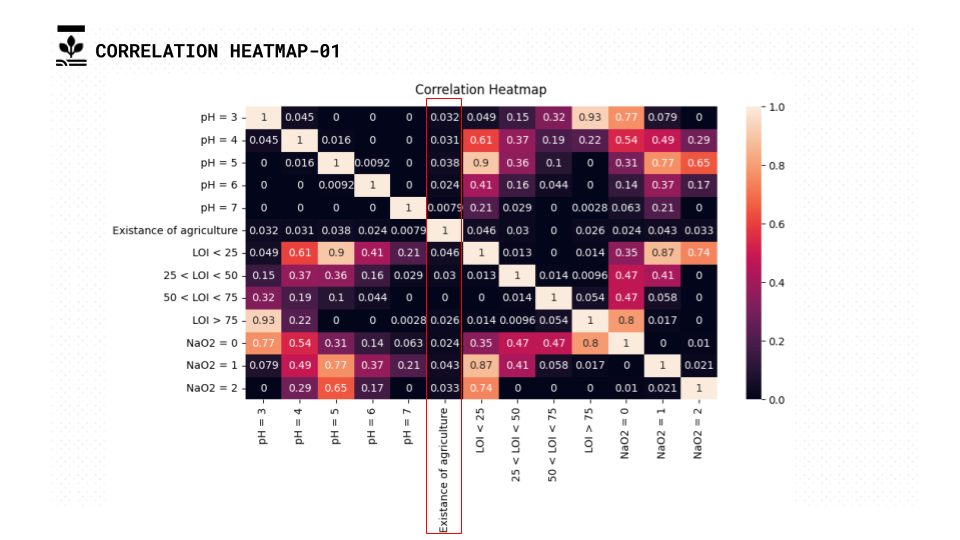
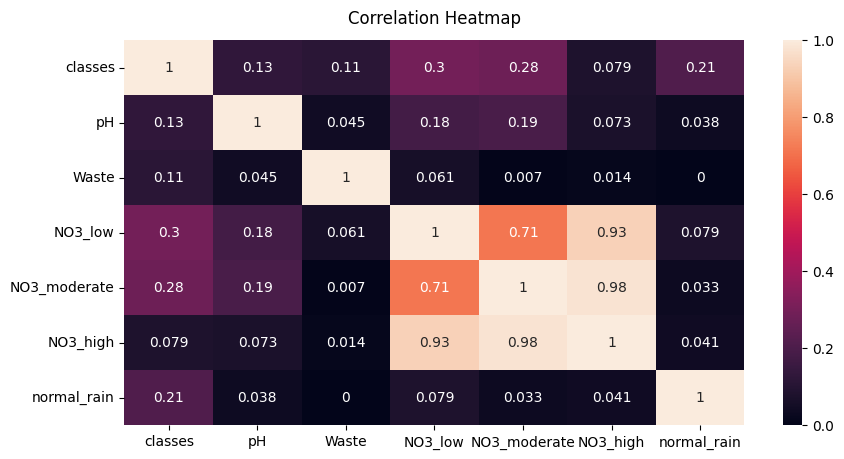
Unfortunately it was conceptually making sense that there will be high correlation between the features that we gathered and our main class the existence of agriculture but after analyzing the data it wasn’t as such.
Now we move on with attributes set up:
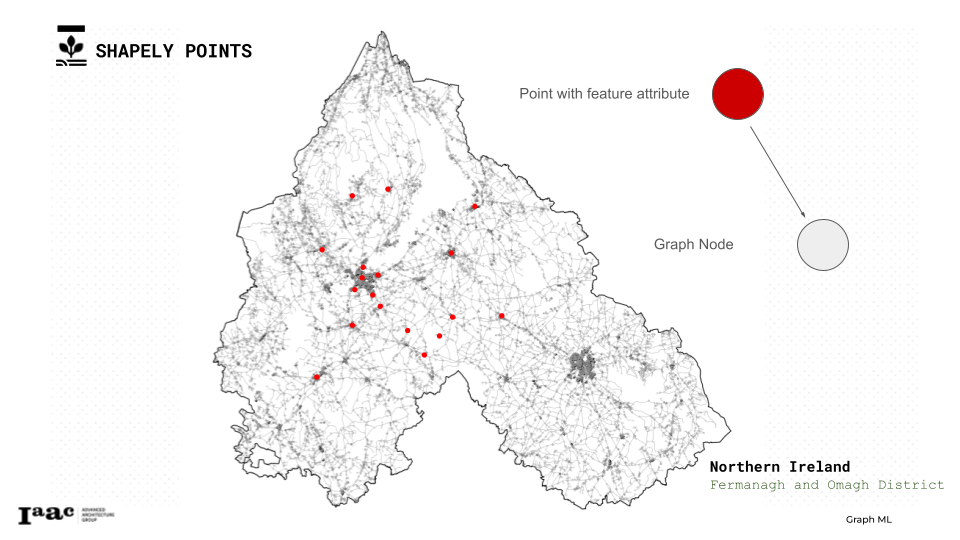
we tried 2 approaches the first one was to select nodes that are the nearest to the Geo points from our datasets
Machine Learning
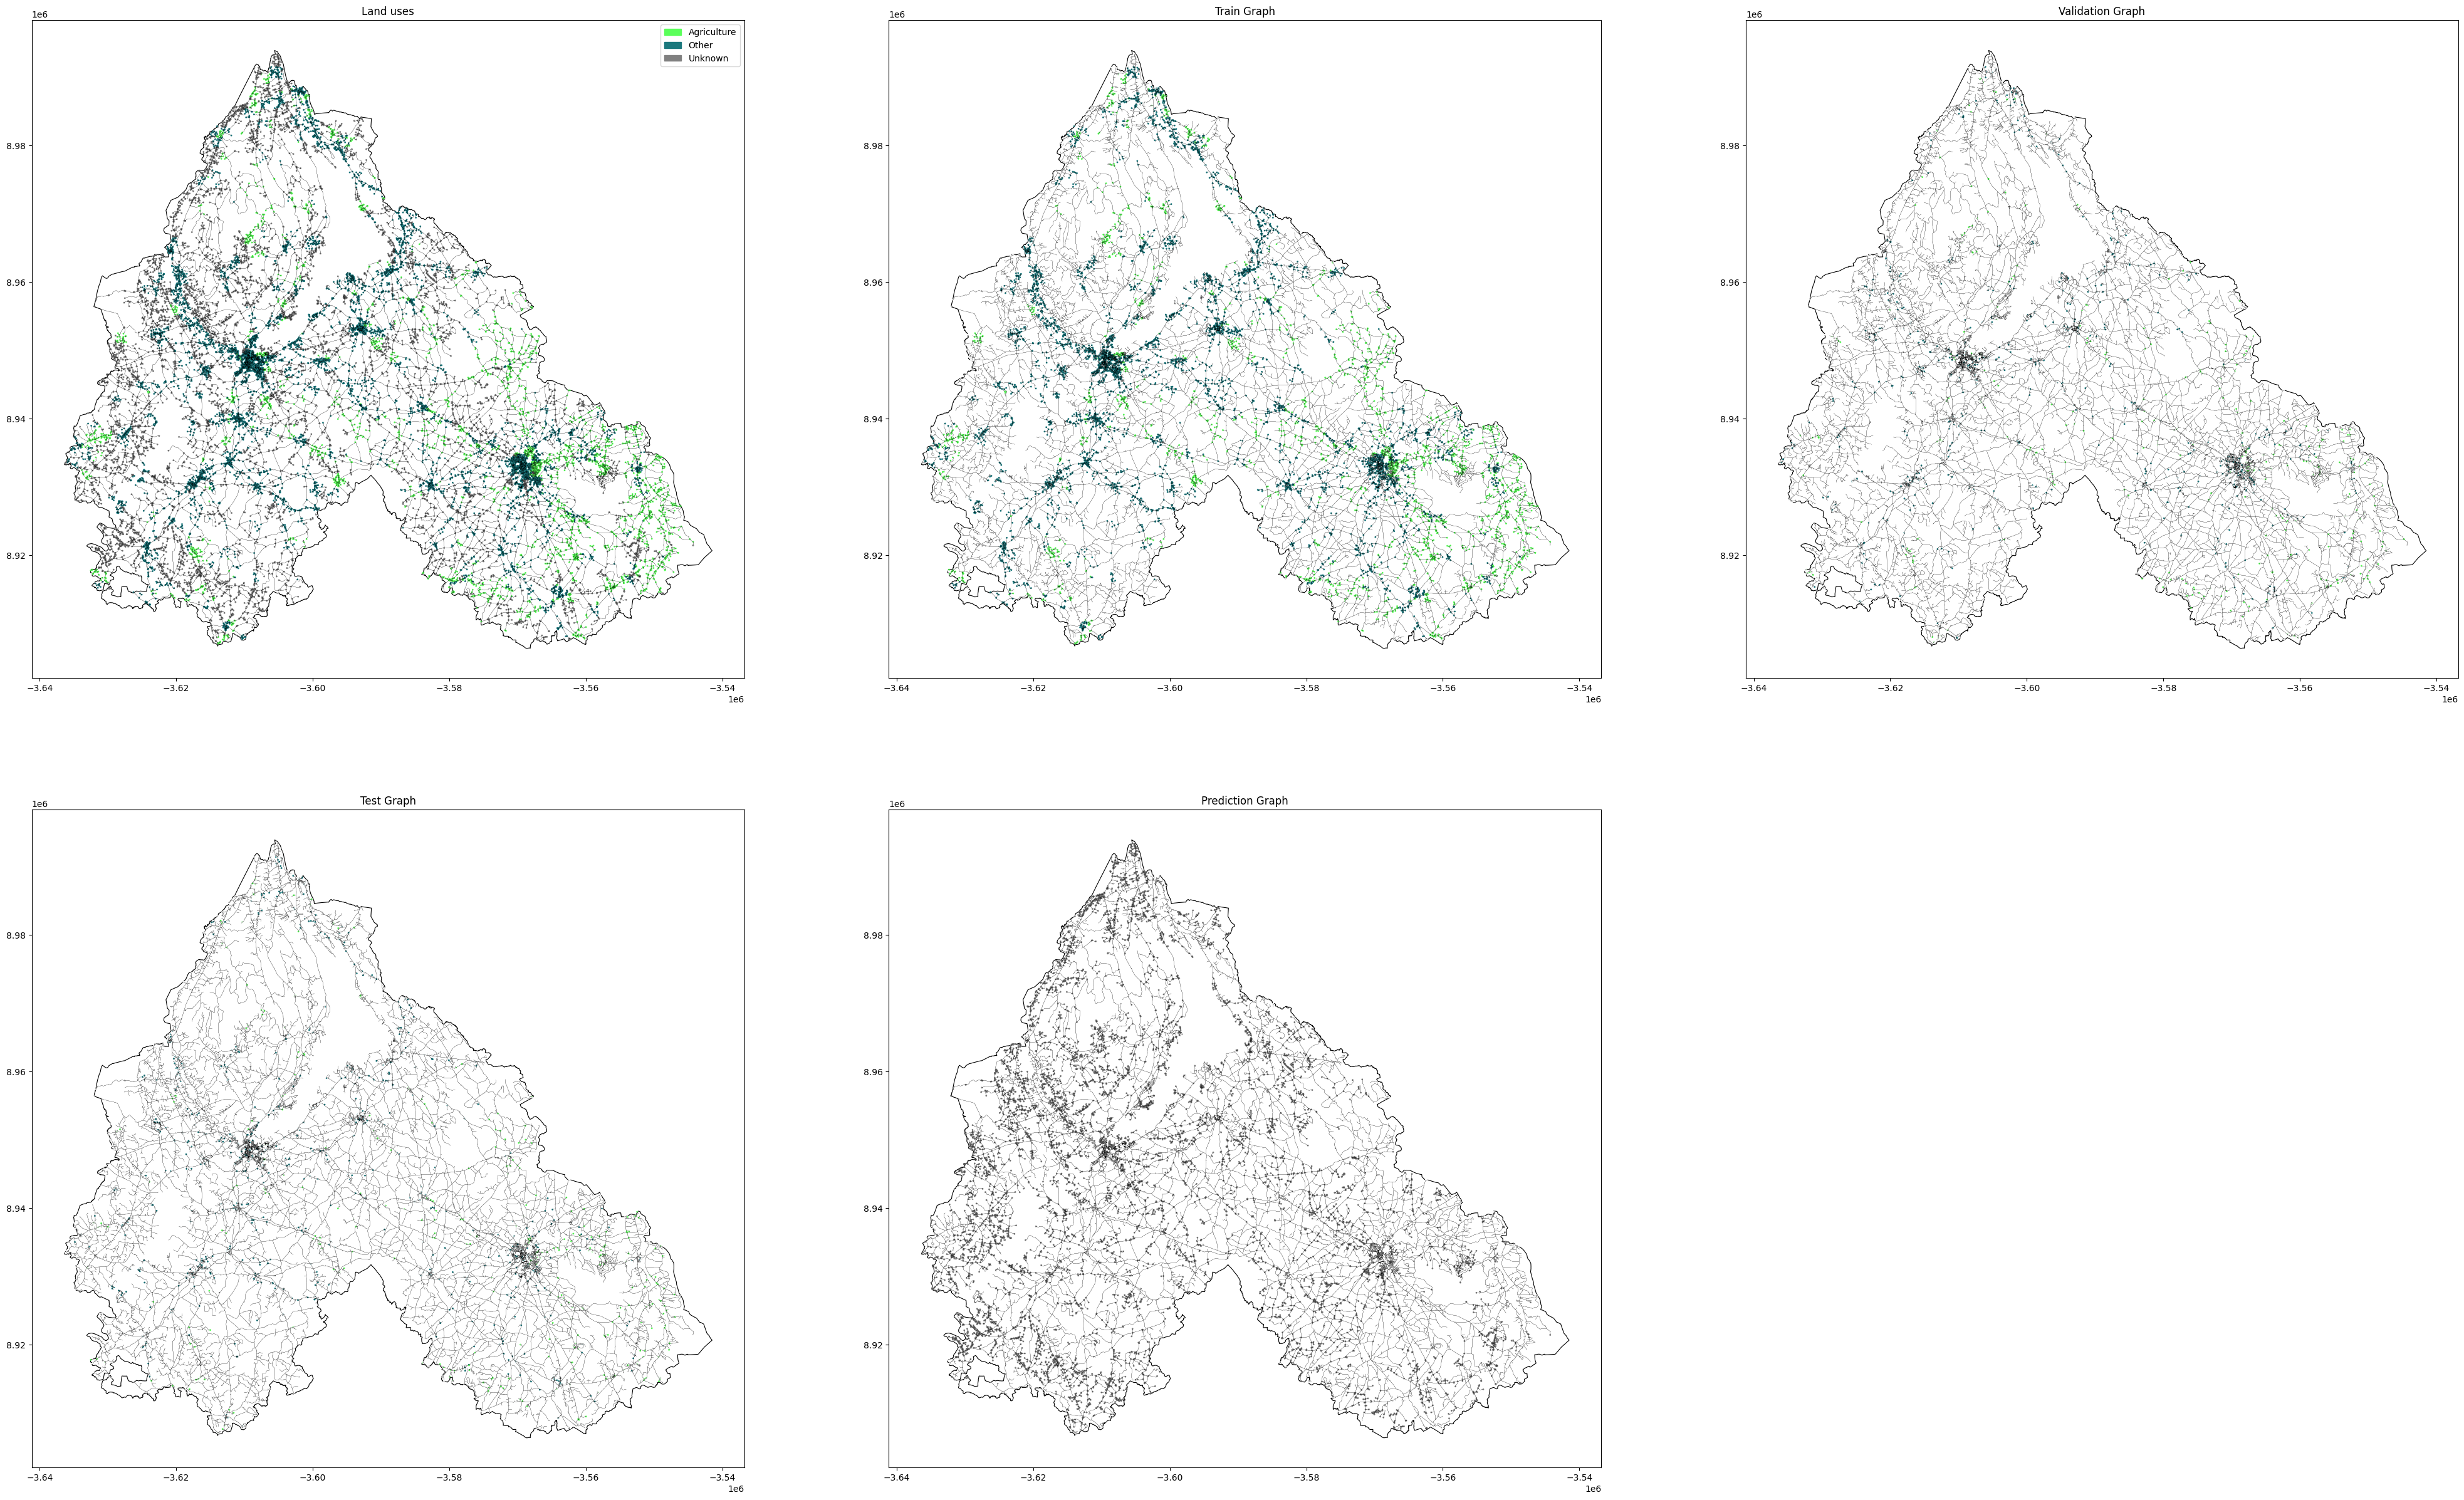
We classified our data into three classes Agriculture, Others and Unknown.

Next this plot shows how we split our data set into Train, test and validation data and even show our targeted nodes to predict if their class can be agricultural land or other uses
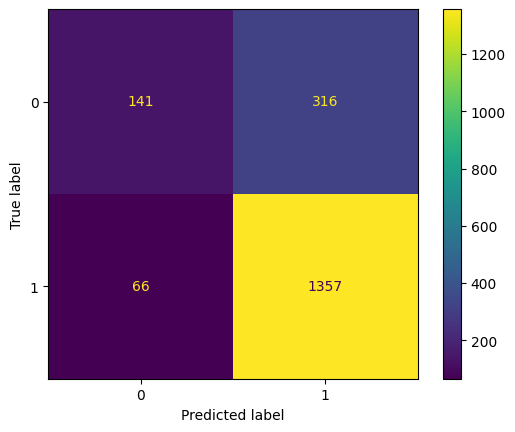
After doing our prediction and checking our confusion matrix we found out that we have some values false predicted
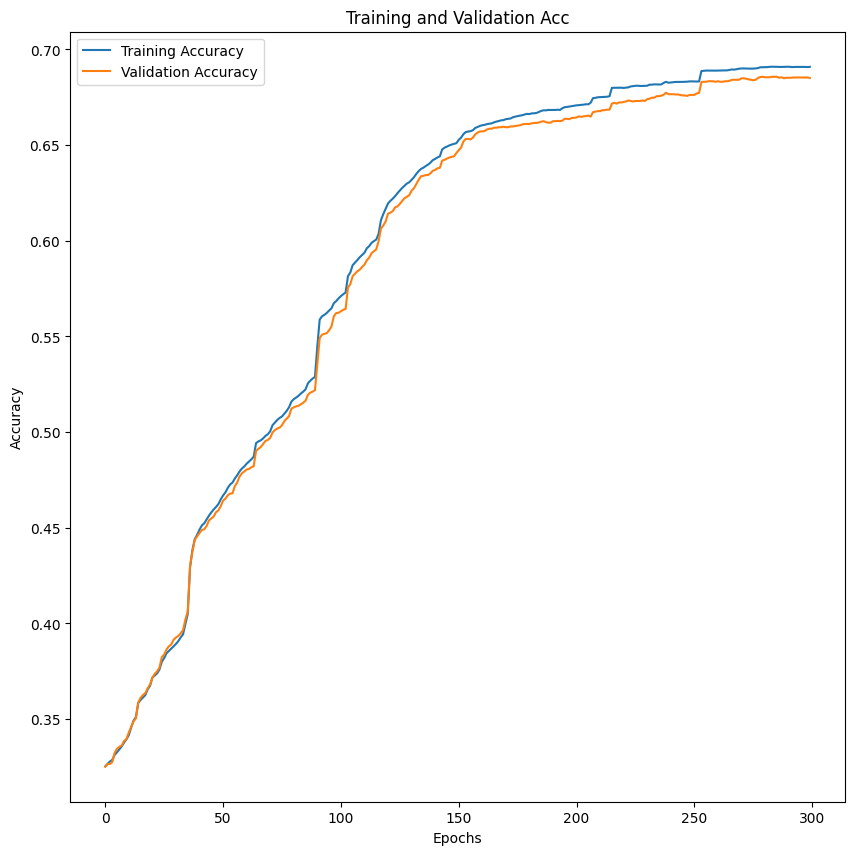
for the training graph we experimented a lot with the hyper parameters and this is the result we got with 16 n-hidden, learning rate of 0.005 and 300 epcoh, and as we can see our model is still learning after 300 epoch.
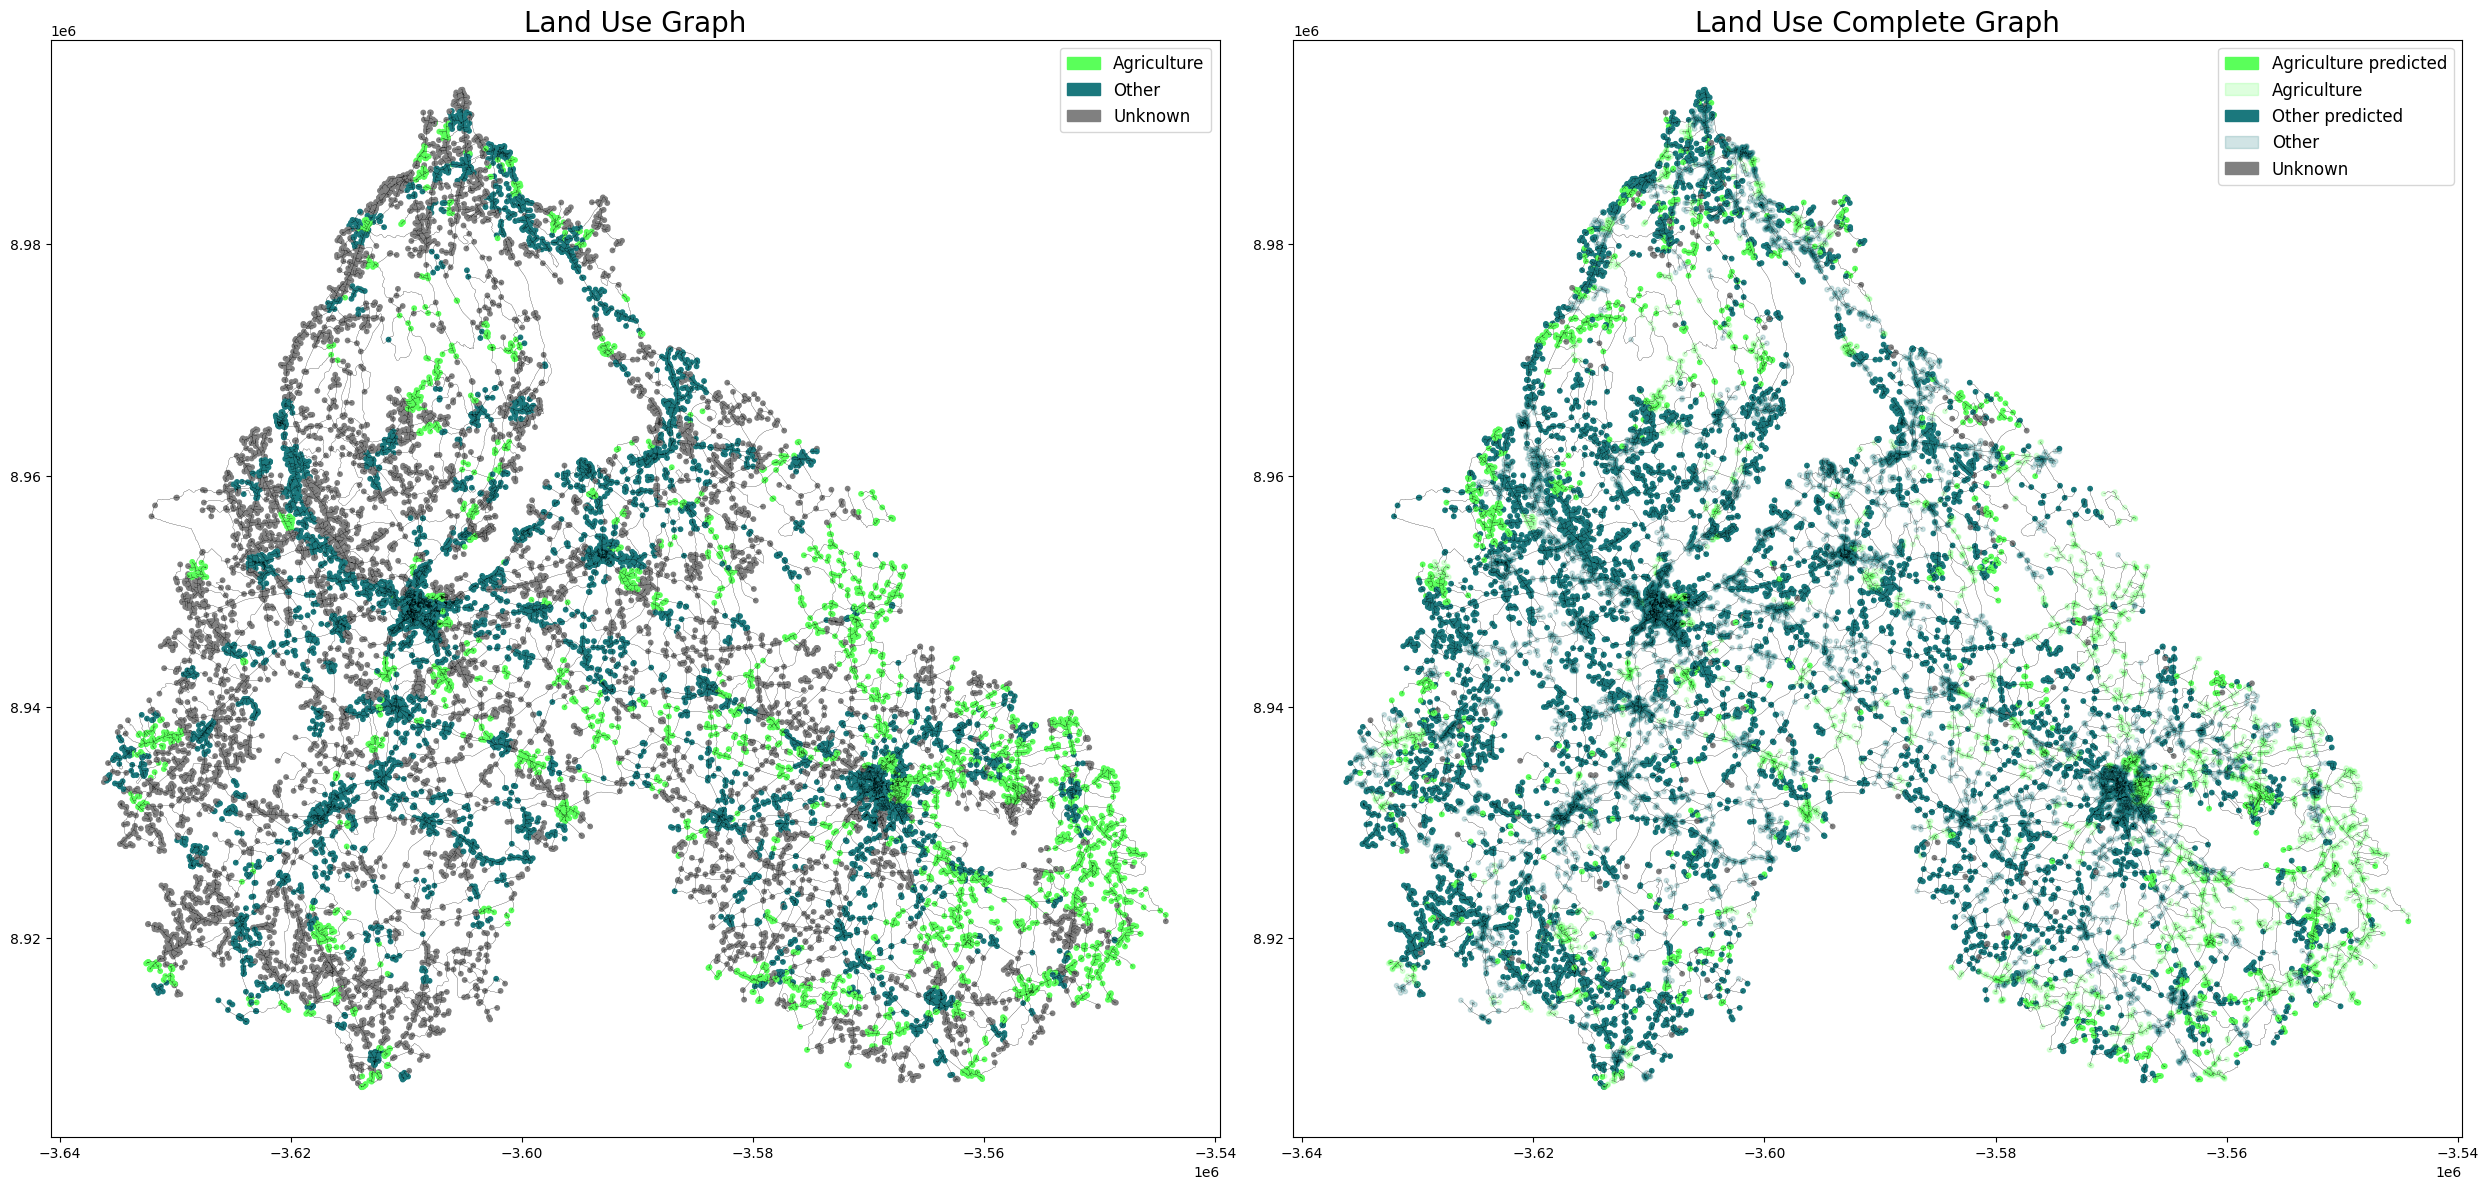
In this section we can see our prediction results all the unknown nodes were predicted and split between agriculture and others
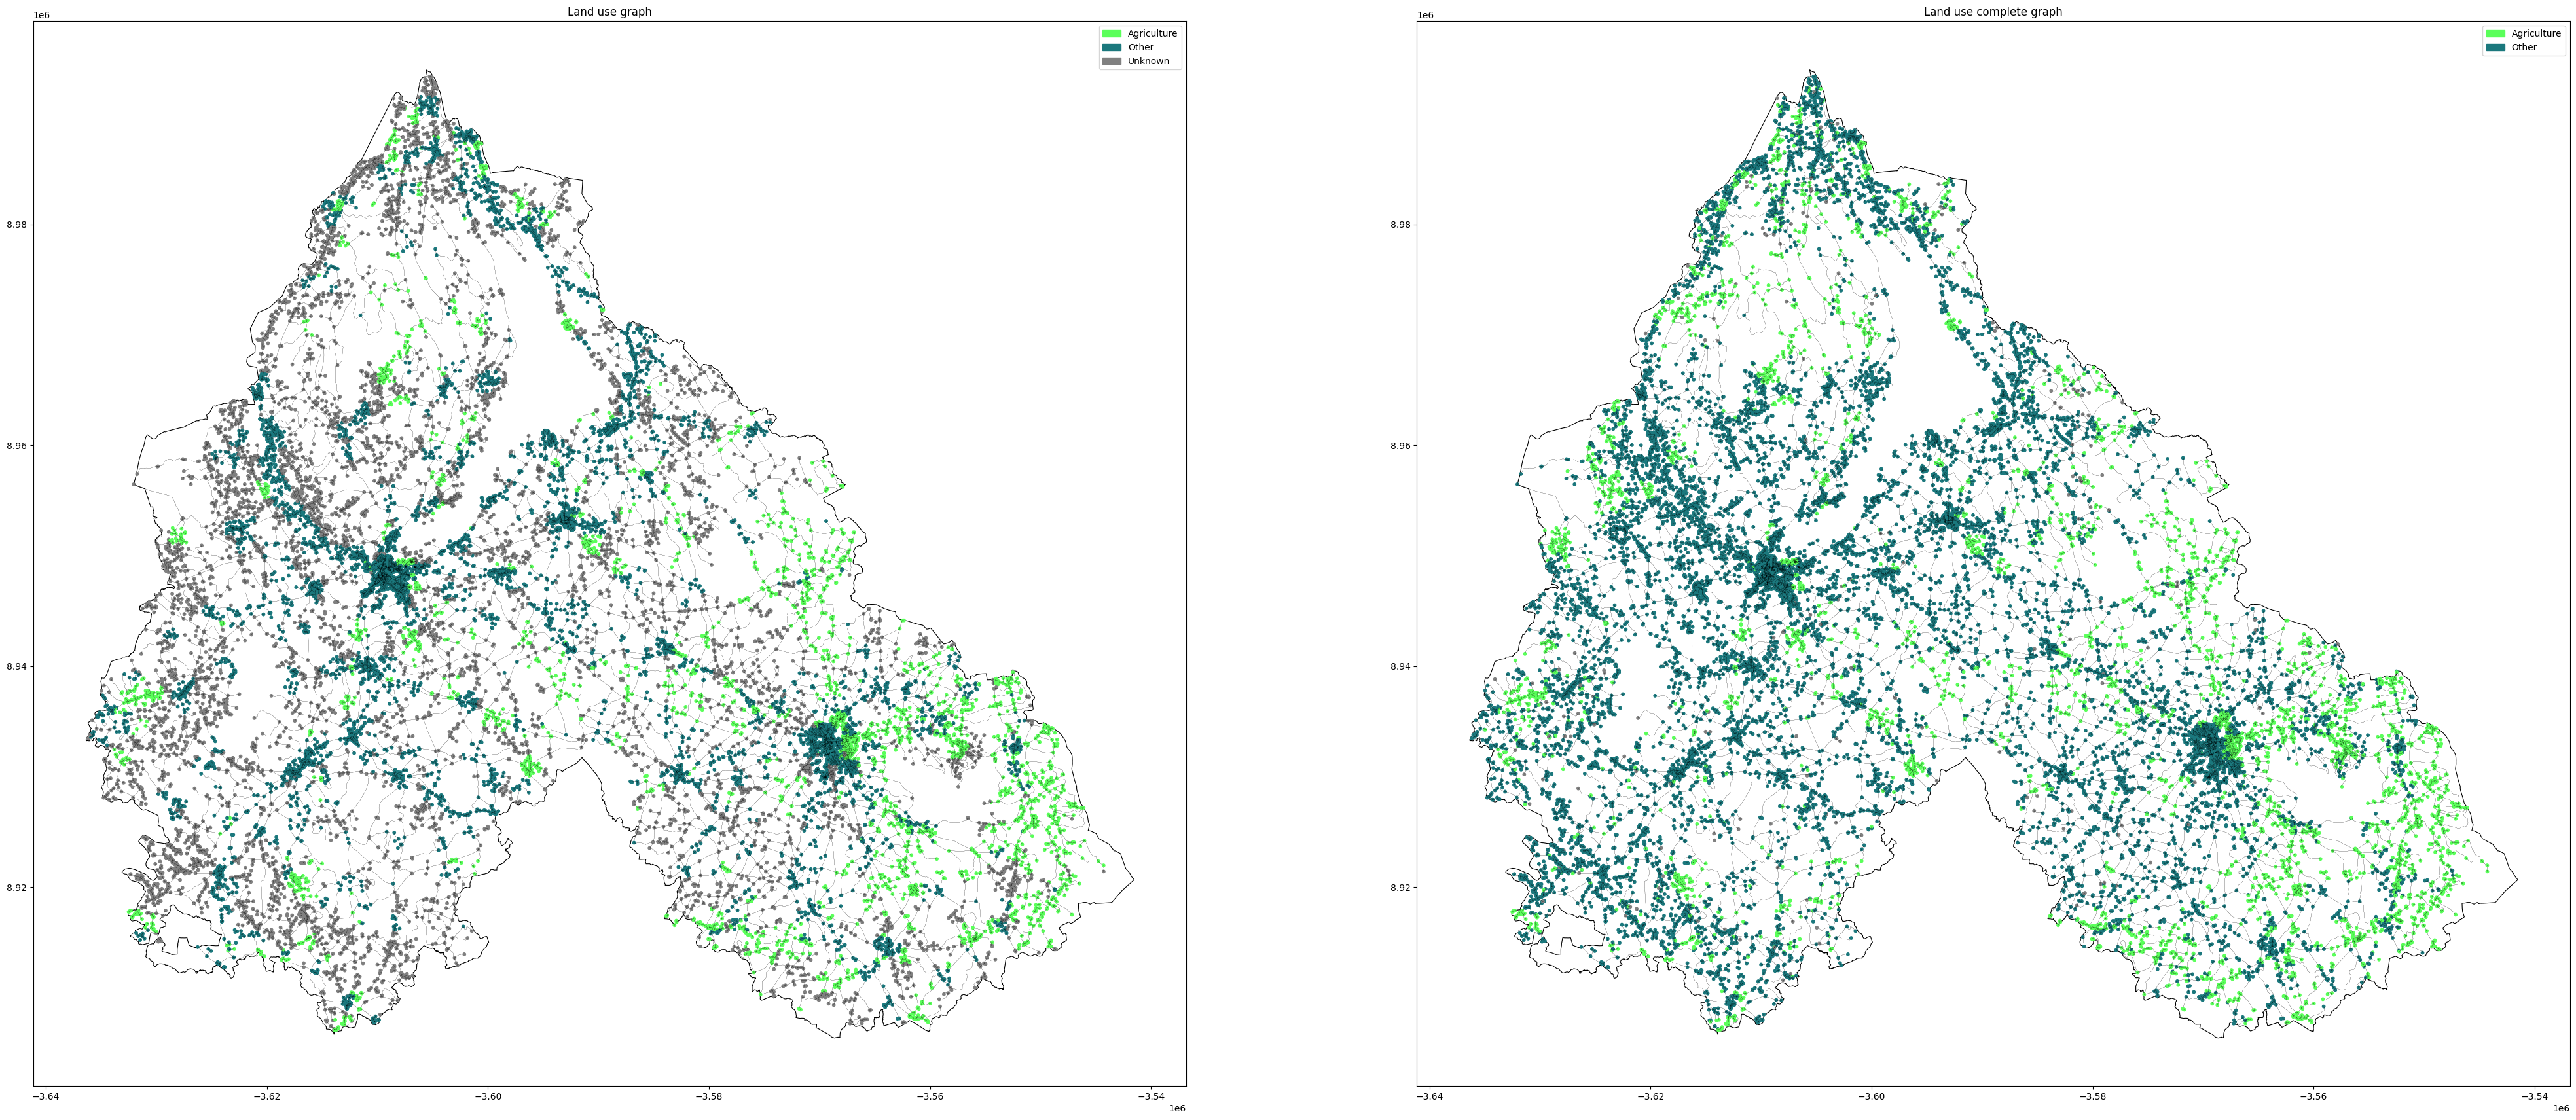
At last we overlayed our prediction graph with the ground truth ones so we can compare and spot the differences.