
The Data Think workshop successfully gathered insights into how we can assess images of urban spaces and rank them through different indicators. For our group, we saw that different environments impact accessibility and mobility for various demographic groups, including vulnerable populations. By engaging in a ranking exercise using photographs, we identified key factors influencing accessibility:
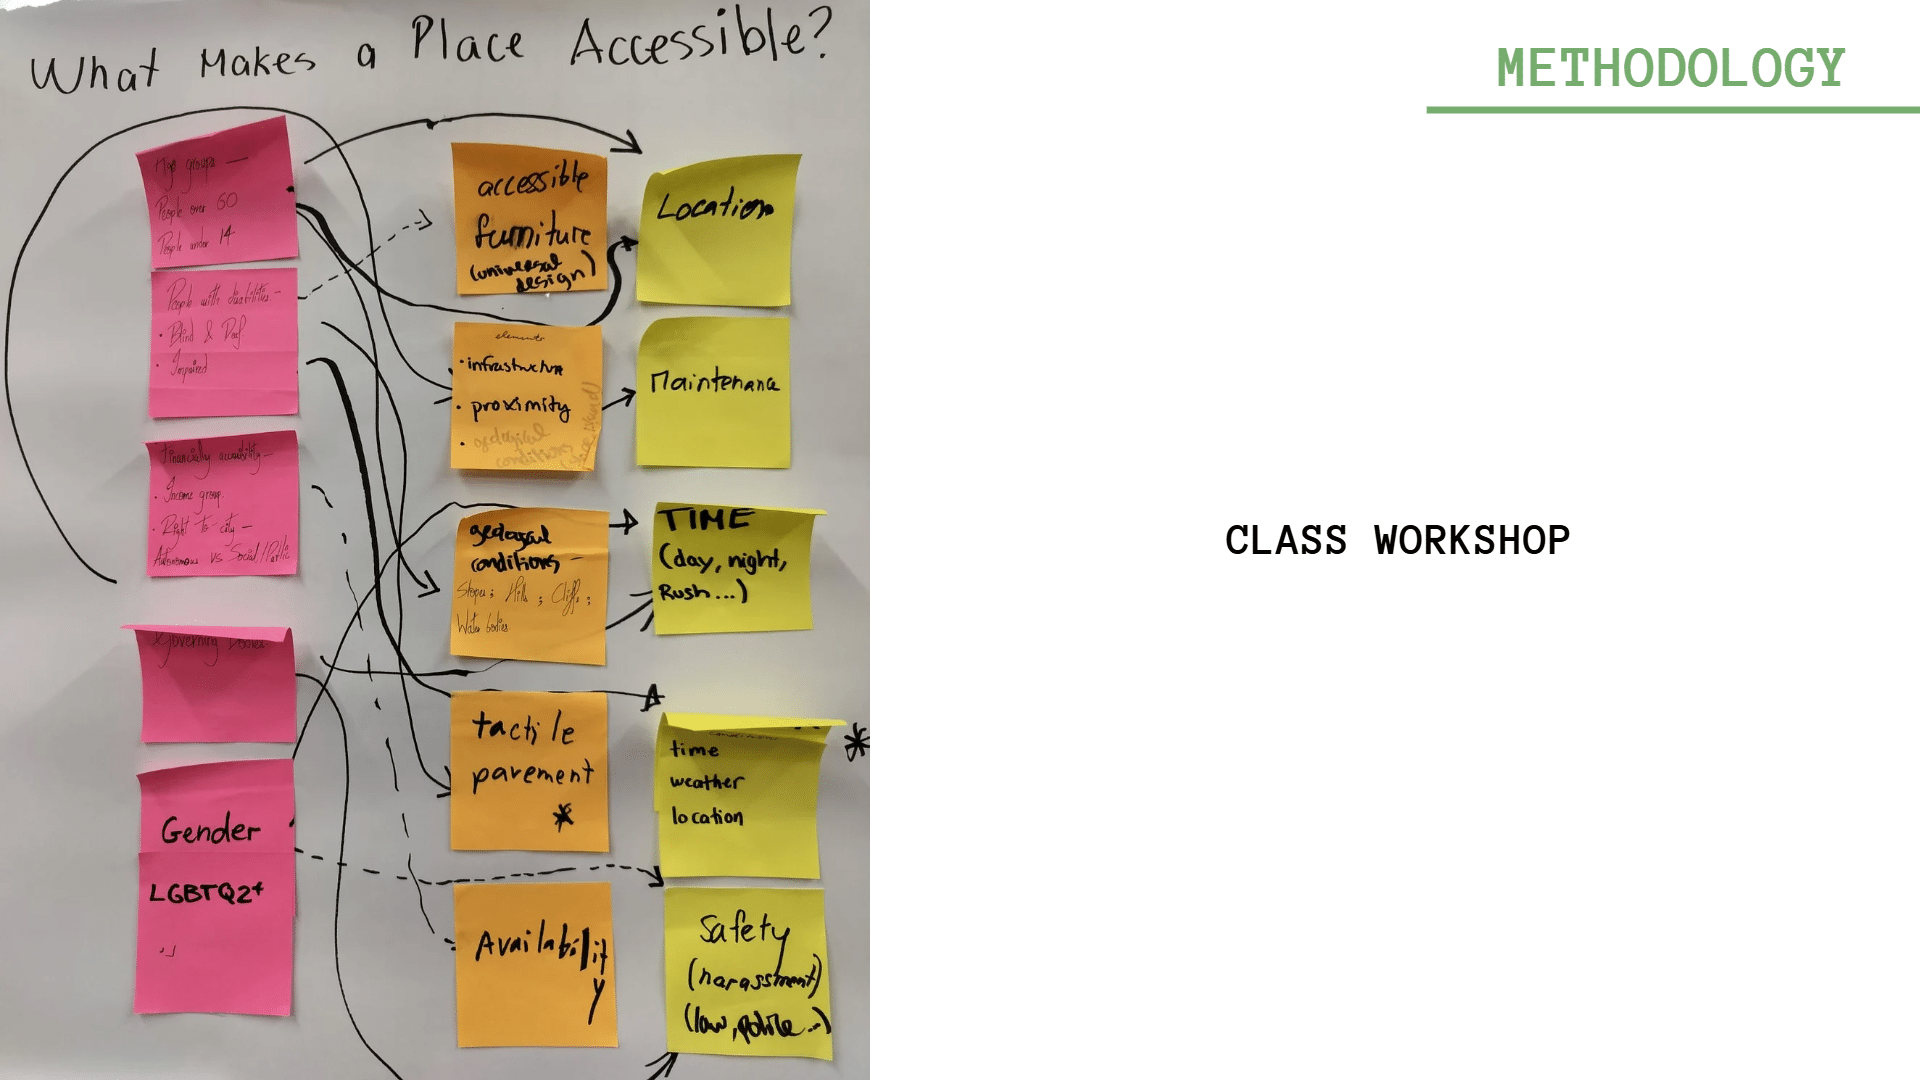
- Key Factors Identified:
- Safety: Participants emphasized the importance of safe pathways and environments, particularly for pedestrians and cyclists.
- Availability of Public Transport: Accessibility was strongly linked to the presence and convenience of public transport options.
- Physical Barriers: The existence of physical obstacles and the quality of infrastructure (such as ramps, crossings, and road surfaces) were critical in determining accessibility.
- Weather Protection: Elements like sheltered walkways and shaded areas were seen as essential for enhancing accessibility in various weather conditions.
- Location and Connectivity: The ease of navigating between different urban spaces was a recurrent theme.
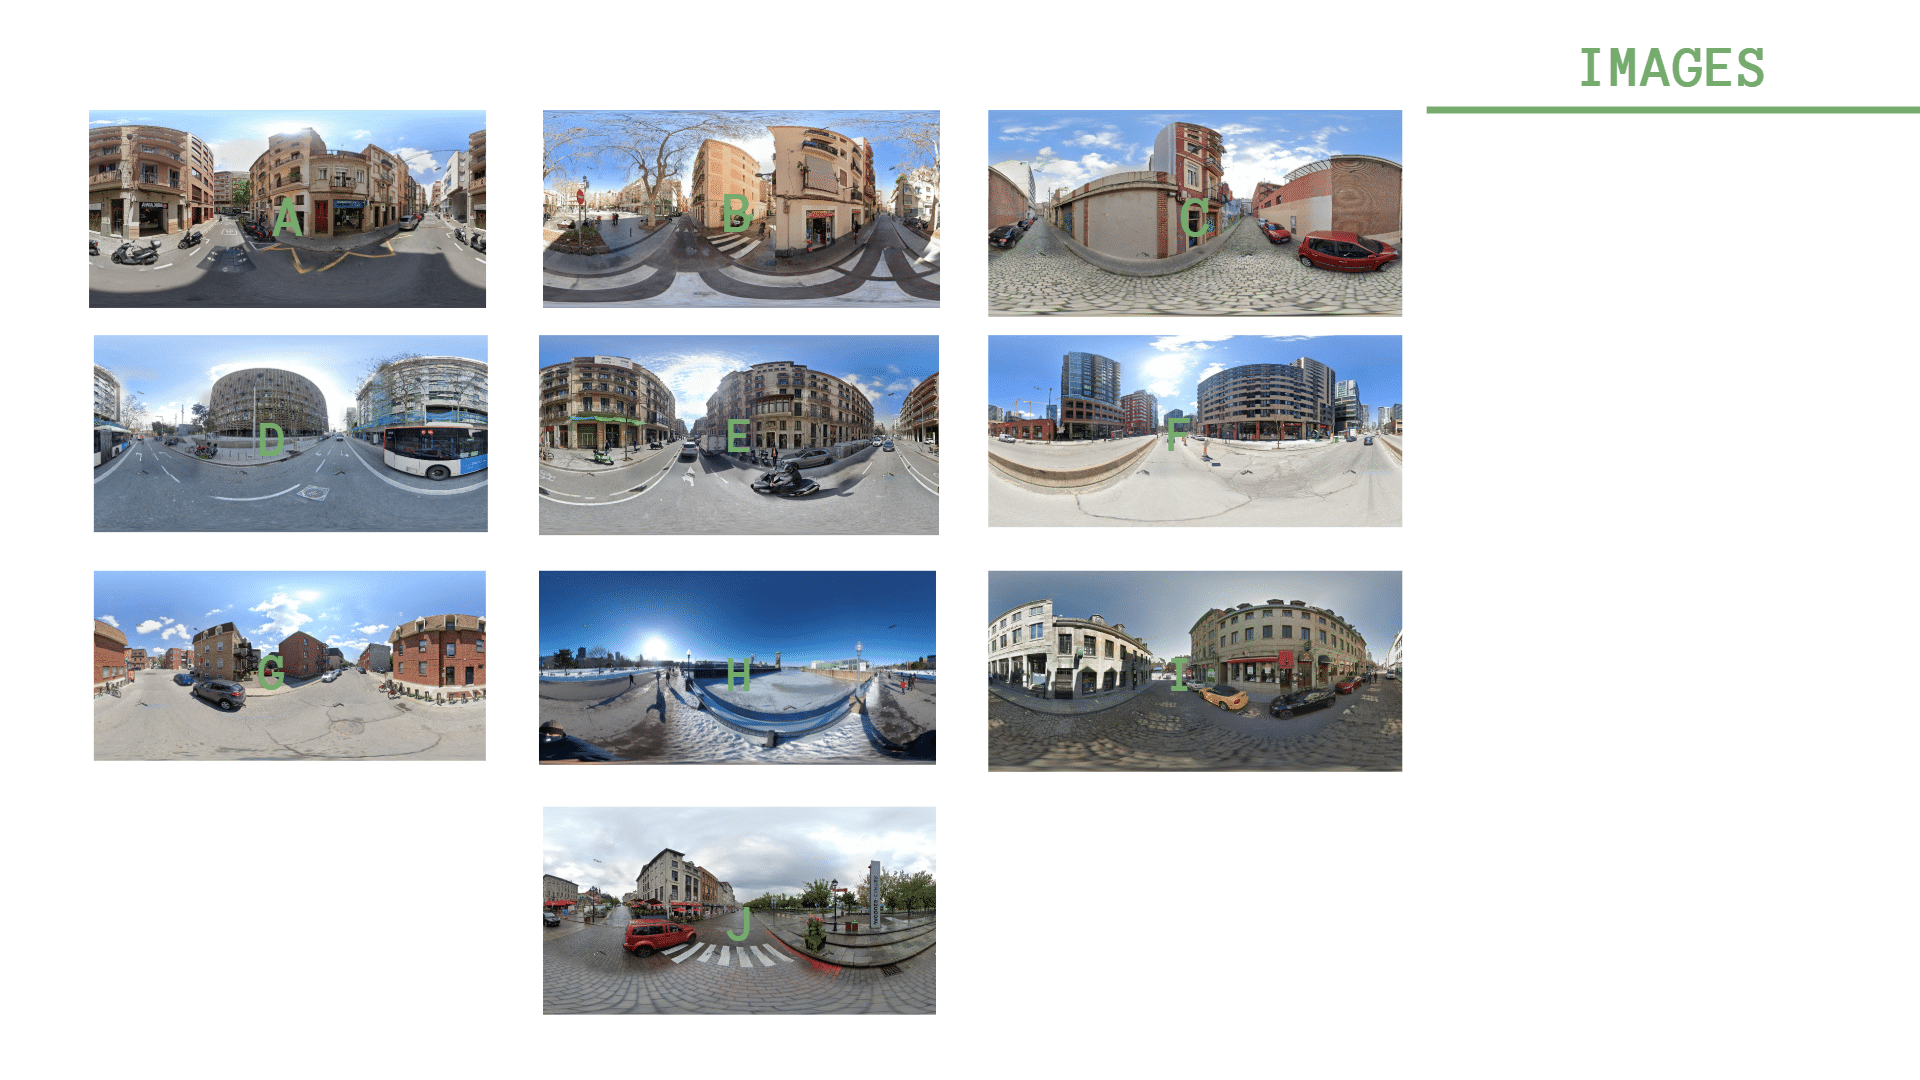
- Ranking Insights:
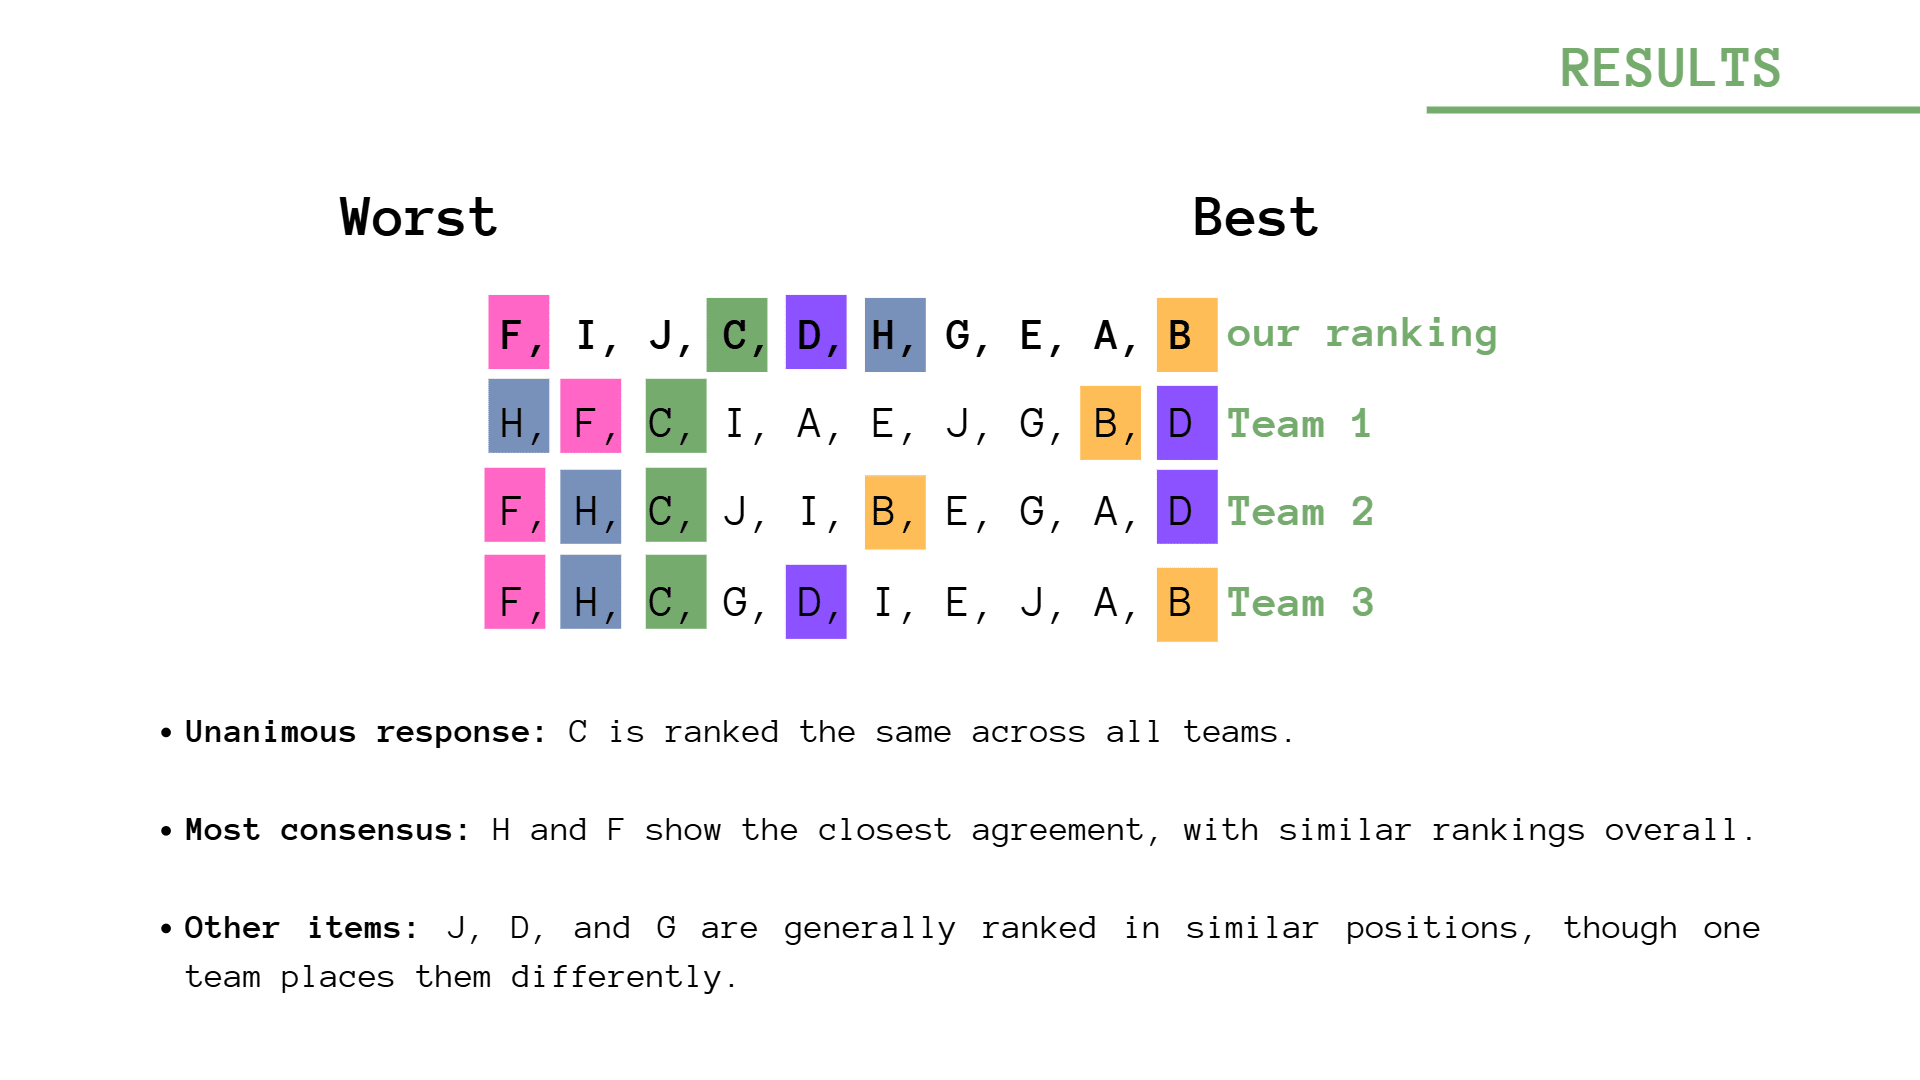
- The ranking results indicated a preference for environments that integrate safety, convenience, and minimal physical barriers.
- Images showcasing smooth transitions, well-marked paths, and clear signage were rated higher in accessibility.
- Areas perceived as isolated or lacking visible public transport options were ranked lower.
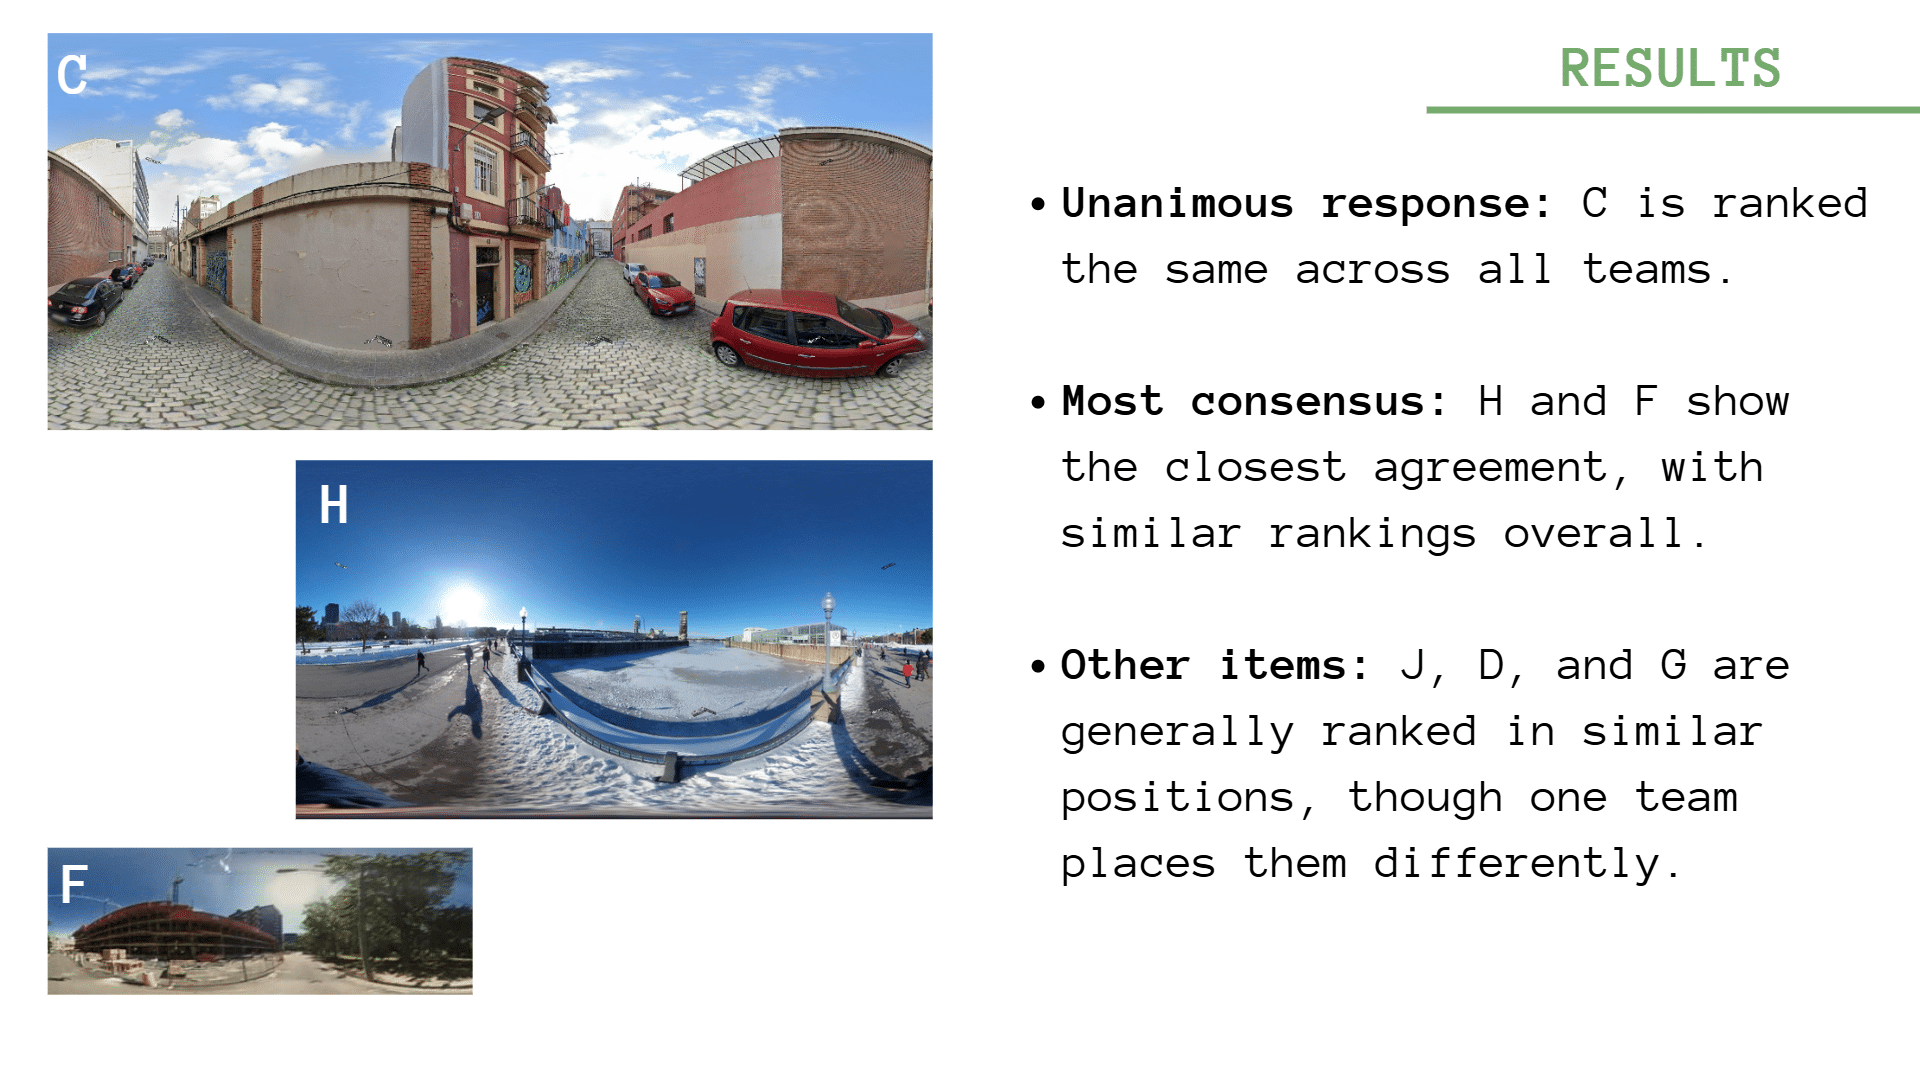
- Contrasting Perspectives:
- The rankings also revealed diverse perspectives based on participants’ experiences and needs. For instance, what was accessible for one group (such as cyclists) might not be for others (such as wheelchair users).
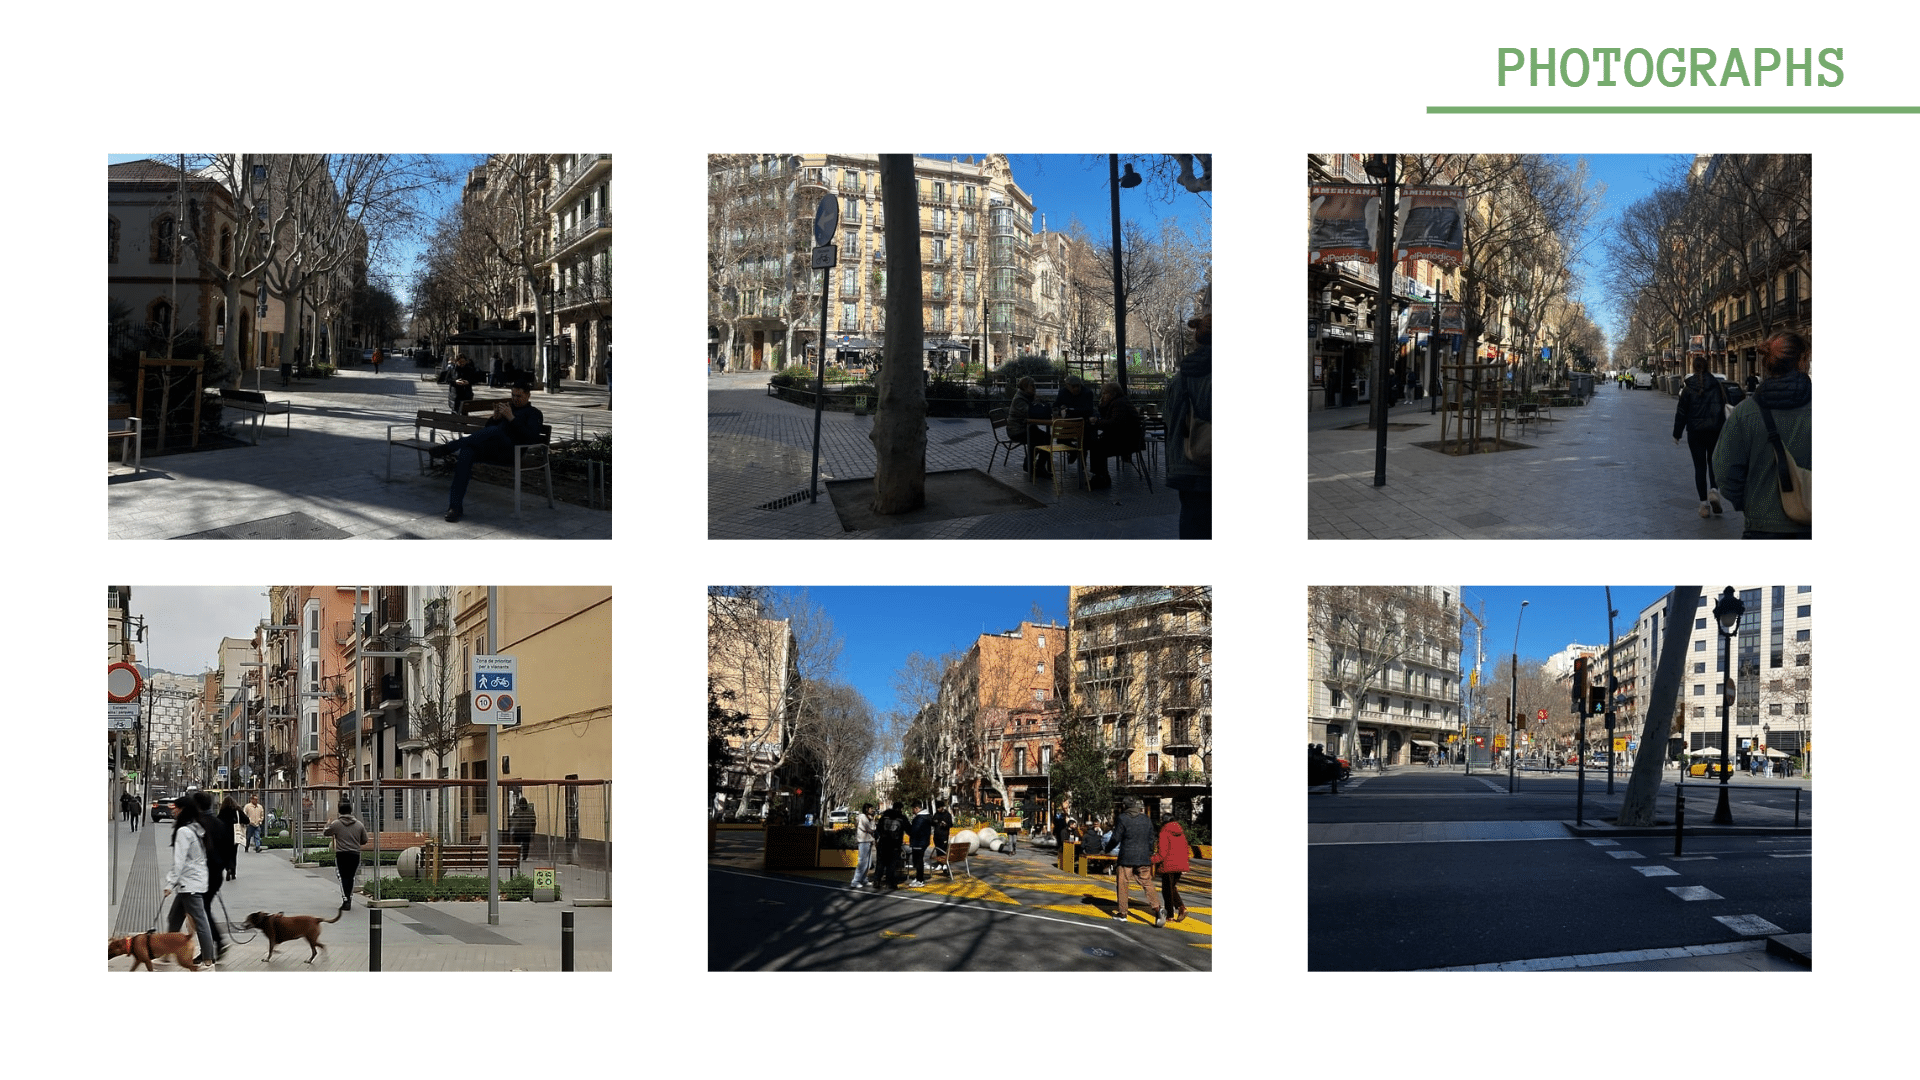
- Applying this Methodology in Person through Barcelona
- When it came to applying the exercise in person and exploring the superblocks of Barcelona, we made sure to capture images regarding mobility and accessibility that cannot be found through street view images imported from engines, to show that doing this work through AI might not always be accurate
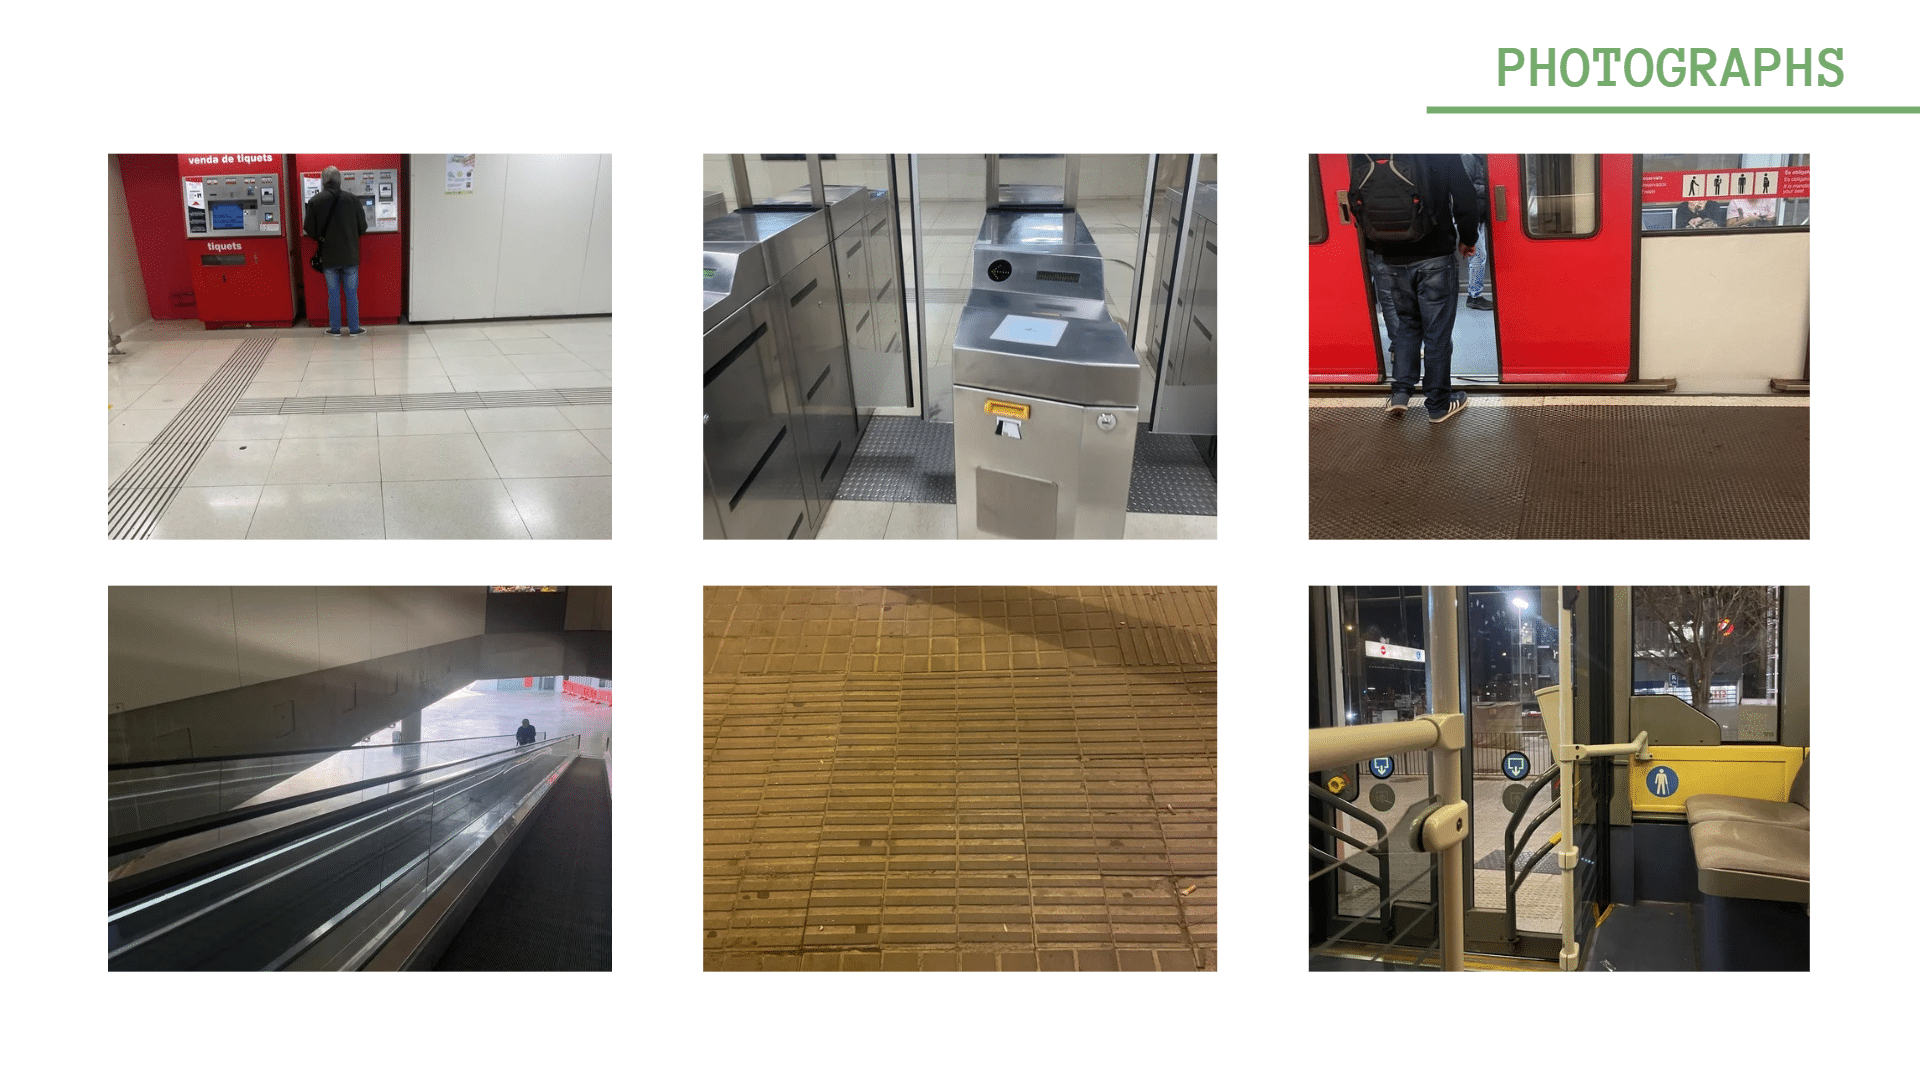
- Furthermore, we wanted to emphasize that transport, mobility and accessibility are not only related to public transport amenities but many more things, such as the availability of benches every 150 m to accommodate the elderly population, clear signage, designated pedestrians spaces etc.
- Conclusion:
- The exercises revealed that accessibility is most influenced by public transport, safety, availability and absence of physical barriers (Environments with clear paths, seated areas, good connectivity). In addition, multimodal connections and inclusive design can significantly improve urban accessibility.
- Some missing factors that would have significantly changed the rankings that we were not able to capture would be conditions such as temporality, weather and demographics.
