
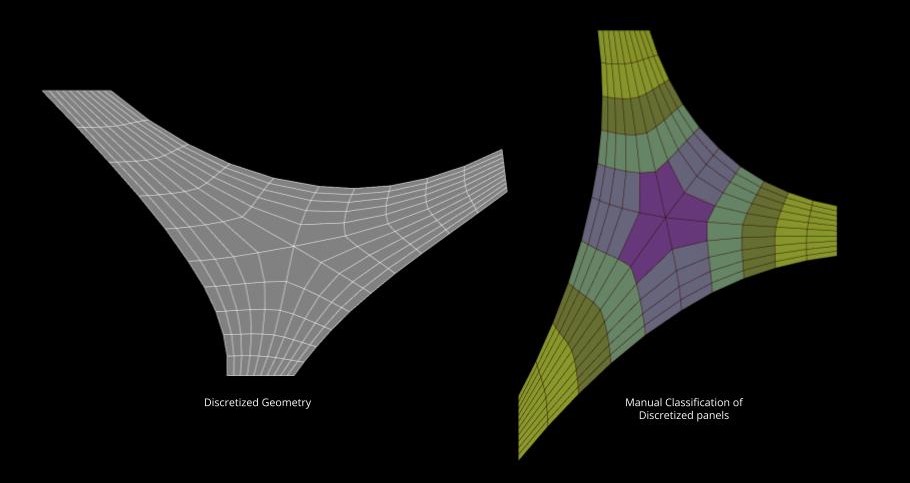
Our project involves the fabrication of a curved surface using cork panels that have been discretized into unique four-sided shapes. Our previous approach involved cutting each panel individually, but we aim to streamline the process by using machine learning to classify the panels into five distinct groups. We will then design and create a mold for each group that can accommodate all panels within that group, resulting in the ability to cut all panels from just five shapes.
Note: This exercise is done using a machine learning plugin for rhino & grasshopper called OWL.
Before training our neural network to generate the desired outcomes, we first tested the K-means clustering method’s classification capabilities. However, the results we obtained had visual inaccuracies. So we manually classified panels into five clusters based on size and shape, to start training the neural network.
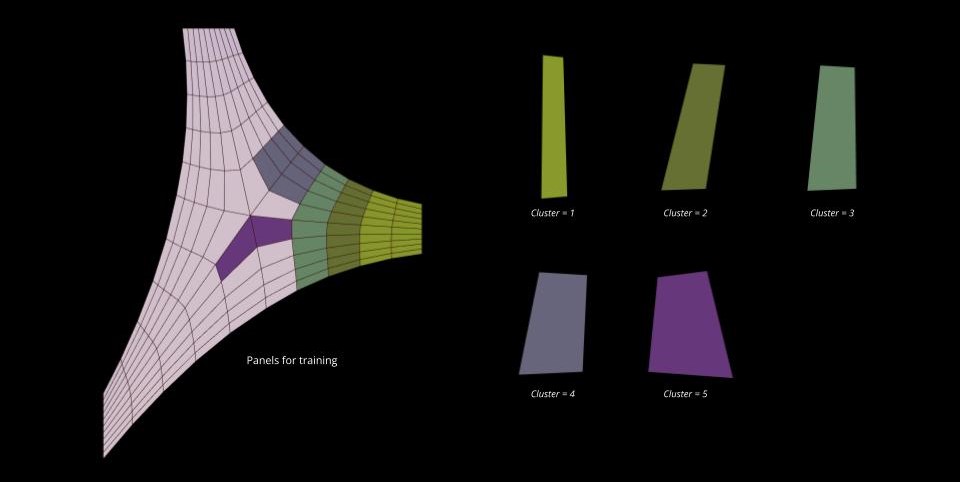
We selected a training set of 50 panels from the five clusters, out of a total of 150 panels. The image below displays the panels we used for the training set, along with a typical example of a panel from each cluster. The training methodology is explained further in this post.
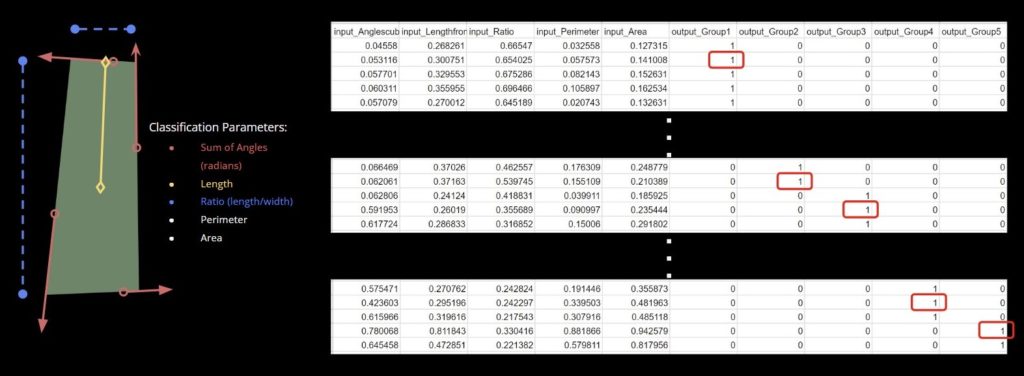
Our training data does not utilize images or meshes directly. Instead, we extracted numerical parameters and input them into a .csv file, which served as the data source for our neural network. The image below showcases the parameters we extracted from our panels – the sum of angles in radians, length from the center to the shortest side, ratio of length to width, perimeter, and area. It also displays the required format for structuring the data in the .csv file to obtain a classification output into the five clusters.
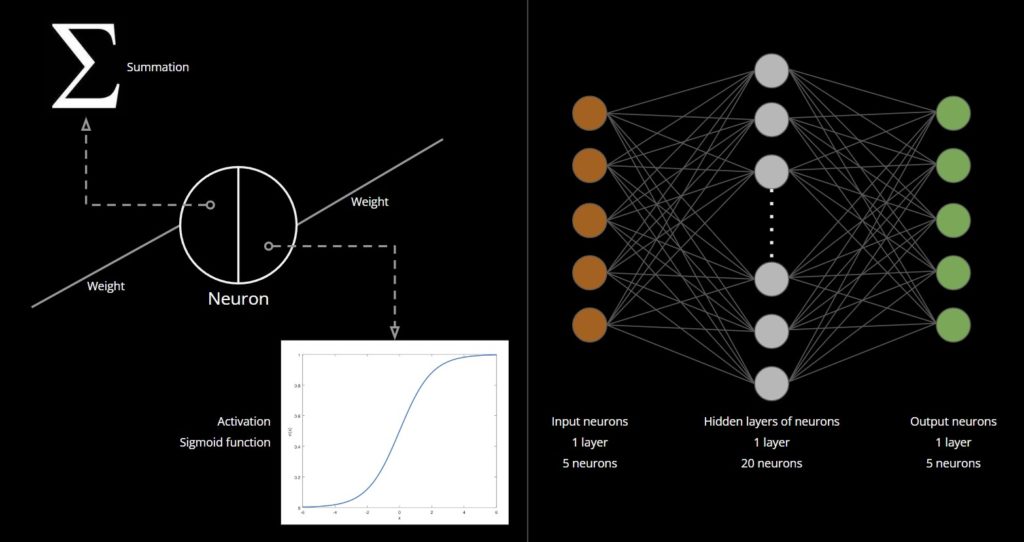
Before proceeding, it’s important to provide a brief explanation of a neural network’s structure. A neural network typically comprises layers of neurons, referred to as neural nodes. These layers fall into one of three categories: input layer (single), hidden layer (one or more), and output layer (single). Neurons from different layers are interconnected through assigned numbers, known as ‘weights’ or ‘parameters.’ As new data is fed into the neural network, these weights adjust, allowing the network to ‘learn’.
A neuron comprises two components: summation and activation. Summation involves adding up the weights multiplied by the feature vector. Activation functions are crucial in introducing nonlinearity to the neural network. Activation functions introduce nonlinearity to the network.
To produce desired results, a neural network must undergo training. We used backpropagation as the training method for our network. This technique involves propagating the error rate of a forward pass through the network and fine-tuning the weights by feeding this loss backward through the layers of the network.
Our neural network consists of 5 input neurons (representing the 5 parameters used for classification), a single hidden layer of 20 neurons, and 5 output neurons (to classify the panels into the 5 clusters). The activation function for the neurons in our network is the sigmoid function.
During the preparation of the training data, we grouped the data into tensor sets and added noise to increase the size of the training set and expand the range of input numbers. A larger training set leads to better results from the network. The image below shows three graphs representing the data: the first graph displays the input data, the second graph displays the input data with added noise, and the third graph displays the output data after 1000 iterations of training.
Neural networks, like humans, are subject to biases and can become confused by similar objects. The panels in our study are challenging to categorize accurately into five clusters based on their shape and size, as they can appear quite similar across different clusters. Manual classification was based on the assumption that panels in the center of the shape were larger and wider, gradually decreasing in size and thickness towards the arms. However, this logic did not always hold true, as there were instances of identical panels in adjacent clusters. Since the training data used is not completely accurate, it is expected that the output of the neural network will have errors resulting from these inaccuracies. Remarkably, the neural network was able to overcome these challenges through training and achieved a satisfying output.

The image above illustrates three classifications: one done manually, one by the neural network, and the last one by the K-means clustering method. It is worth noting that the neural network was able to overcome input errors and produce better results than the human visual classification.
