
Introduction
Grasshopper, renowned for its prowess in visualization, presents a unique landscape of opportunities for those eager to dive deep into the realm of geographical information. This blog post presents the start of my journey with Grasshopper, highlighting its potential as well as the challenges and learning curves it presents.
Objective: Gaining Confidence with Grasshopper
My primary aim was to harness the capabilities of Grasshopper for analysis and visualization. This meant not only mastering the tool but also understanding the logic behind its visual programming language. To achieve this, I had to start easy and so I decided to embarked on a project involving the metropolitan area of Cluj-Napoca.
Project Overview: Mapping Cluj-Napoca
The project involved two shape files:
The outline of municipalities in Cluj-Napoca.
All settlements within the same administrative area.
These files served as the foundation for my exploration with Grasshopper.
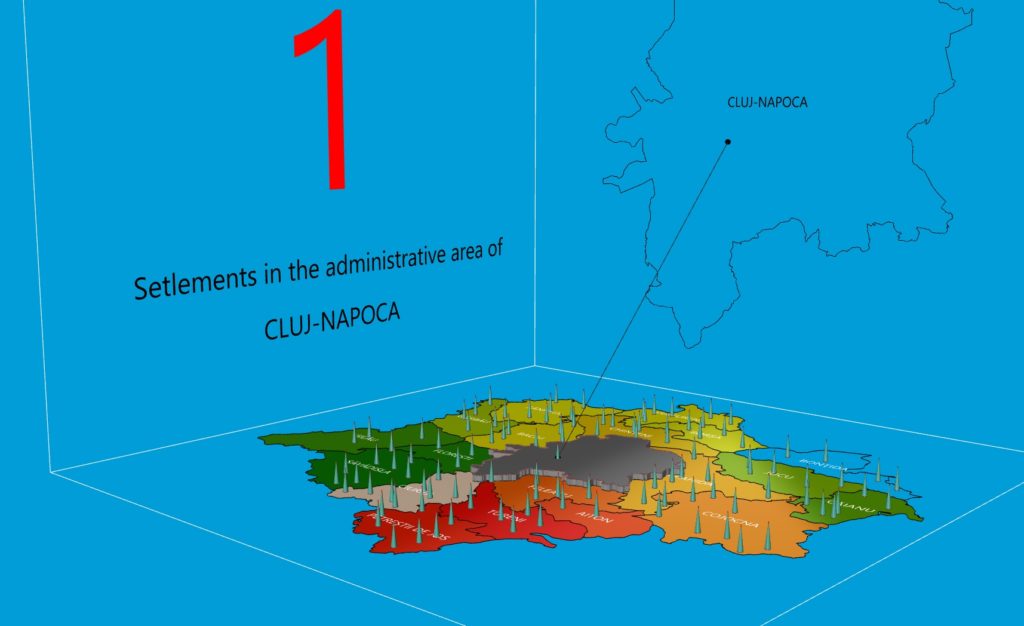
What the project does
The project has several features, each showcasing Grasshopper’s capabilities:
Visualizing Points of Interest: The map displays points of interest in a cone shape, enhancing clarity and visual appeal.
Counting and Coloring Administrative Areas: The algorithm counts points within each administrative area, assigning colors based on point density.
Extruding Based on Points: Administrative areas are extruded in proportion to the number of points, adding a three-dimensional aspect to the visualization.
Resizing and Repositioning: Each area is adjusted in size, with points repositioned to reflect these changes accurately.
Displaying Data: A separate plane presents information about the point count, offering a data summary.
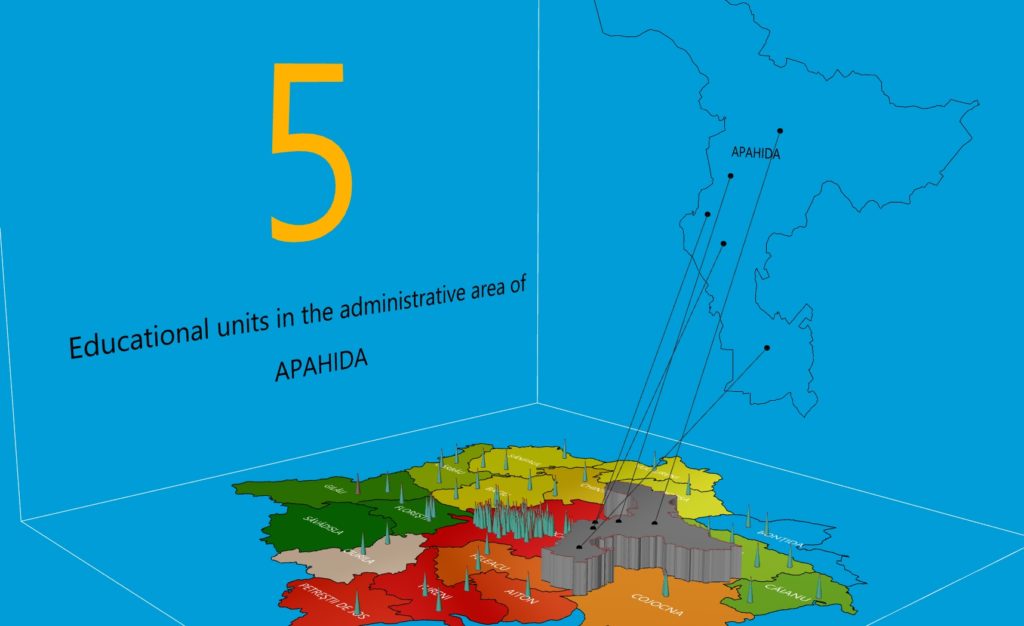
Versatility of Data Sources
An intriguing aspect of this project is its adaptability. While I focused on settlements, the same methodology can be applied to other data types, like parking spots or water fountains. The crucial element is the geographical coordinates in the shape file. For instance, because the project is generated parametrically, an analysis of educational units was easily done just by updating the shape file like in the example below.
Conclusion: Empowerment Through Visualization
This project with Grasshopper was not just about creating visualizations; it was a journey of empowerment. Understanding and utilizing Grasshopper gave me the confidence to undertake more complex projects from scratch. The experience was enlightening, rewarding, and a testament to the power of Grasshopper in transforming raw data into insightful visual narratives.
