Syllabus

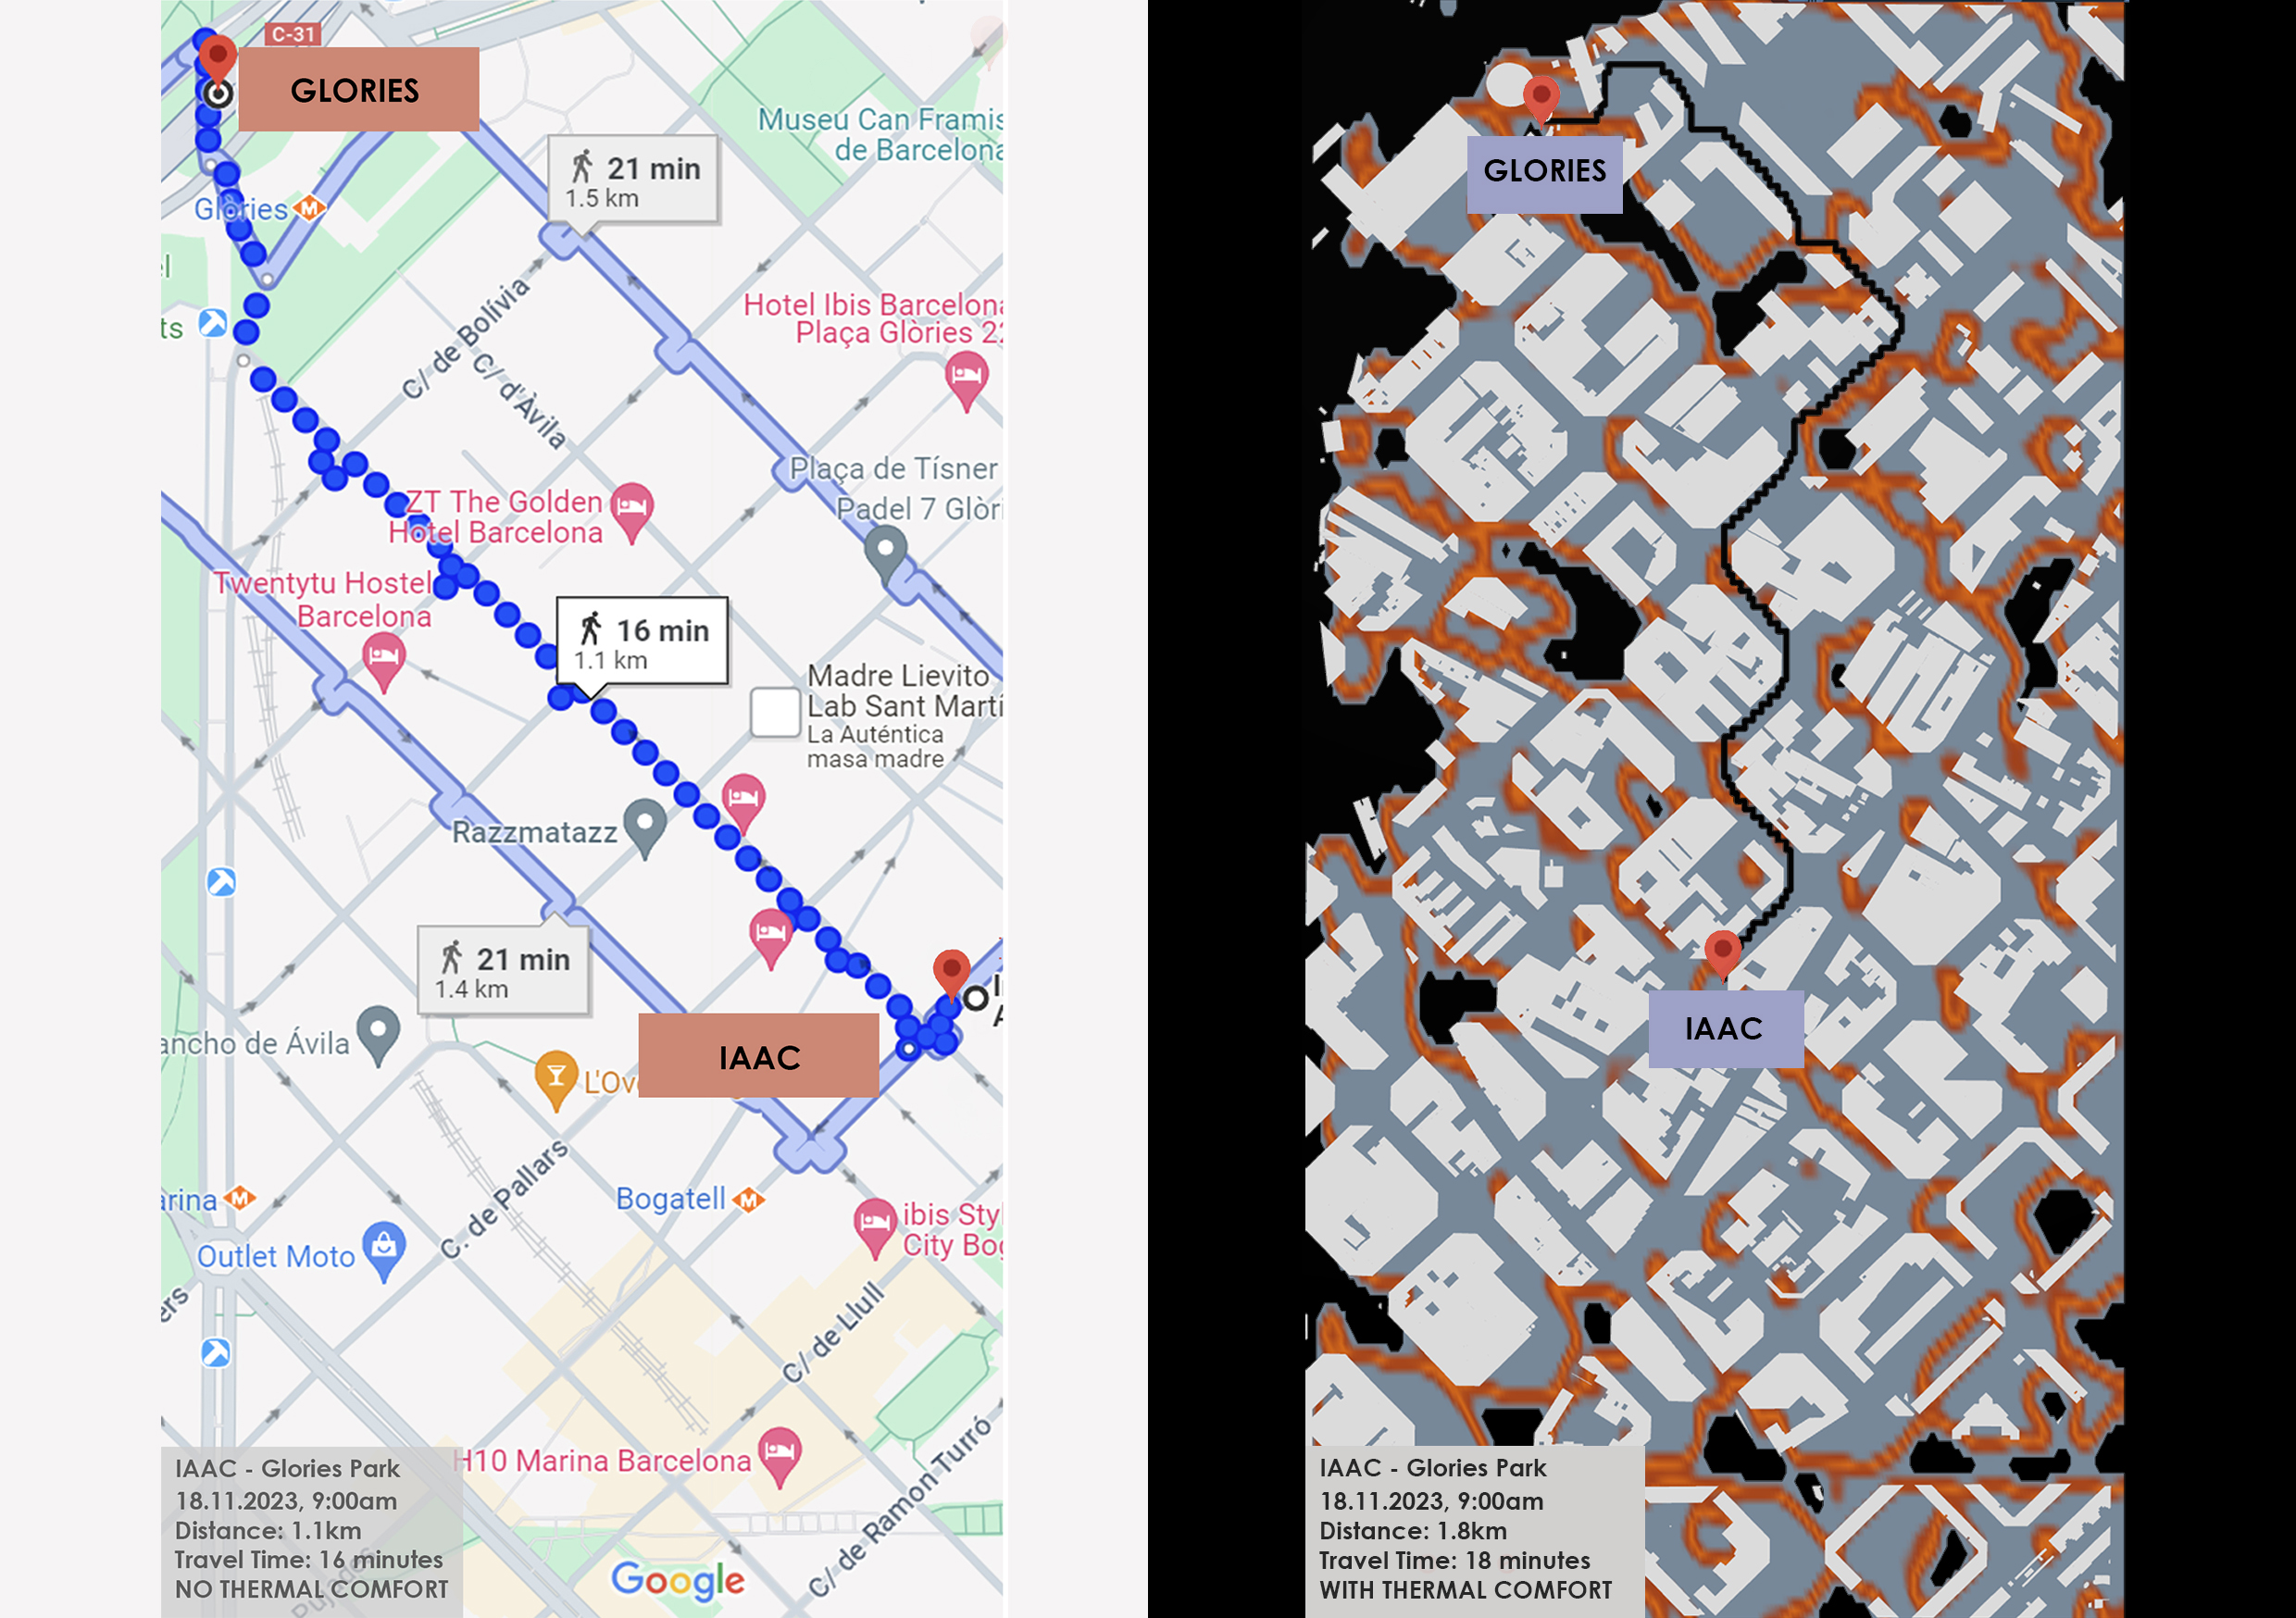
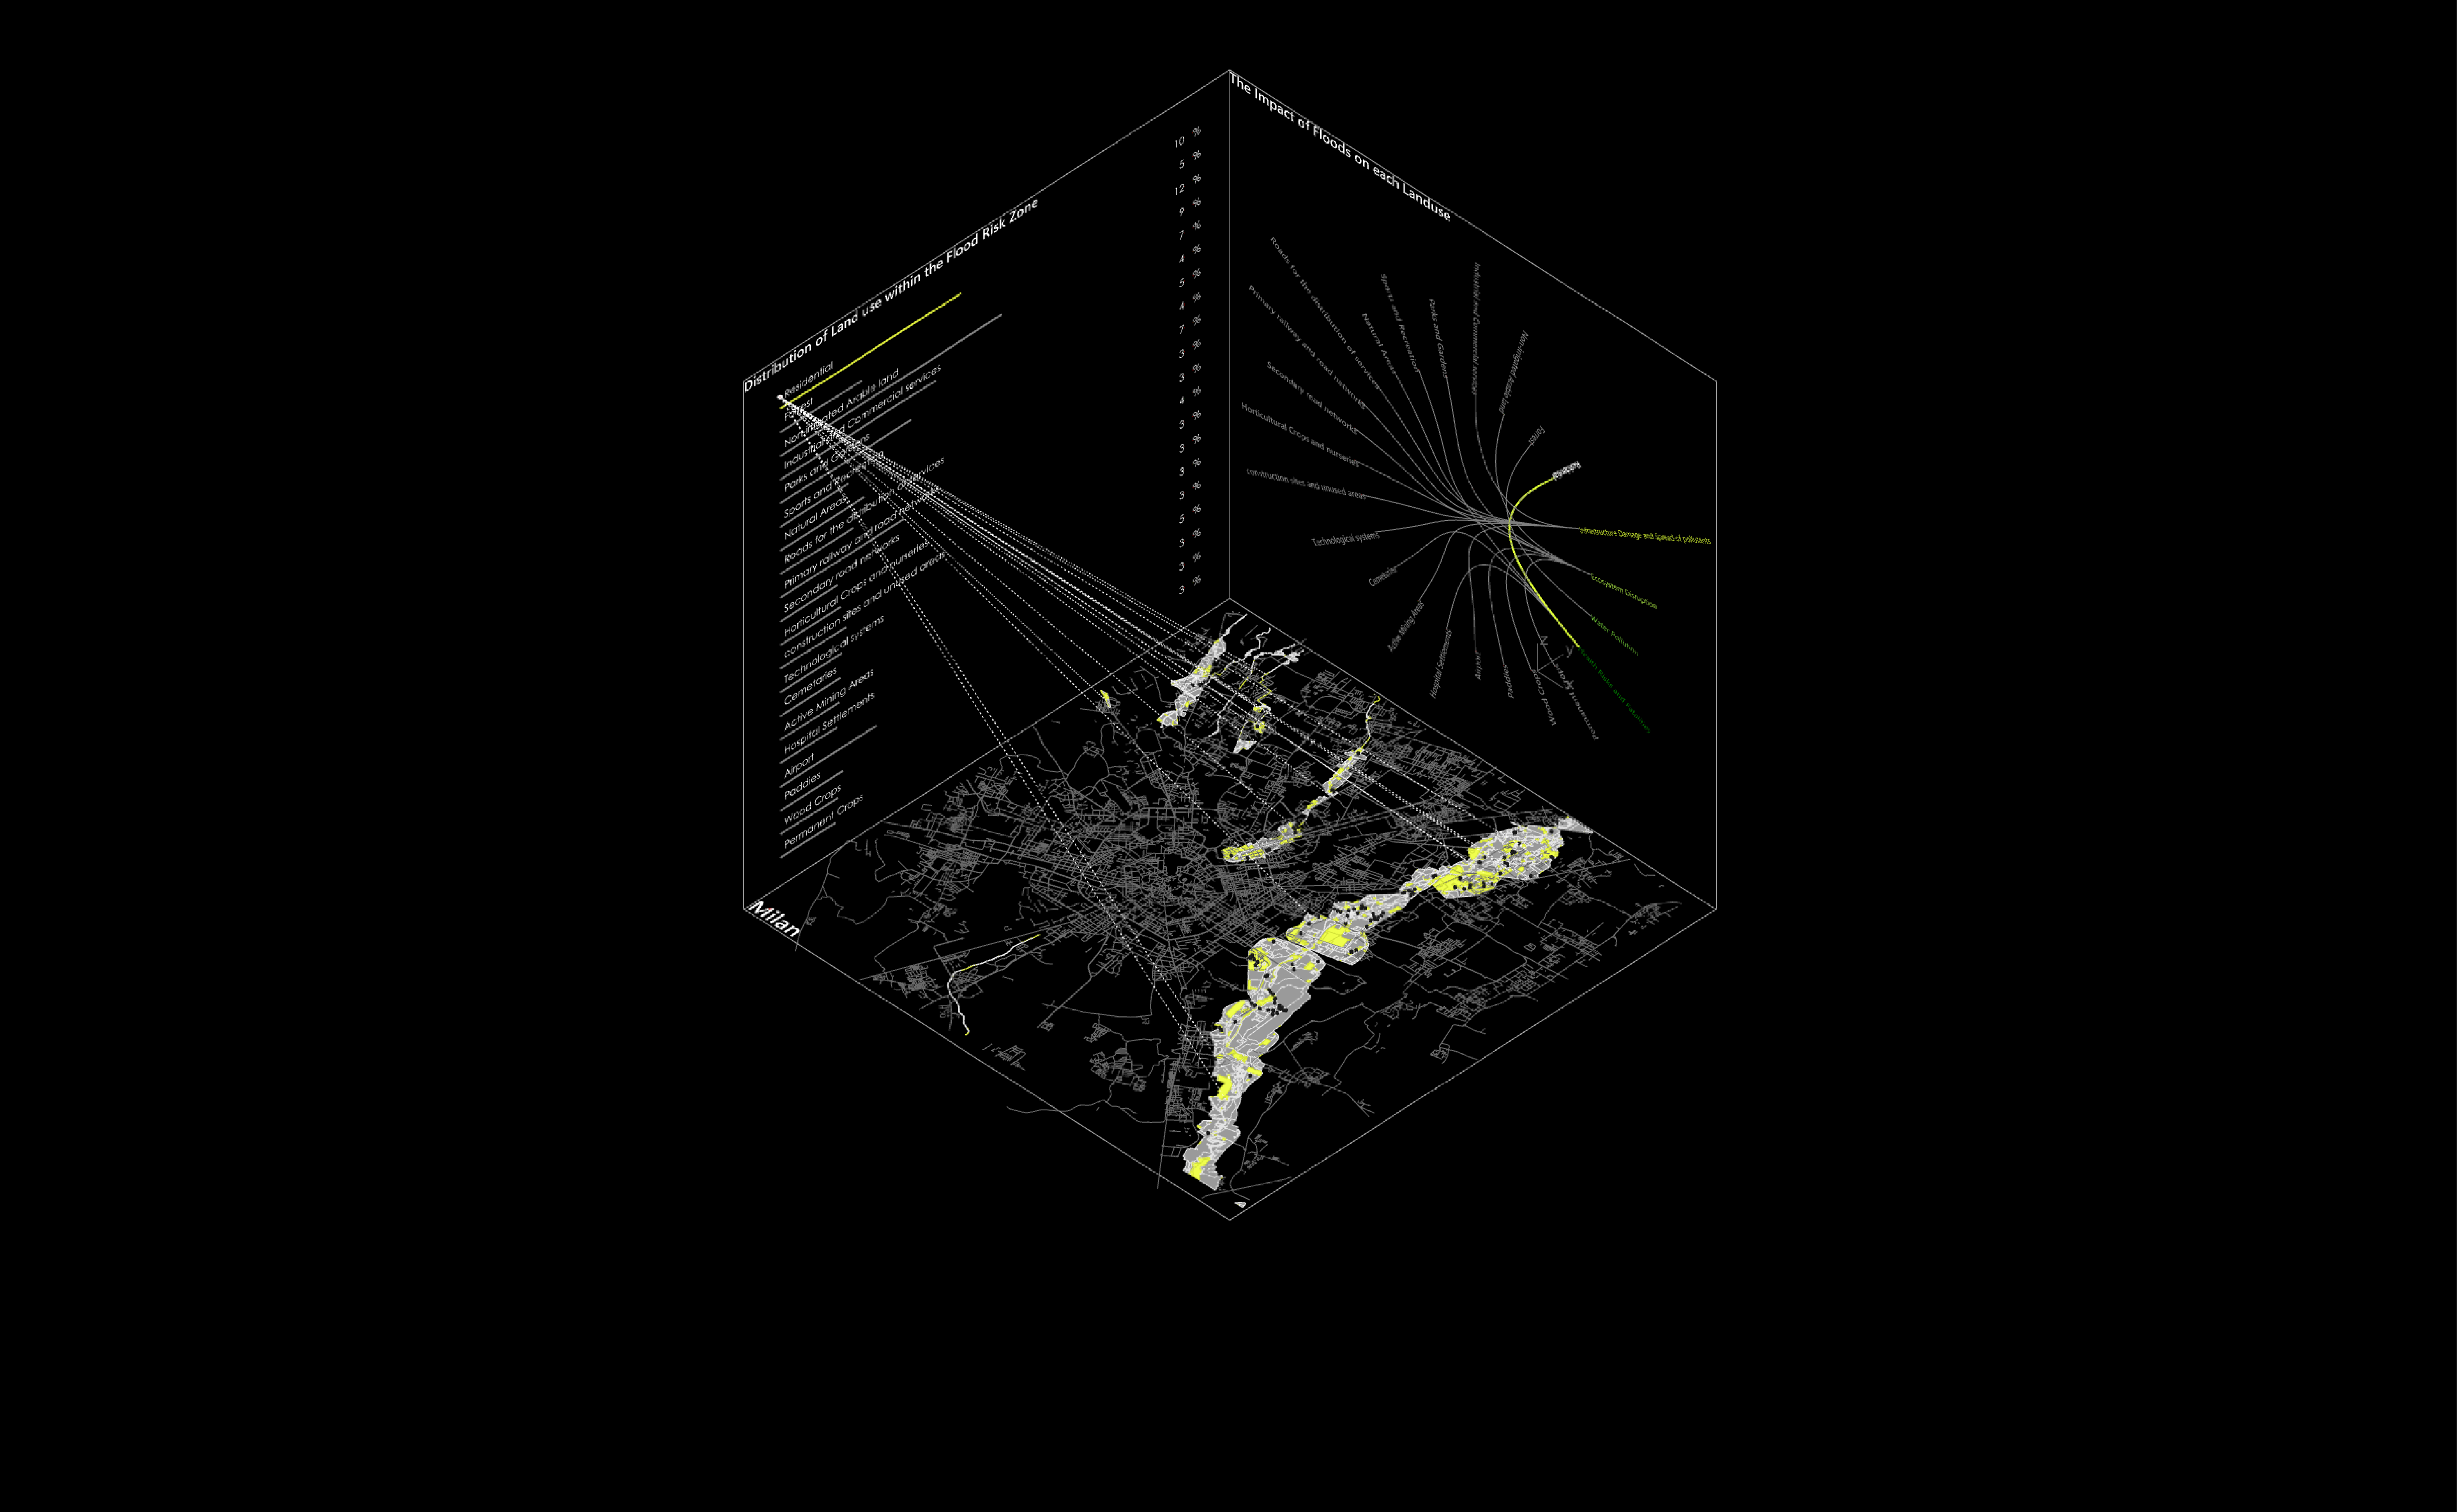
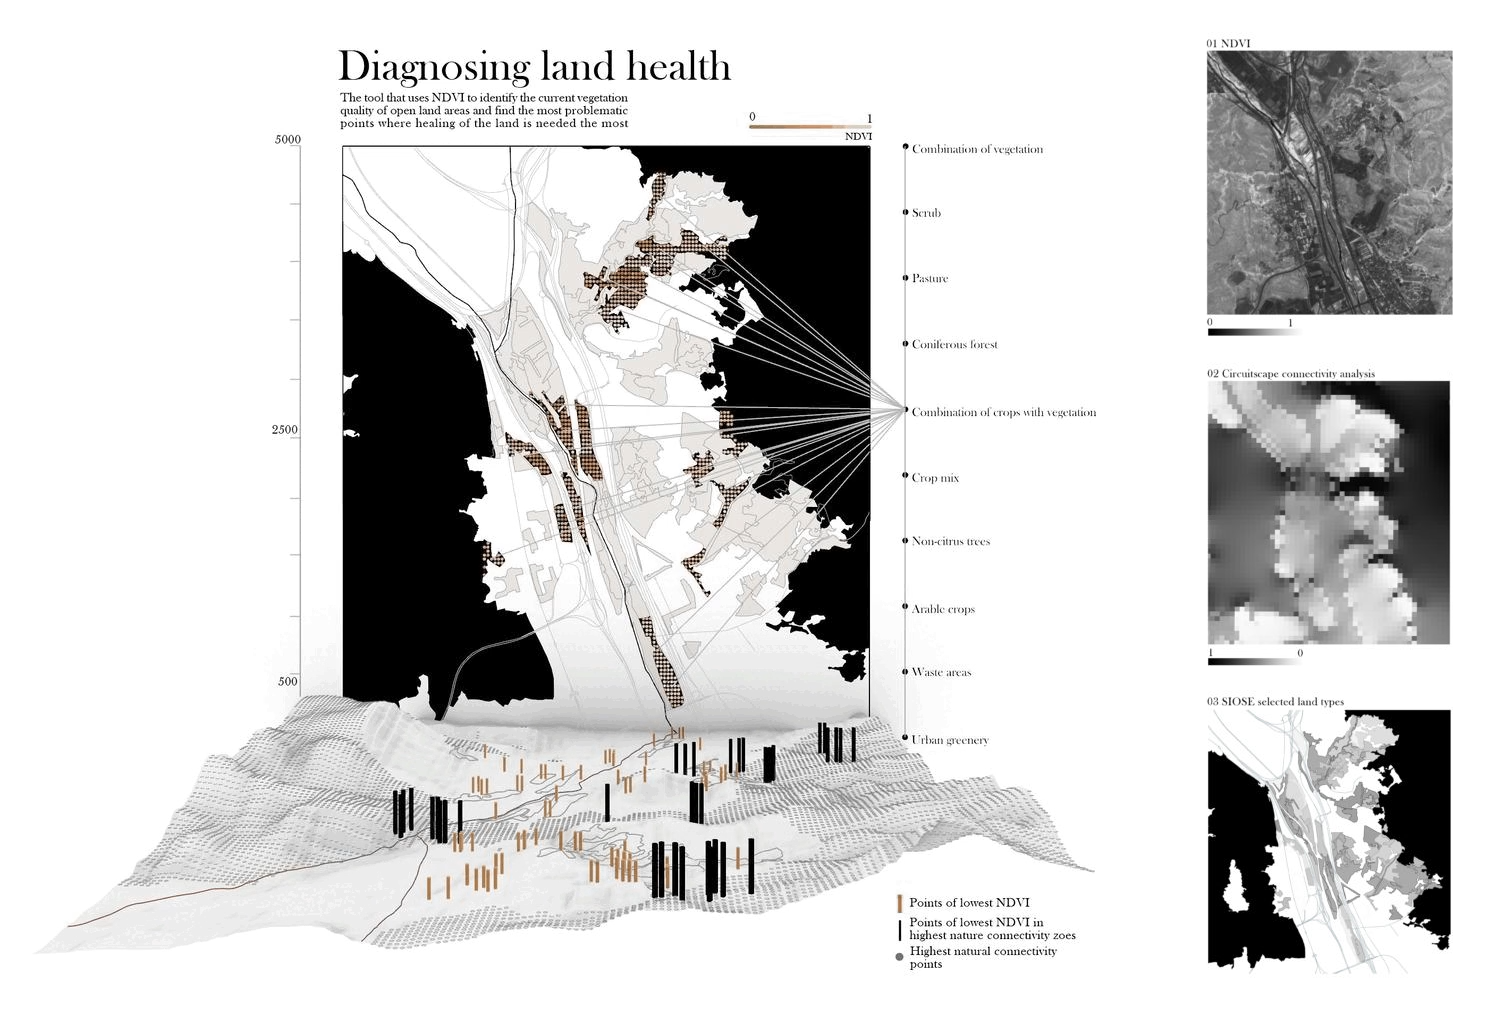
photo credits: Diagnosing land health  (IAAC project 2022-23) by R. Petravi?i?t?

Description

Aim of the Computational Urban Design course is to empower students with the capacity to fully understand and exploit computational thinking in order to design complex algorithmic pipelines from raw data to design.  

It exploits Grasshopper 3D as the main computational tool because of its intuitiveness, and its large use in the AEC and the planning field. Despite no prior knowledge of programming is required, throughout the course students will master advanced computational logics that will enhance their design workflows in accomplishing the challenges of this course, and of the future profession more in general.

After an initial introduction on the interface and the basics, the goal of the first part of the course is to establish a clear methodology to import and visualise data in Grasshopper. Participants will become familiar with the complexity of data-informed processes and will experience how simple computational logics can deeply alter the way in which they approach an urban project.

Consequently, the second part of the course will focus on the application of iterative computational processes to explore and create design solutions – and so – to process and create-by data. Participants will be challenged with a portfolio of advanced logics that they will independently analyse and explore in design exercises , achieving results that would remain inaccessible otherwise.

Lasty, the third section of the course will take advantage of the extensive availability of online machine learning models to investigate creative ways of using AI in design for future research directions. This part will comprise the creation and implementation of ad-hoc tools that will innovatively link design platforms and analytics to tackle urban challenges in innovative ways.


Learning Objectives

At course completion, the student will:

        fluently use Rhinoceros and Grasshopper 3D, 

        implements design solutions taking advantages of computational tools 

        manage and visualise complex geometries and data

        read and export data in various format

        integrate Grasshopper 3D with others software


Faculty


Projects from this course

Sprouting Habitats

Introduction The project “Sprouting Habitats” investigates the impact of ecological conservation sites, particularly in the context of waterbirds. As most living organisms on earth, birds heavily rely on water and its associated habitats, such as wetlands, to support crucial phases of their life cycle, including migration, breeding, and wintering. Unfortunately, human activities like intensive agriculture, … Read more

Exploring the Hydrography of the Besos River

Understanding Surface Water Dynamics : Analysing Besos River Runoff, Accumulation, and Water Levels. The Besos River, flowing through Catalonia, Spain, is a significant water body supporting both ecosystems and human activities. Its hydrology plays a pivotal role in the regional environment and socioeconomic landscape. The dynamics of surface water runoff, accumulation, and water levels in … Read more

Green Trails: Paving the Way for Comfortable Cycling

In the bustling streets of Barcelona, a city that effortlessly weaves together history, culture, and modernity, uncovering a comfortable path becomes a journey in itself. Navigating Barcelona isn’t just about finding the quickest route; it’s about immersing oneself in the rhythm of the city and embracing its unique character. Conclusion Barcelona’s enchanting cycling paths, seamlessly … Read more

Sunlit Streets, Shaded Paths

Computational Tools for Thermally Comfortable Walks in Barcelona On one of the sunniest days in the city of Barcelona, you want to go for a walk and get some fresh air but the heat from the sun makes you uncomfortable. Can you go for the walk without the sun making you completely sick? The objective … Read more

FloodZone Analytics

Introduction Water-related disasters, such as floods and droughts, have become increasingly frequent and severe due to climate change, representing significant global challenges. Urbanization and land use changes are contributing factors, with settlements in high flood-risk areas growing. In studying Milan and the Lambro river basin in Northern Italy, we observe increasing frequencies of floods, highlighting … Read more

EndSARS in Brief: A Snapshot of the Movement

This project aimed to visually narrate the EndSars protest movement that unfolded in Nigeria from October 8th to 20th, 2020. This movement emerged as a powerful response to the acts of violence perpetrated by the Special Anti-Robbery Squad, a specialized unit of the Nigerian Police Force established in 1992 to combat crime (Amnesty International, 2020). … Read more

Travelling Paris

Paris, often hailed as the world’s most popular tourist destination, beckons millions of visitors each year with its unparalleled blend of history, culture, gastronomy, and romance. At its heart stands the iconic Eiffel Tower, symbolizing the city’s architectural finesse and innovative spirit. The Louvre Museum, home to countless masterpieces, invites art aficionados to meander through … Read more

Mapping Airbnb data in San Francisco

Since its launch in 2007, Airbnb has revolutionized the hosting industry: By providing a simple and intuitive online platform, it connects millions of hosts and visitors worldwide. Born in The Bay, the app has changed the dynamics of the whole area, impacting sectors that extend from tourism to the housing market. Through the analysis of … Read more

Understanding the City through Data, Maps & Code

Finding the ratio of natural Green spaces to the Educational institutions in Barcelona city, Spain. TOOLS USED INTRODUCTION Barcelona, like many modern cities, has been actively working on providing open datasets to the public. Open datasets are valuable resources that foster transparency, innovation, and engagement within communities. Barcelona’s open datasets cover a wide range of topics, including urban … Read more

Worldwide cityscapes spatial analysis using OpenStreetMap Data

Introduction OpenStreetMap (OSM) stands as a testament to the power of collaborative mapping, where a community of volunteers comes together to create a detailed and constantly updated geographic database. This free and open resource is not just a map; it’s a versatile tool used for everything from navigation and humanitarian aid to data visualization. OpenStreetMap … Read more

Roving the Red Planet

Roving the Red Planet - Animated Infographic

A rich and ongoing history… Mars exploration missions started in the second half of the 20th century, with the first successful one being NASA’s flyby mission Mariner-Mars in 1964. Since then there has been a steady influx of many other missions throughout the years, from NASA as well as from other space agencies from around … Read more

Promised Land

Mesh representation of MIDI

Mapping America’s Genrescape Promised Land, Chuck Berry’s early representation of modern rock and roll, blurs racialized difference in genre origin, fueling the hybridization of genre categorizes, resulting in America’s current rich music tapestry. MIDI data correlated to synaesthetic representations of color is crystalized and in a dense three-dimensional mesh and place qualities are correlated to … Read more

Counting and displaying geographical information

Introduction Grasshopper, renowned for its prowess in visualization, presents a unique landscape of opportunities for those eager to dive deep into the realm of geographical information. This blog post presents the start of my journey with Grasshopper, highlighting its potential as well as the challenges and learning curves it presents. Objective: Gaining Confidence with Grasshopper … Read more

Cities in Motion

Bogota Public Transport from GTFS

The General Transit Feed Specification (GTFS) is a standardized format designed for the distribution of public transport information globally. This format facilitates the integration of public transportation systems in cities worldwide with popular route planning platforms like Citymapper, Waze, or Moovit. By doing so, it enables users to access information on transport availability and plan … Read more

Can inequality of opportunity be mapped?

An exercise in visually corelating data. Introduction The Swedish educational system is based on merit. Students have to compete for places by means of their average grades. The competition is fierce, especially in large cities such as Stockholm. This project forms an attempt to showcase a possible correlation between the median acceptance grades of schools … Read more