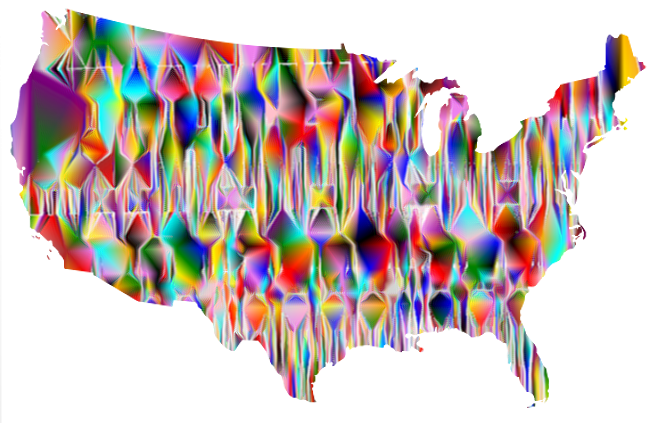
Mapping America’s Genrescape
Promised Land, Chuck Berry’s early representation of modern rock and roll, blurs racialized difference in genre origin, fueling the hybridization of genre categorizes, resulting in America’s current rich music tapestry. MIDI data correlated to synaesthetic representations of color is crystalized and in a dense three-dimensional mesh and place qualities are correlated to genre category to depict the conditions that bred the sound qualities that define America’s interwoven music history.
Methodology
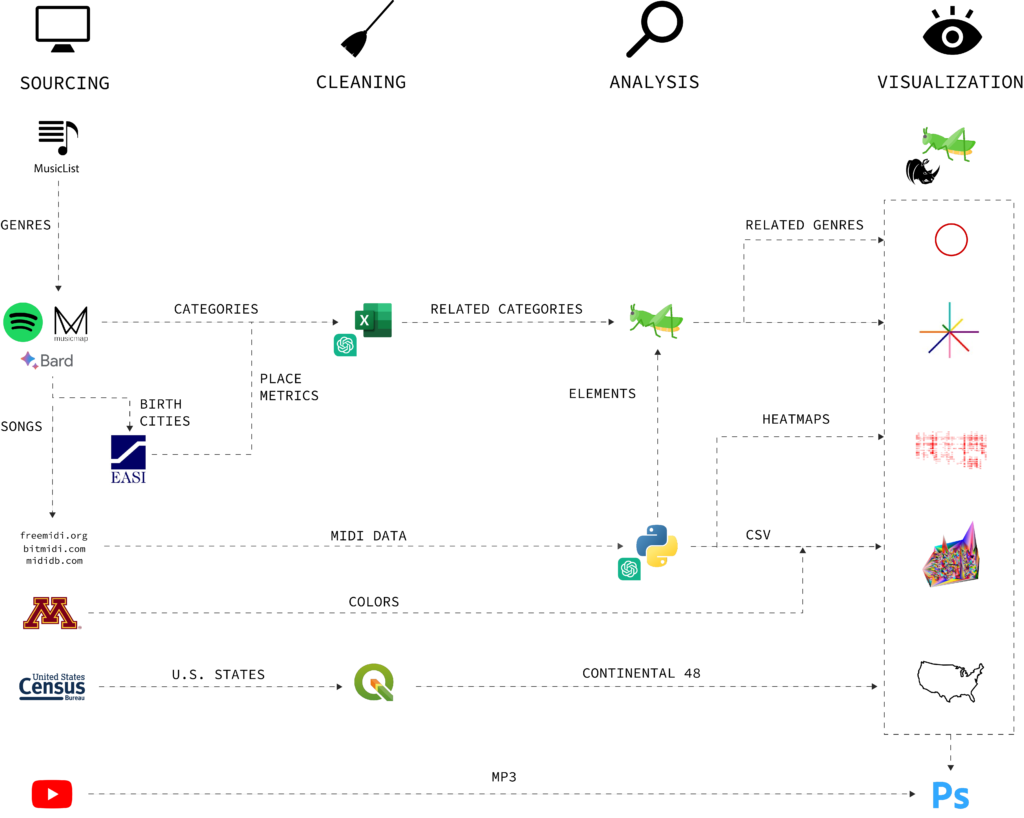
Sourcing
Genres sourced from desktop research (1, 2, 3) were verified by Spotify, MusicMap, and Bard.ai for popularity and American origins to locate 155 distinct genres then were related to:
- Category, defined the grouping for song data analysis, grouped into 8 emblematic categories of American Music: Roots, Jazz, Folk, Country, Hip Hop/Rap, Rock, Pop, and Electronic.
- Birth City, the origin place of the genre, defined the geographic relevance of music to place, with cities like New Orleans producing a wealth of Jazz and Roots genres Los Angeles home to hip hop/rap, rock, and pop, and Chicago building depth in electronic.
- Song, the emblem of each genre, was elected subject to MIDI data availability, to understand music qualities related to place.
Genre categorization is obscured by temporal difference in tempo and hybridization of “home” genre. Tempo clouds correlation among pop genres while hybridization of folk, roots, and jazz among the 58 inventoried rock genes blur its categorical distinction.
Coloration is tied to binned synaesthetic correlations with the 12-note musical scale beginning with 21, A0, and culminating with 108, C8, corresponding to the 88 keys on a standard piano. The cross-modal relationship adds complexity music perception and visual representation under the presupposed associative influences. Recent studies have revealed non-random associations between timbre and color/hue in non-synaesthetic individuals, showcasing consistent color-timbre mappings. (1, 2)
Genre-based coloration is first based on mode note value of inventoried song data, then adjusted by the HSV value parameter for visual clarity and appeal. Genres with common key mode notes, such as Roots and Blues and Country and Pop, were assigned the next most common note value.

Place-based qualities of birth cities were sourced from EASI, Easy Analytic Software, Inc, a proprietary producer of quality of life metrics index from the Survey of the American Consumer to condense demographic characteristics, consumer spending, and behavior patterns.
Chat GPT, Bard, and Excel were jointly leveraged for data summarization, casting, and cleaning.
Analysis to Visualization
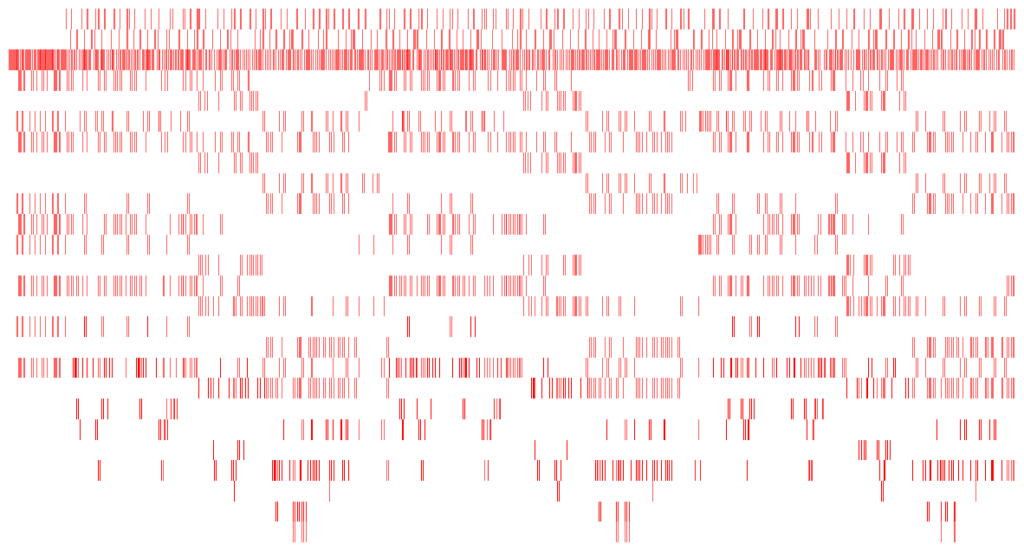
The 2D Song
What can MIDI visually communicate?
MIDI, or Musical Instrument Digital Interface, is a protocol that enables electronic devices, such as computers, synthesizers, and musical instruments, to communicate and control each other’s musical elements. MIDI data consists of note information, volume control, and timing details, creating a versatile language for musical expression. MIDI standardized communication between musical devices, facilitating the creation, playback, and manipulation of electronic music.
- Note, or pitch, ranges from 0 to 127 where 60 represents Middle C and values register between 21, A0, and 108, C8.
- Velocity, both intensity and volume, ranges from 0 to 127.
- Time, is measured as the distance between the last and current note.
Python’s mido package supports the creation, manipulation, and interpretation of MIDI for musical composition and conversion. Heatmaps plotting note value against time weighed by velocity and CSVs registering note, velocity, and time were identified agile methods to plot and convert MIDI for manipulation.
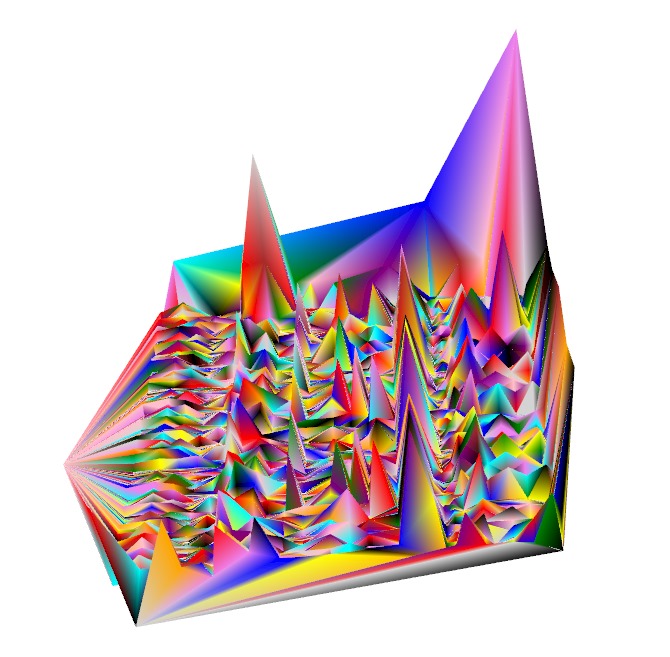
The 3D Song
Grasshopper allows for the manipulation of direct (1), or, here, converted MIDI data. Note values, velocity, and time, were converted to a three-dimensional mesh using a pull-point system. The height of each point on the mesh is influenced by the reversed normalized distance to its nearest neighbor in the XY 2D coordinate space. This process effectively creates a mesh structure that visually reflects the density of MIDI data, with points pulled higher where neighboring points are closer, providing a spatial representation of the musical composition’s intricacies and note density over time.
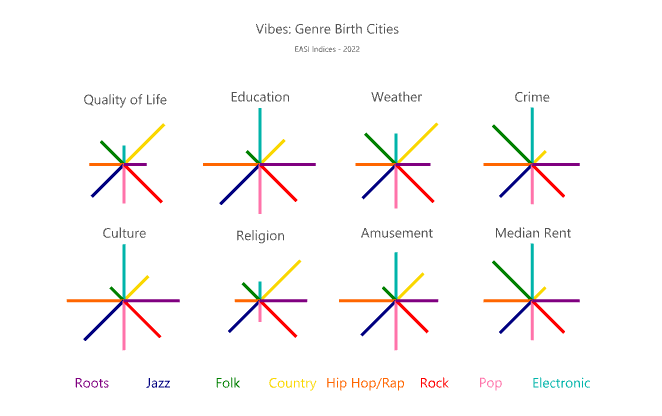
Quality of Place Vectors
Correlations between music genre categories and urban conditions provide a nuanced understanding of the intricate relationships that define each genre’s birthplace.
- Country, deeply rooted in rural landscapes and Southern American tradition, developed in places with rural concentrations, low crime rates, and low rent. Current high quality of life metrics may relate to the development of a music-centric culture in genre birth places such as Nashville, TN and Austin, TX which skew upward the category urban concentration and median rent indices.
- Electronic thrives in urban settings, where high urban populations coincide with high current crime rates, culture, education, and median rent; and with low quality of life, poor weather, and insignificant religious ties. A historical lookback may be of future research interest to uncover how the expression of genre may be indicative quality of life conditions.
- Hip Hop/Rap emerged in urban geographies with high quality of life metrics coupled with high crime and religion. EASI does not account for disparity in access to such education, culture, and amusement. Further research leveraging inequality metrics may indicate genre rather emerges in spaces of cultural difference.
- Similarly, Pop genres founded in the 1980s with African-American roots; Detroit Sound, Minneapolis Sound, and Miami Bass; shone bright lights on crime ridden towns with pasts of race-based discrimination.
Animation
No visual music history compilation is complete without complementary sound reference.
In 1991, the confused Gordon Gano of the Violent Femmes probed:
Can I, can I put in something like
“This is American Music”, take one?
One, two, three, four
Do you like American music?
and resolved his confusion by minute 2:45 with:
(We like all kinds of music)
Gano’s probe and mystery of the landing image, the Promised Land, are answered by animated movement along the categorical genre spectrum from roots to electronic, akin to adjusting an FM radio station, tying genre to its emblematic sound, color, and places of origin.
Future research on music-based histories and impacts may rely on cross-modal data to harmonize the feedback loop among qualities of place and its produced music. Future representations of color-sound correlations may embrace the dynamism of different material qualities.