
An exercise in visually corelating data.
Introduction
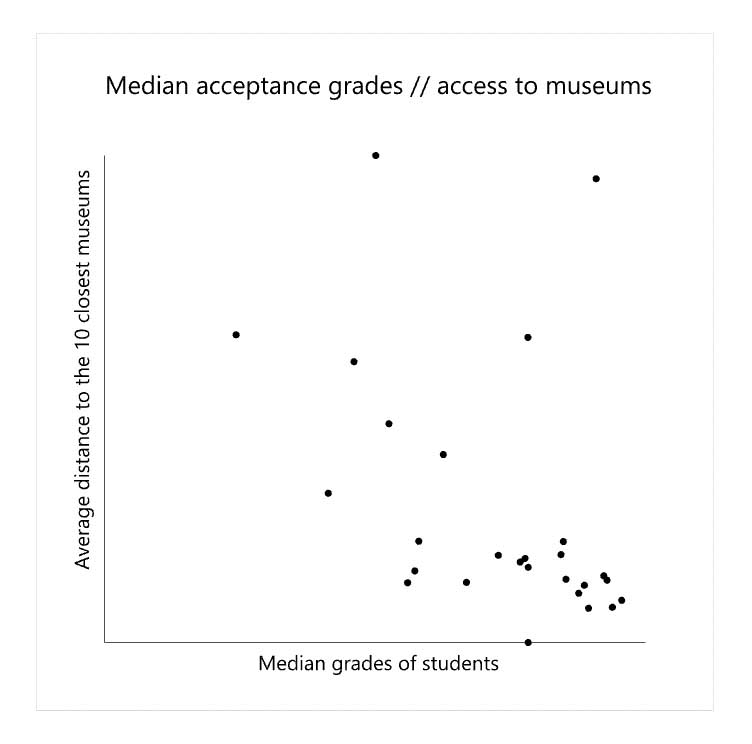
The Swedish educational system is based on merit. Students have to compete for places by means of their average grades. The competition is fierce, especially in large cities such as Stockholm. This project forms an attempt to showcase a possible correlation between the median acceptance grades of schools and their access to museums in the city of Stockholm. Though this analysis by no means gives a complete or definitive depiction of the implications of school allocation, it does shed some light on the access that some learning environments have to public institutions compared to others. With the exception of some outliers, a rough linear trend between the two measurements is perceivable.
Computational methodology
During the production of the visualisation, a number of challenges appeared. Firstly, it became apparent that the city of Stockholm is located on an intersection of two systems of projection, which results in a distorted projection of geodata. This was corrected using a translation and skewing the points in one of the projections. A second challenge presented itself by the fact that there is no geodata available that shows the median acceptance grades of schools. A large section of the code was therefore dedicated to coupling a non-spatial dataset containing this information to a spatial dataset containing the locations of the schools. The final challenge consisted of visualising the data in a meaningful way. Unfortunately, there was no access to road network file of sufficient quality to allow analysis of shortest paths between the schools and the museums. The solution therefore became to simply showcase a radius around each school.
