
Since its launch in 2007, Airbnb has revolutionized the hosting industry: By providing a simple and intuitive online platform, it connects millions of hosts and visitors worldwide1. Born in The Bay, the app has changed the dynamics of the whole area, impacting sectors that extend from tourism to the housing market.
Through the analysis of georeferenced data, this Project aims to display how the Airbnb accommodations distribute through San Francisco and how their prices behave according to the neighborhood they’re located in.
Methodology
- Gathering information:
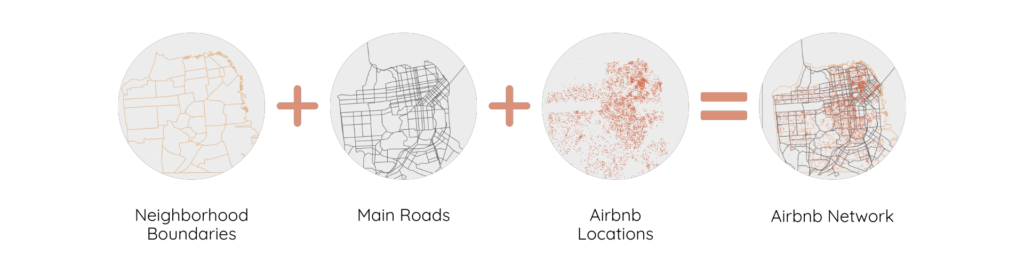
Shapefiles for the Neighborhood boundaries and main roads of San Francisco were obtained from UC Berkeley’s Geodata Library2; the Airbnb listing CSV was obtained from Inside Airbnb3. These datasets were processed in QGIS and imported into Grasshopper, where the information was combined.
- Grouping and processing the data:

The boundary geometry was used to group the points by neighborhood. For each group, the attribute information from the listings was used to calculate the percentage of accommodation sites respecting to the total, density, maximum and average prices.
- Displaying the data:

In order to demonstrate the dynamics of Airbnbs throughout the city, a cylindrical bar representing its price was mapped on top of each accommodation. This allows to see both the concentration of points and the locations where their cost varies the most.
Finally, for every group (neighborhood), a percentage bar is displayed as well as its max price compared to the maximum in the city.
Results
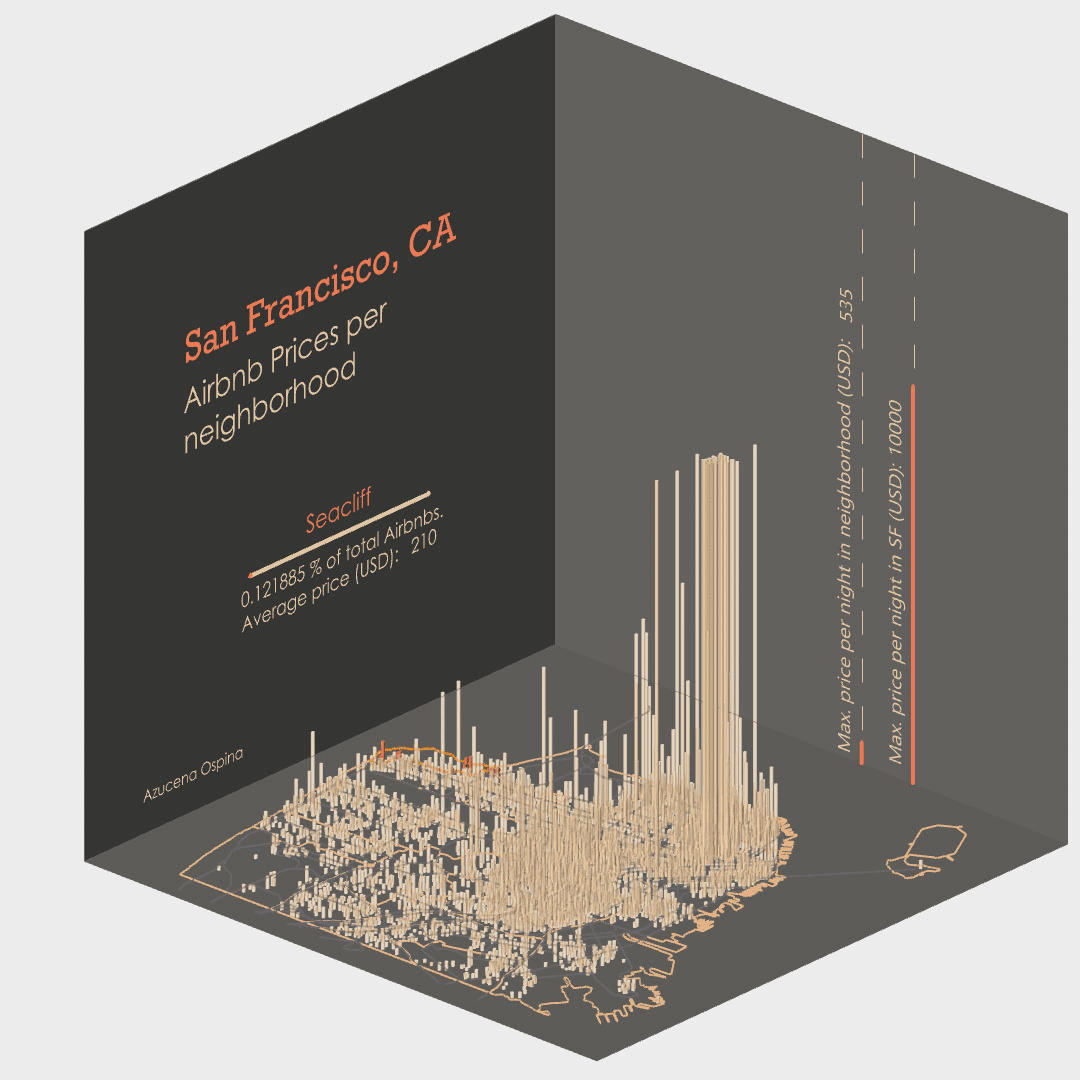
According to the result, the maximum concentration of Airbnb accommodations is located on The Bay side of San Francisco (right side of the cube), rather than the West Coast (left side of the cube). This corresponds to areas that are close to main city attractions and commercial areas like Market Street, Port of SF, Lombard Street, the presence of Victorian Architecture (Queen-Anne Style houses) and access to public transportation (BART and MUNI lines). Meanwhile, residential areas like Lakeshore and Inner Richmond and have both lower prices and a lower density in accommodations.
Although this Project was limited to the analysis of only one factor within the city, studying the distribution of amenities, behaviors and rising technologies is crucial for identifying risk patterns related to house security, inequality, changes within the house market, and phenomena like gentrification; and could help prevent and mitigate impacts within the urban context.
References:
- Airbnb (2023) About Airbnb: What it is and how it works. Obtained from: About Airbnb: What it is and how it works – Airbnb Help Center ↩︎
- University of California – Berkeley. GeoData Repository. Earth Sciences & Map Library. Obtained from: UC Berkeley GeoData Repository ↩︎
- Inside Airbnb. (2023) San Francisco, California, United States. Obtained from: Inside Airbnb: Get the Data ↩︎
