
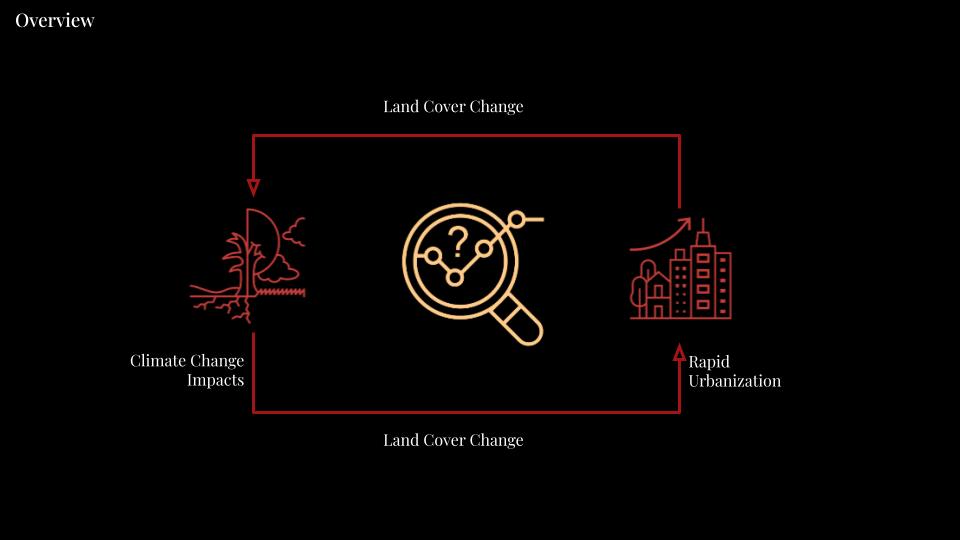
OVERVIEW
Rapid urbanization and agricultural intensification have led to extensive land cover change, with urban areas expanding and natural landscapes transforming into fragmented environments. These changes generate climate change impacts, affecting urban areas, and creating a cyclical relationship. Advancements in remote sensing are crucial for comprehensively assessing and monitoring the impact of rapid urbanization, agricultural intensification, and climate change on land cover, enabling informed decision-making for sustainable land management.
PROBLEM STATEMENT
However, the current remote sensing techniques have limited scope in capturing and quantifying the complex interactions between environmental and anthropogenic factors.
Existing methods often rely on visual representations, such as timelapse comparing change over time or slider-based comparisons between two dates, which fail to provide precise quantitative measurements of the changes occurring. This limitation hampers our ability to understand the scale and magnitude of environmental transformations, hindering effective decision-making and policy formulation.
SOLUTION
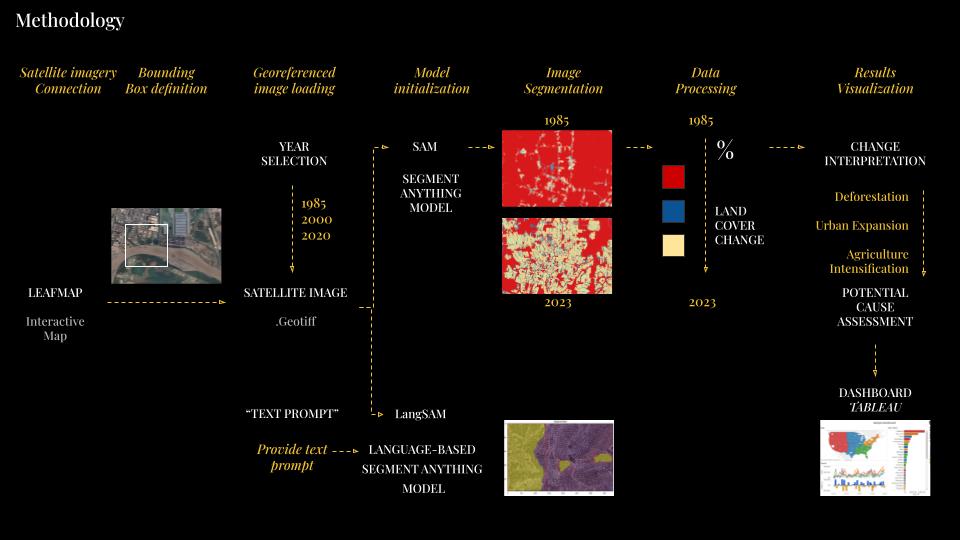
EcoVision.ai is an AI tool that employs the Segment Anything Model (SAM) to quantify, track, and analyze deforestation, urban expansion, and climate change implications. By leveraging SAM, the tool can accurately identify and delineate objects and features within imagery or data related to these environmental challenges. It provides policymakers and researchers with valuable insights, including quantitative measurements of deforested areas, tracking of changes over time, analysis of climate change implications, and data-driven recommendations. EcoVision.ai aims to support decision-making and action-taking by providing actionable information to address deforestation, urban expansion, and climate change effectively.
METHODOLOGY
TARGET USERS
EcoVision.ai provides valuable data-driven insights for researchers, planners, and policymakers. Researchers can utilize its quantitative measurements and comparative analysis capabilities to conduct evidence-based studies on land cover changes. Planners can leverage EcoVision.ai to evaluate the impact of urban development on the environment, aiding in decision-making for land use and development policies. Policymakers can benefit from EcoVision.ai’s comprehensive analysis to inform their environmental policies and strategies.
PROCESS | Interactive Map Setting
Leafmap is a powerful Python library that provides interactive mapping capabilities for geospatial analysis and visualization. It allows users to create interactive maps, perform spatial data analysis, and display various layers of geospatial information. An interactive map is a dynamic and user-friendly representation of spatial data where users can interact with the map elements, zoom in/out, pan, and click on features to access additional information. In the context of leafmap, a bounding box refers to a rectangular area defined by its geographic coordinates (latitude and longitude) that encloses a specific region of interest. By specifying the bounding box, users can focus on a particular area and extract relevant data for analysis.
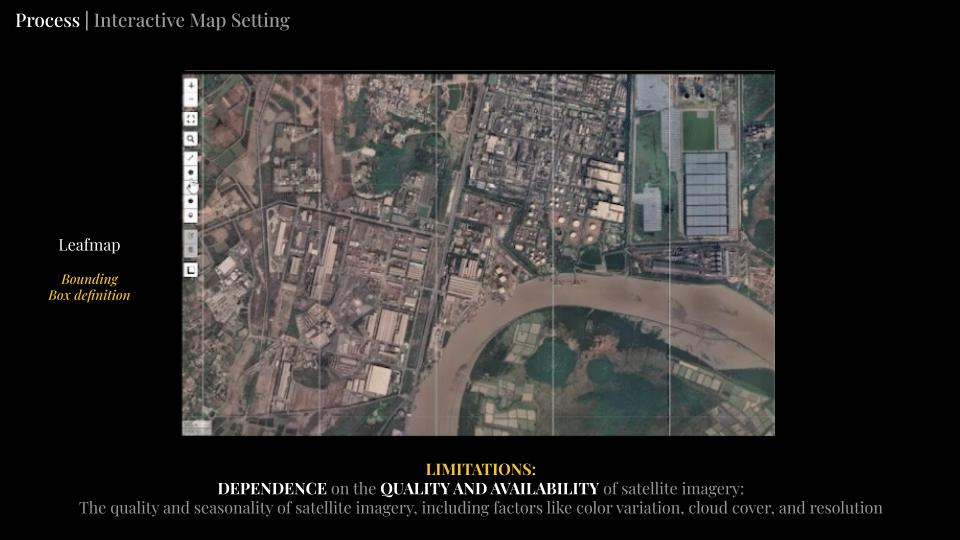
However, one of the limitations of this feature is its dependence on the quality and availability of satellite imagery. Factors such as color variation, cloud cover, and resolution can affect the quality and usefulness of the imagery used in mapping and analysis. Inadequate or outdated imagery may limit the accuracy and reliability of the results obtained from the interactive map and bounding box feature.
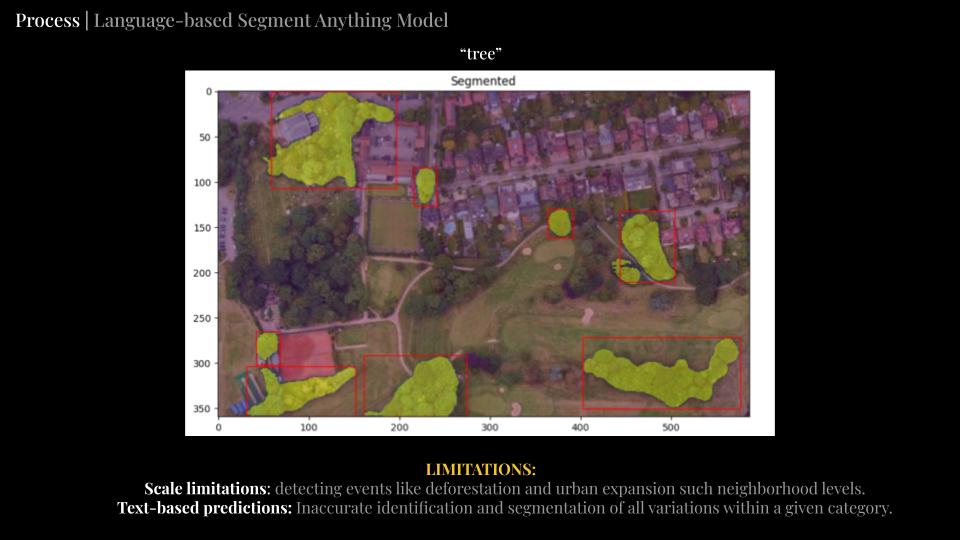
PROCESS | Language-based Segment Anything Model
The Language-based Segment Anything Model (LSAM) is an innovative approach that combines language understanding and computer vision to perform object detection and segmentation tasks. LSAM leverages textual prompts to guide the model’s understanding and segmentation of various objects and events. In our experiments, we explored different prompts to improve the model’s performance and adaptability to different scenarios.
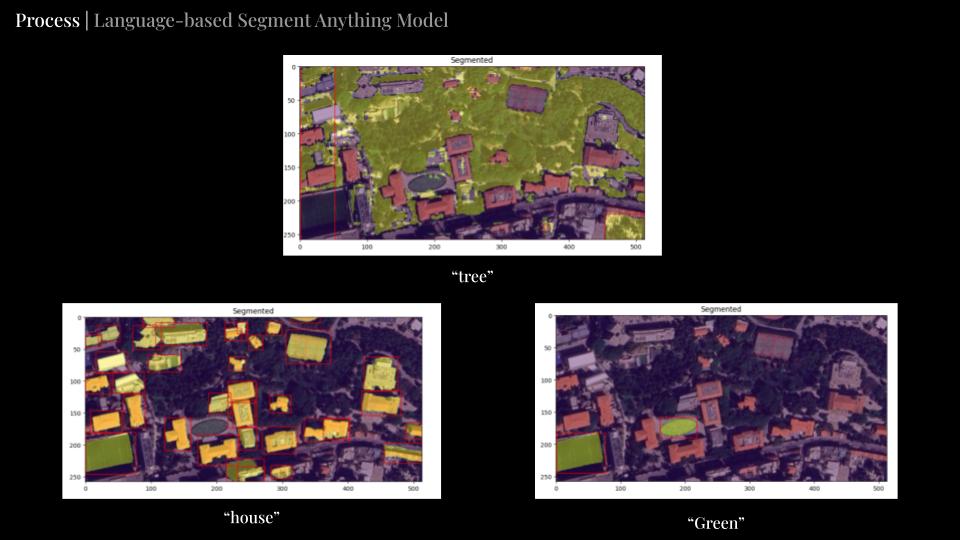
However, LSAM has certain limitations. One limitation is its scale limitations. While LSAM can detect and segment objects and events at larger scales, such as deforestation and urban expansion on a regional or global level, it may struggle with detecting more localized events at smaller scales, such as neighborhood-level changes. Another limitation arises from its text-based predictions. LSAM’s accuracy in identifying and segmenting all variations within a given category may be compromised, leading to potential inaccuracies in the results. Ongoing research and development efforts aim to address these limitations and enhance the performance of LSAM for a broader range of applications.
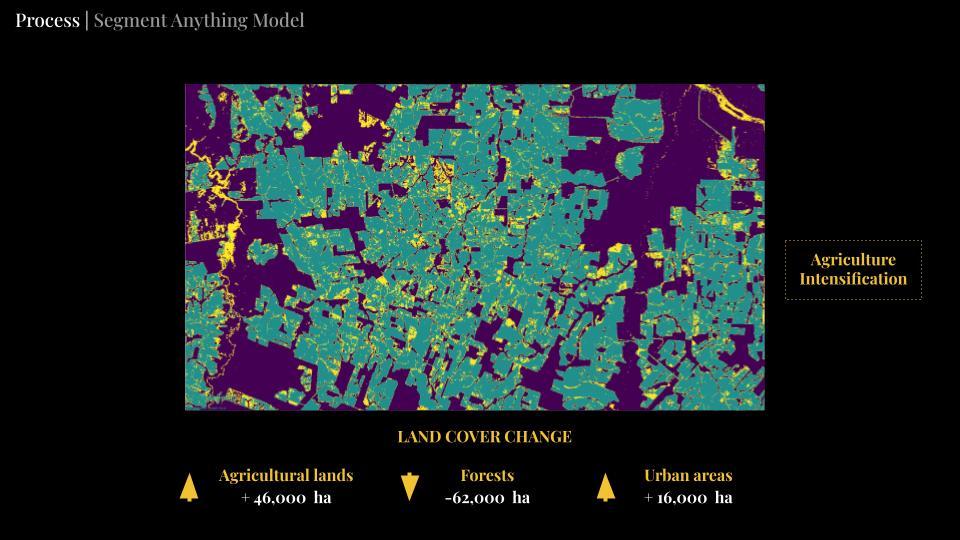
PROCESS | Segment Anything Model
The Segment Anything Model (SAM) is a cutting-edge model that provides the ability to segment and analyze major land cover changes over larger study areas. SAM allows for the identification and delineation of different land cover types, enabling researchers to track and analyze changes such as deforestation, urban expansion, and other significant land cover transformations. By increasing the area of study, SAM enables a broader perspective on these changes and their implications.
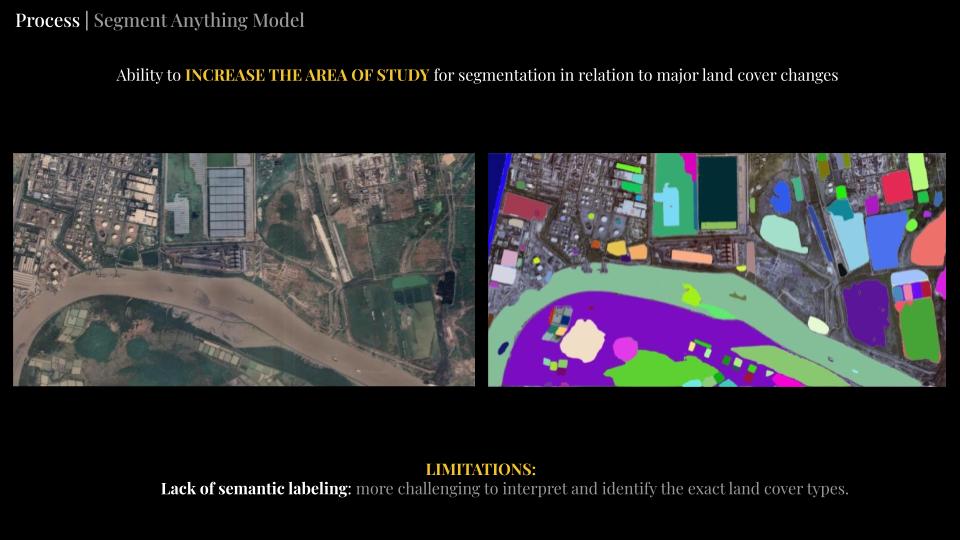
However, SAM has certain limitations. One limitation is the lack of semantic labeling. While SAM can segment the major land cover changes, it may face challenges in accurately interpreting and identifying the exact types of land cover present. This can make it more difficult to distinguish between different land cover categories and can lead to potential inaccuracies in the analysis. Ongoing advancements in semantic labeling techniques aim to address this limitation and improve the interpretability of SAM’s segmentation results.
Teles Pires River, Brazil
The Teles Pires River in Brazil is a significant waterway that flows through the Amazon rainforest. Unfortunately, the region surrounding the river has experienced significant deforestation in recent years. Deforestation in the Teles Pires River basin is primarily driven by activities such as illegal logging, land clearance for agriculture, and infrastructure development. The removal of trees and vegetation in this area has not only resulted in the loss of vital ecosystems but has also had negative impacts on local communities and biodiversity.
In order to increase accuracy, we selected green cover of the area, we isolate it and we perform K-means clusterization in order to categorize the rest of the land uses.
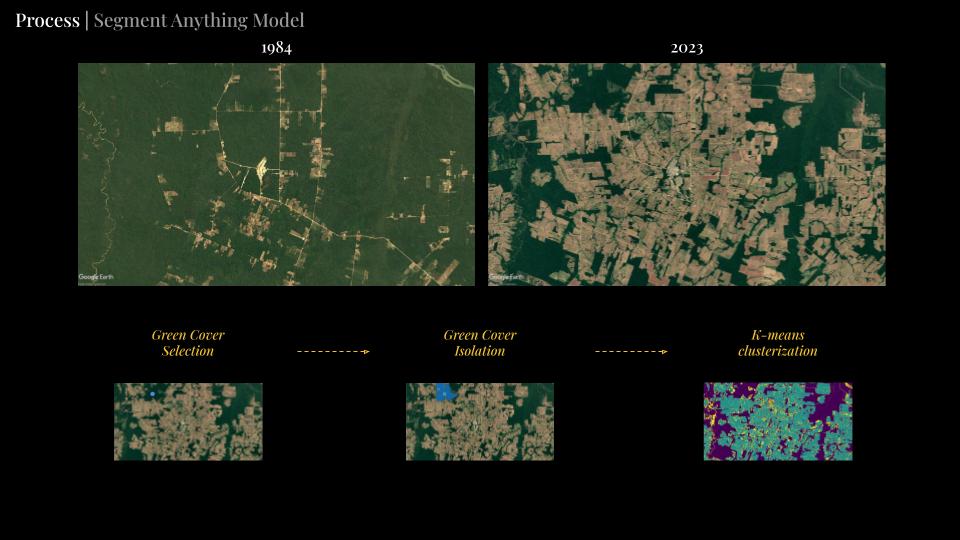
We performed the same process for the 1984 and 2023 Satellite Imagery.
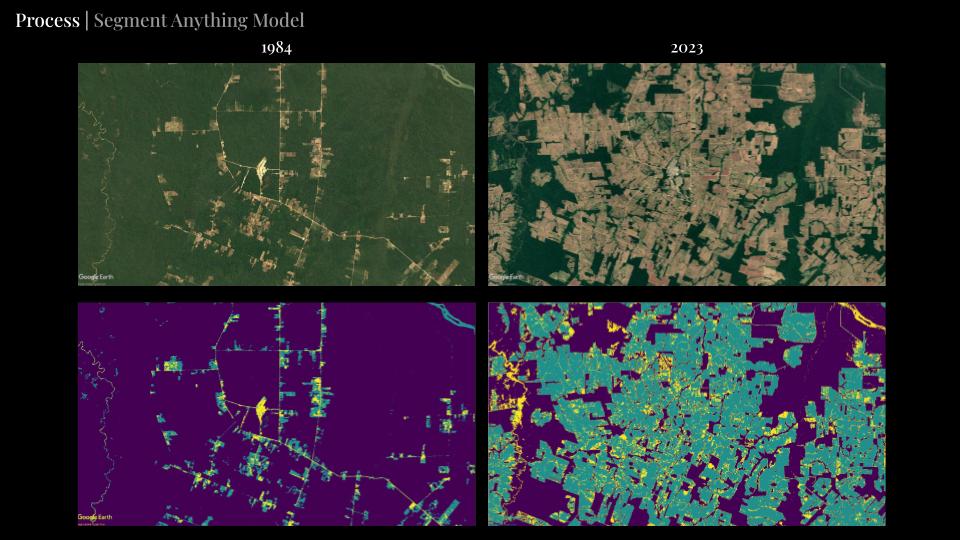
By calculating the areas of the different land uses, we compared them respectively. The numbers below shows agricultural intensification on behalf of forest lands and
Dashboard
Therefore, we decided to create a dashboard that would help the users to make informed decisions and identify the land cover changes in more specific areas for more tailored interventions and strategies.
