
Hyperbuilding 02 Data Team: From KPI Calculation to Native BIM Documentation
Introduction
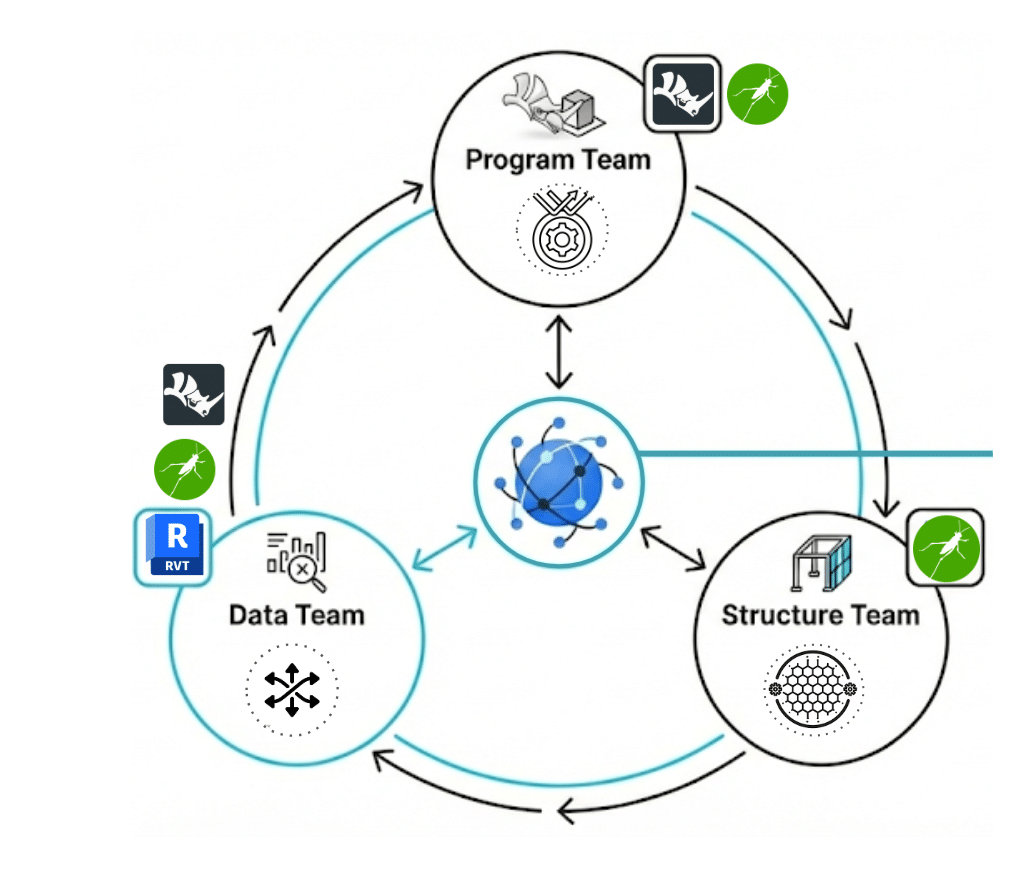
Hyperbuilding 02 Data Team developed an interoperability workflow that transforms analytical performance data into native BIM documentation. Instead of keeping KPI evaluation outside the architectural model, the project uses Rhino.Inside.Revit to transfer computed values into Revit, where they can be read through schedules, color-coded views, annotated drawings, and sheet-based documentation.
This approach addresses a recurring problem in computational design workflows: geometry, analysis, and documentation are often produced in separate environments. As a result, performance data becomes harder to communicate, review, and compare during design development. The goal of this work was to close that gap by embedding performance logic directly into the Revit model environment.
Within the Integrative Modeling seminar, interoperability is not only a technical issue. It is a design problem, a data problem, and a documentation problem. The contribution of the Data Team was to define a shared framework where geometry, metadata, validation, and visualization could work together. In this workflow, analytical values are no longer isolated in spreadsheets or external simulation interfaces. They become part of the architectural model itself.
Interoperability as a Design Problem
Interoperability Workflow
The workflow begins with shared geometric and analytical inputs coming from Rhino, Grasshopper, and team-based model exchange. Areas, volumes, levels, and element identifiers are extracted and structured in Grasshopper. KPI values are then calculated and organized per level or per element. Through Rhino.Inside.Revit, this data is pushed into Revit as instance-based information, making it available for filters, schedules, legends, and sheets.
This workflow does not treat Revit as a passive receiver of geometry. Revit becomes the final information environment where performance is visualized, checked, and documented. The result is a model that supports both design interpretation and final communication.
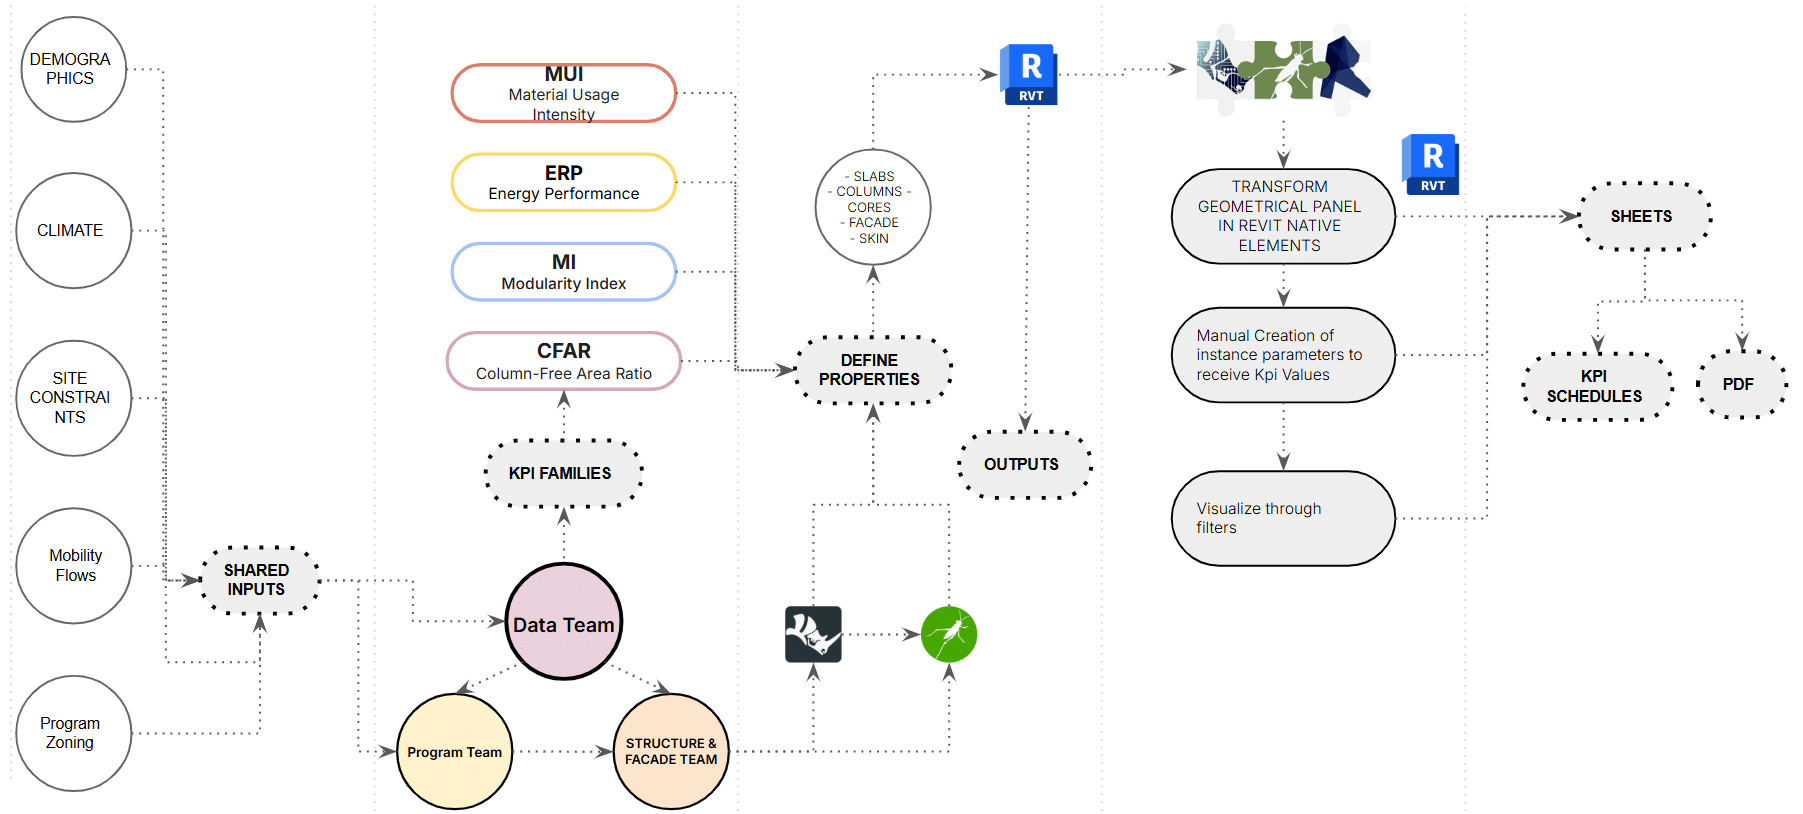
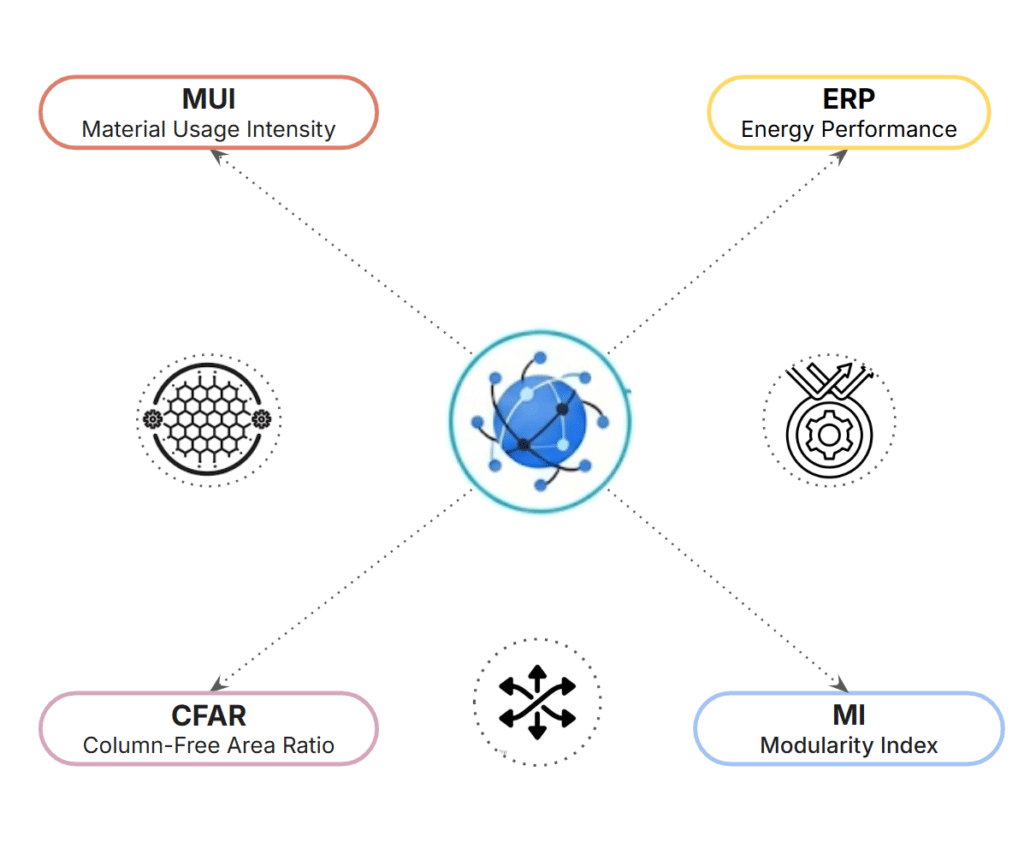
KPI Framework
The KPI system was restructured into five clearly defined groups based on measurable outputs:
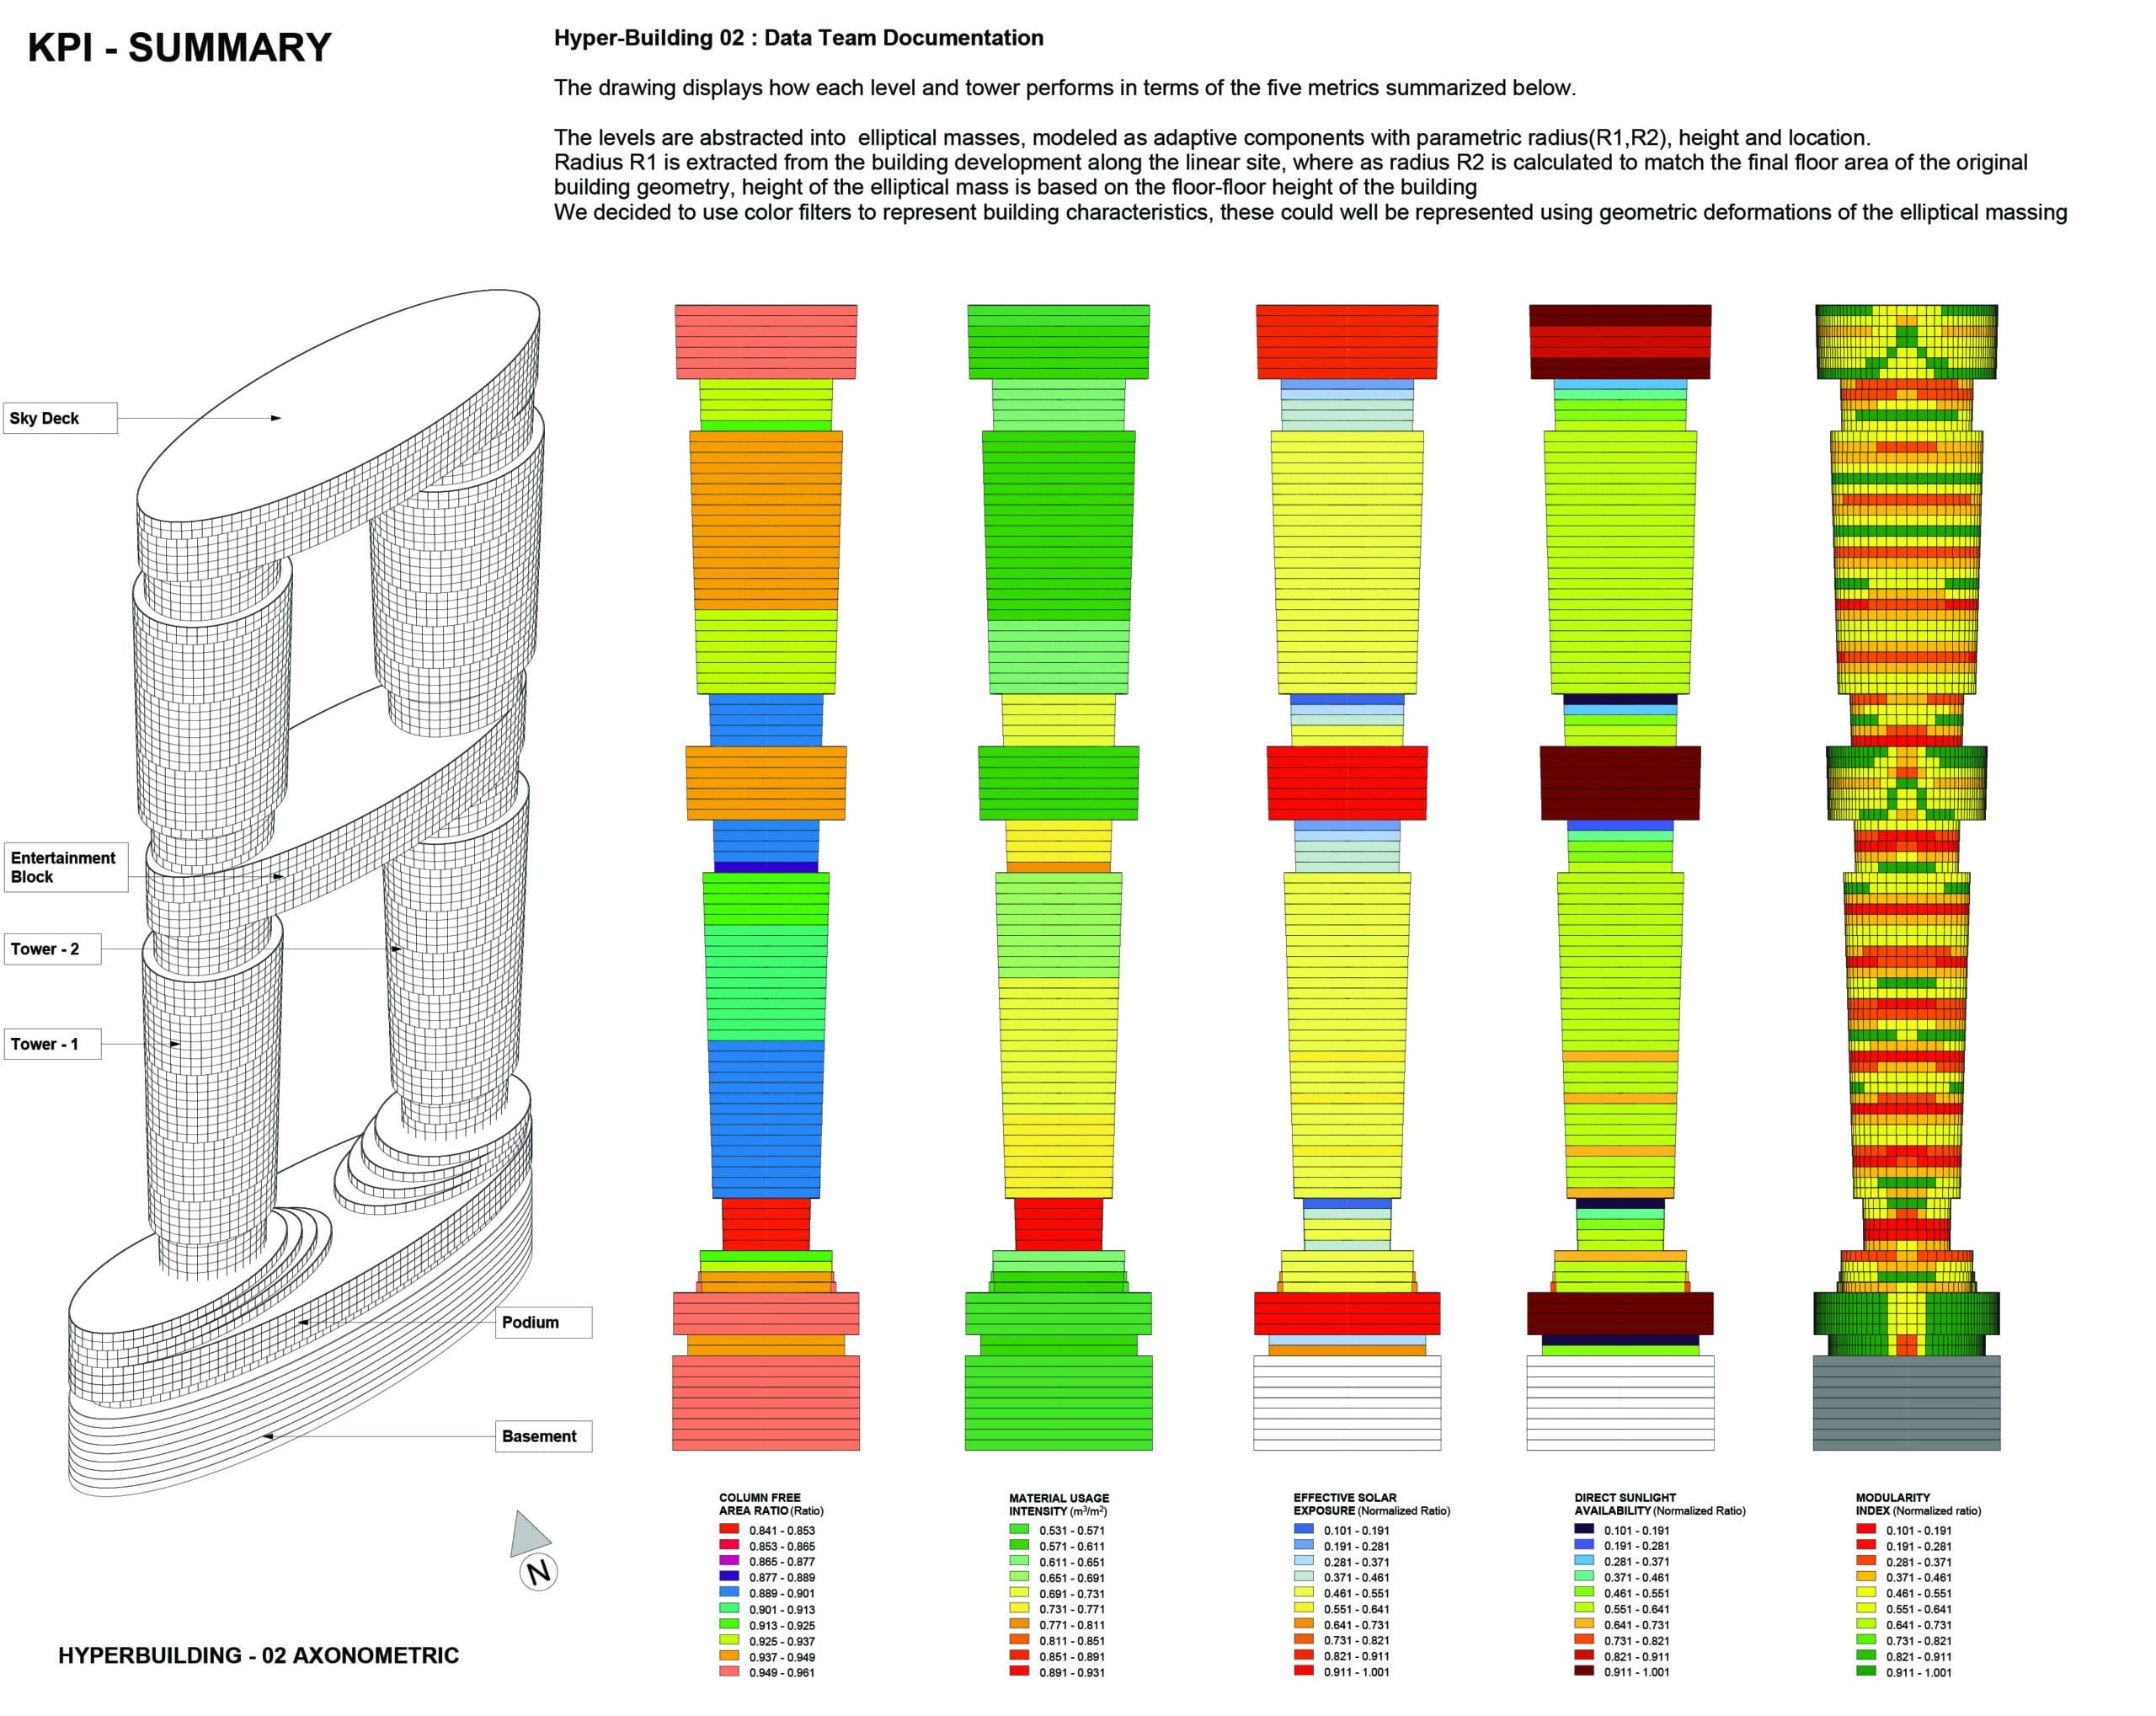
Spatial KPI
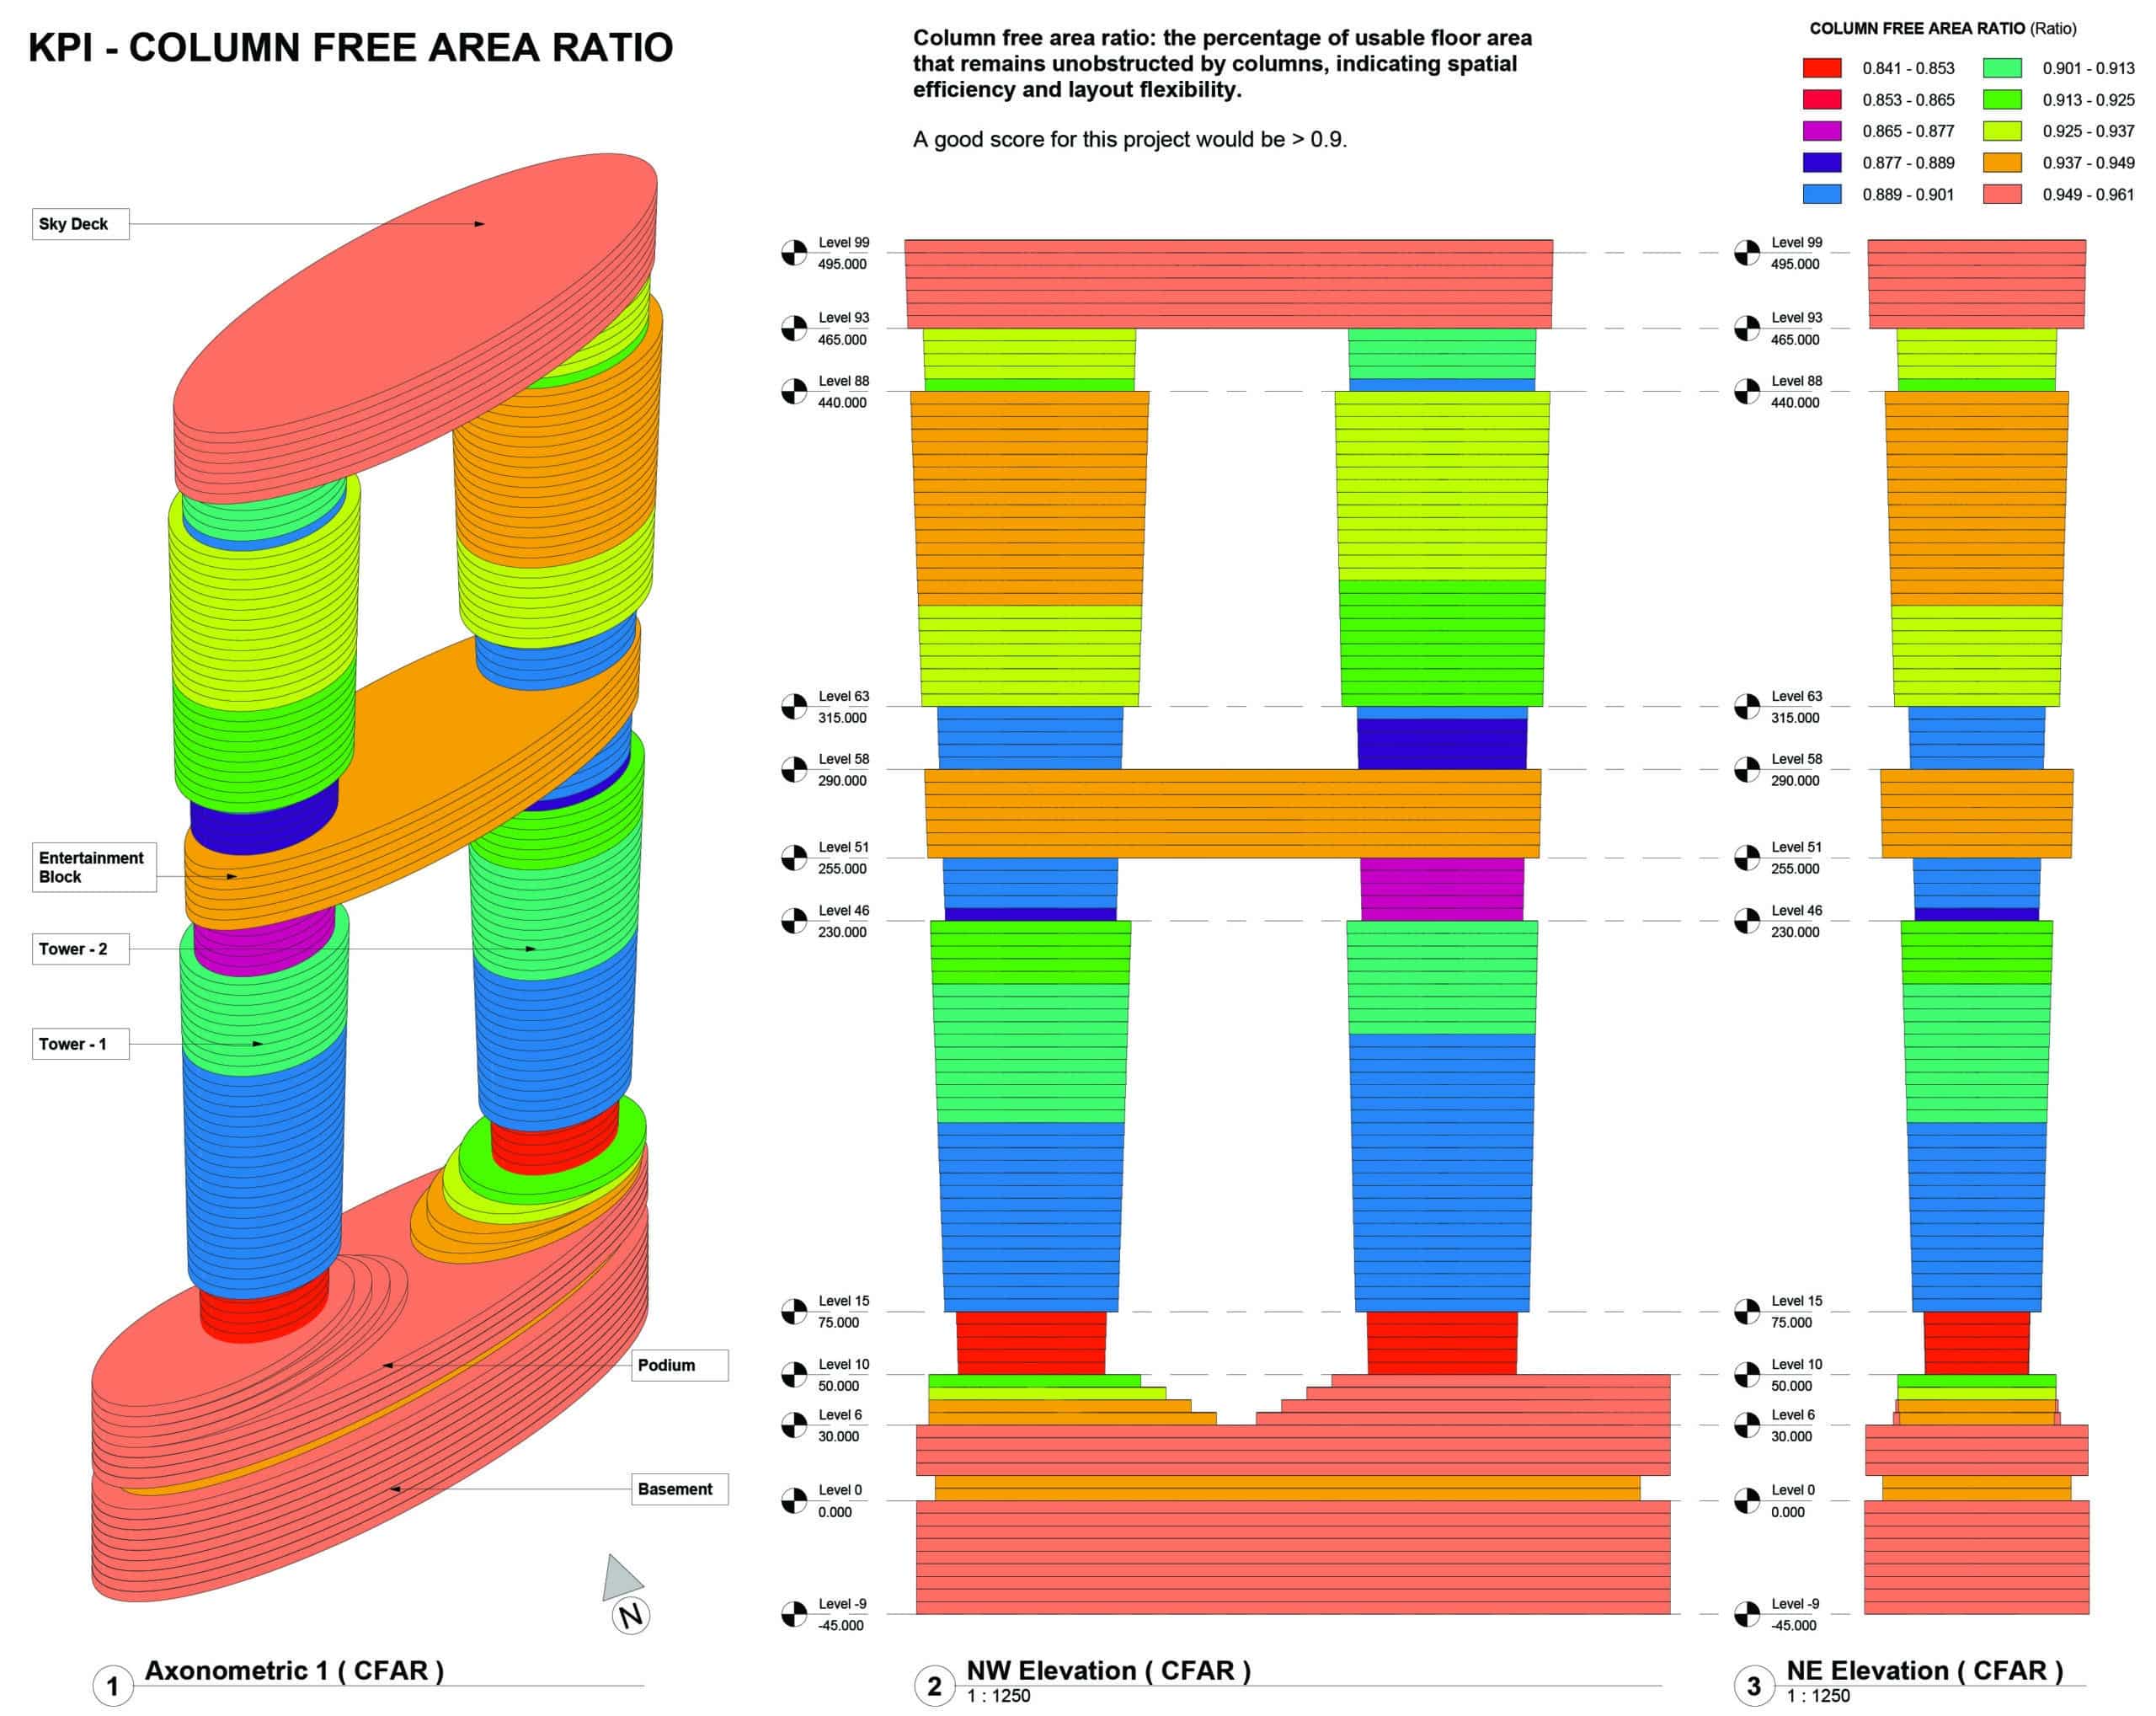
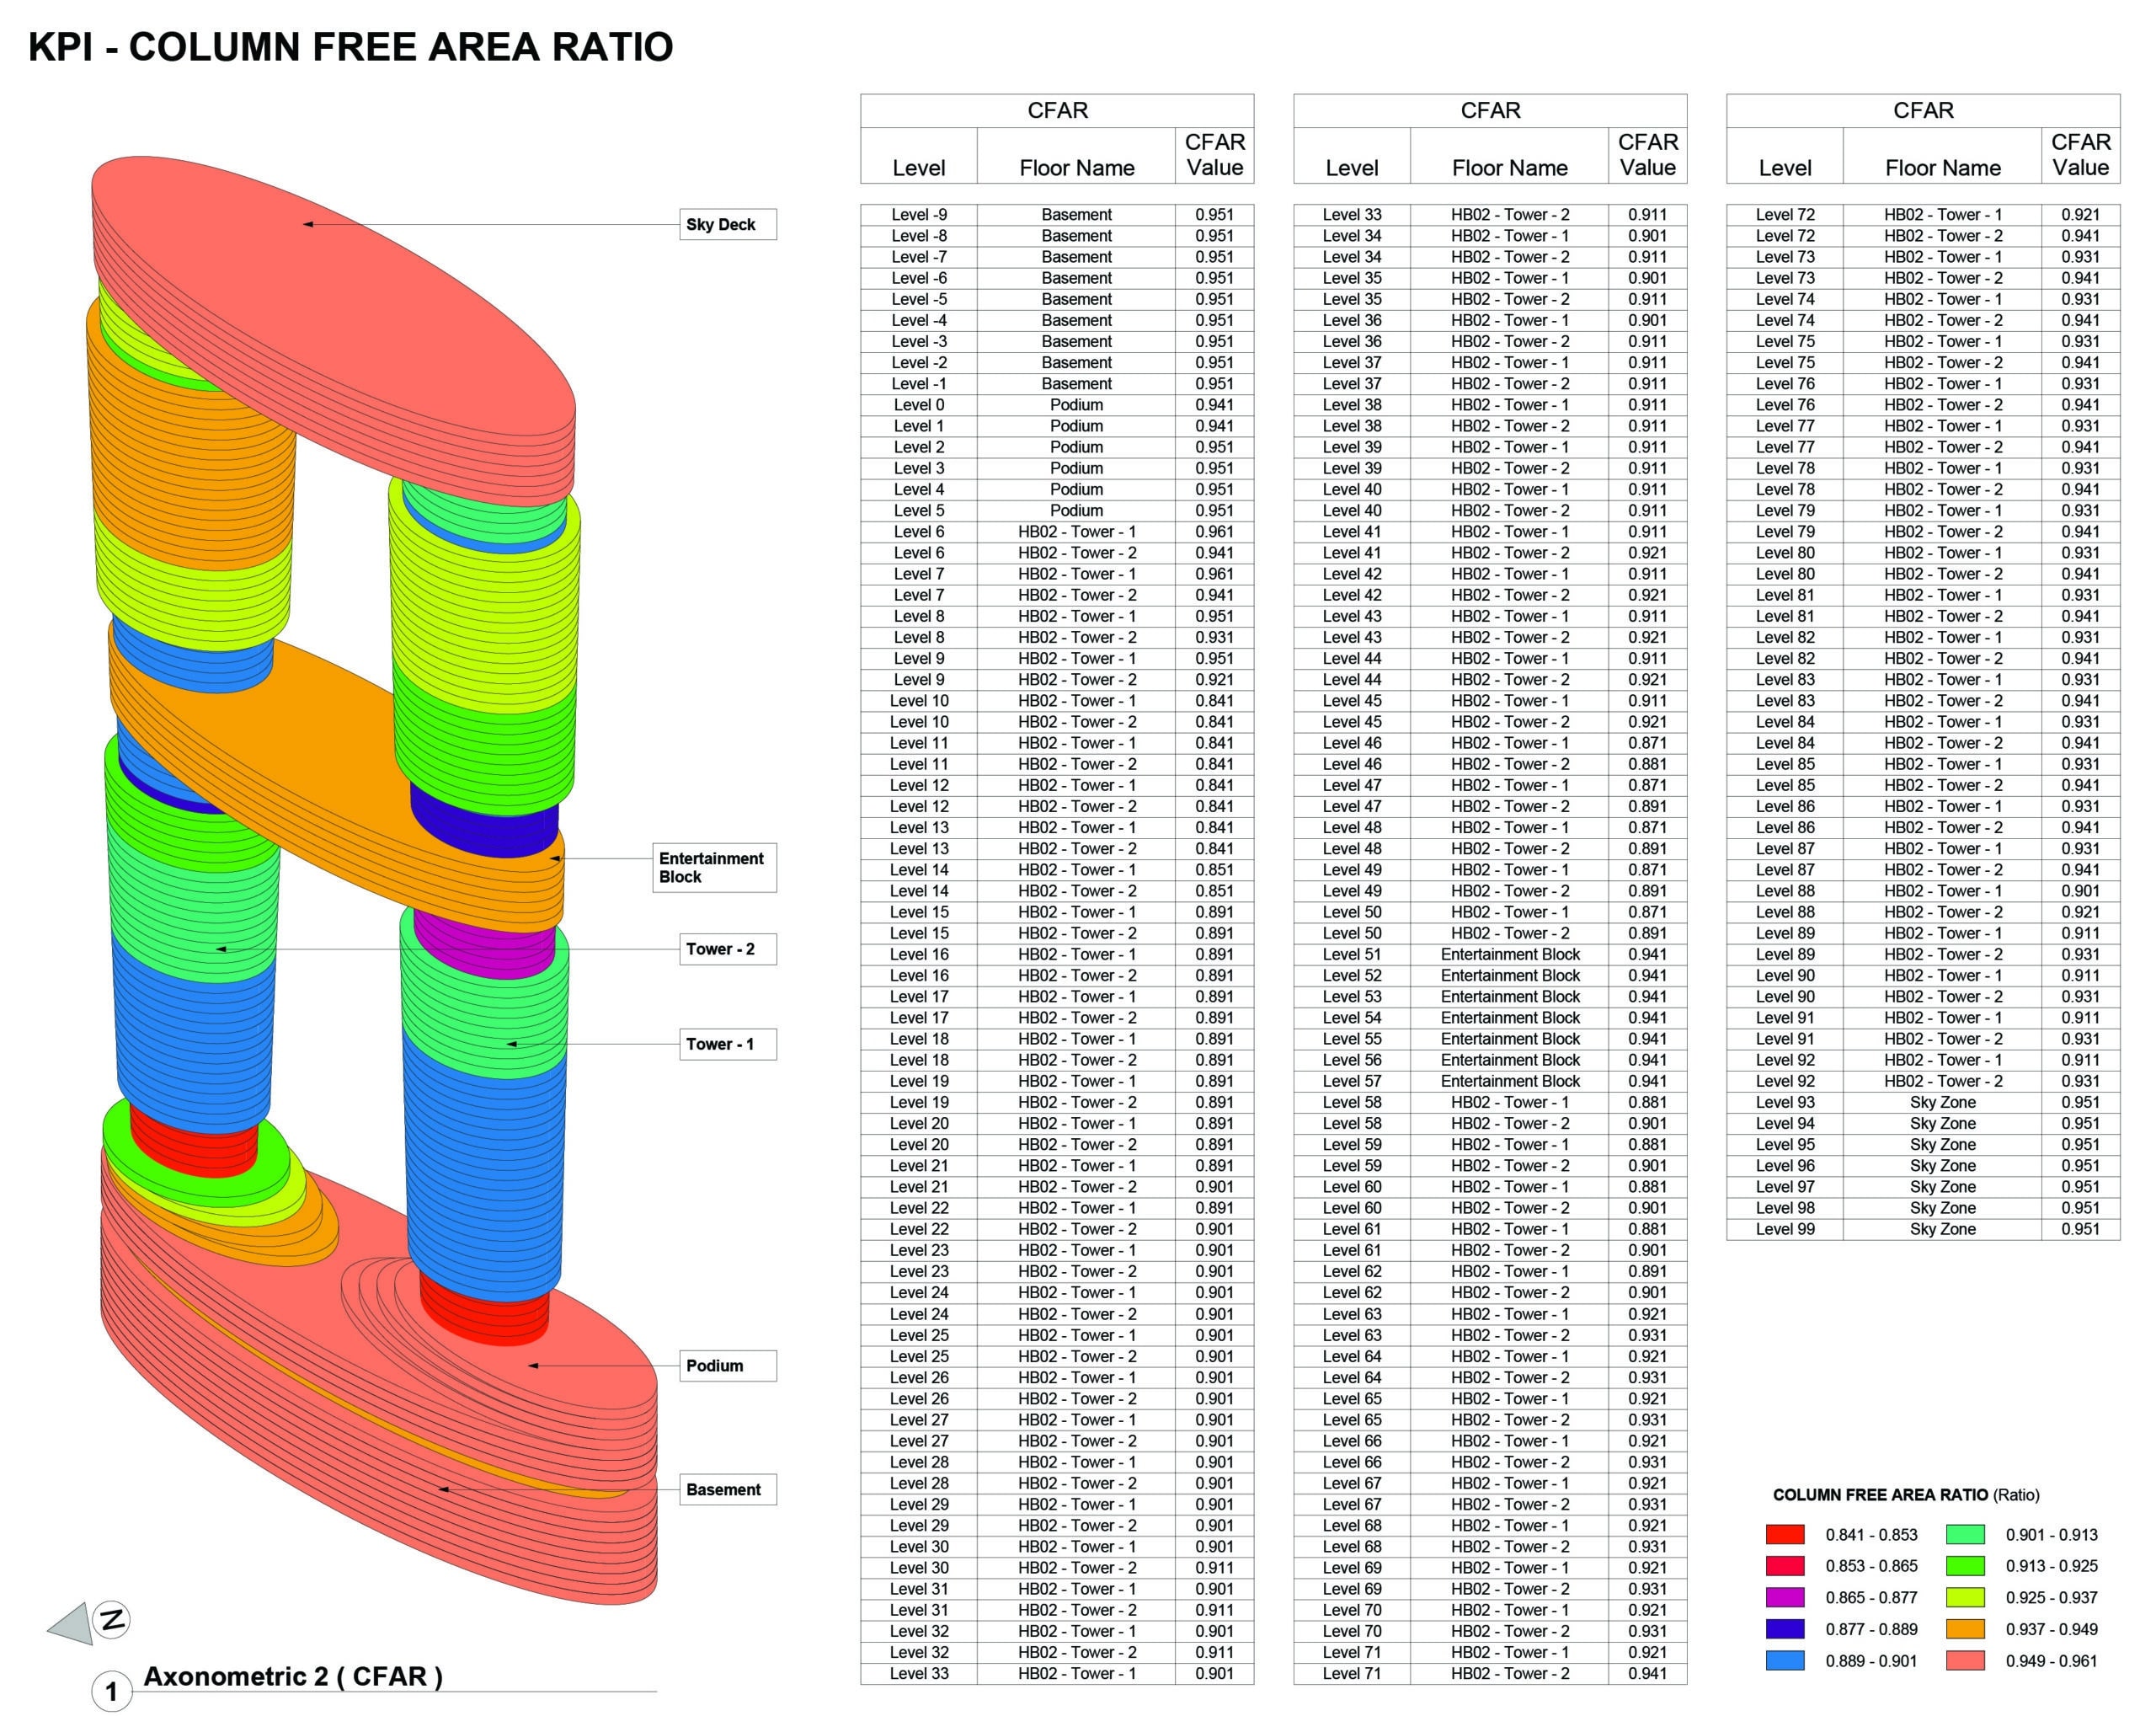
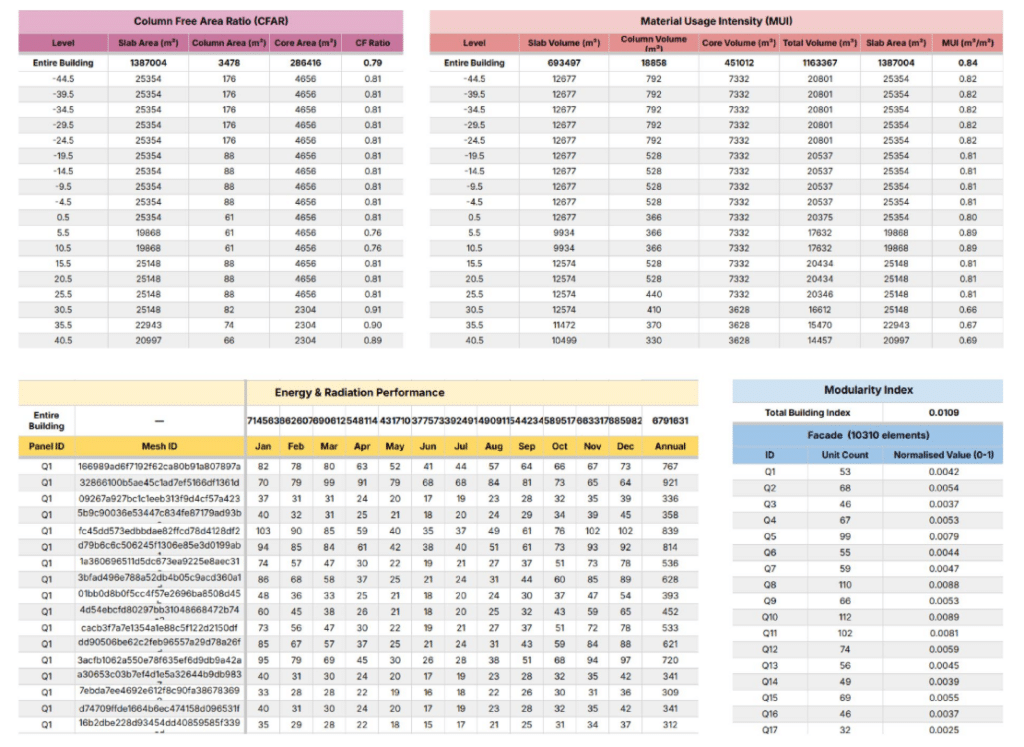
- CFAR (Column-Free Area Ratio): evaluates the proportion of circulation area relative to usable floor area.
Material KPI
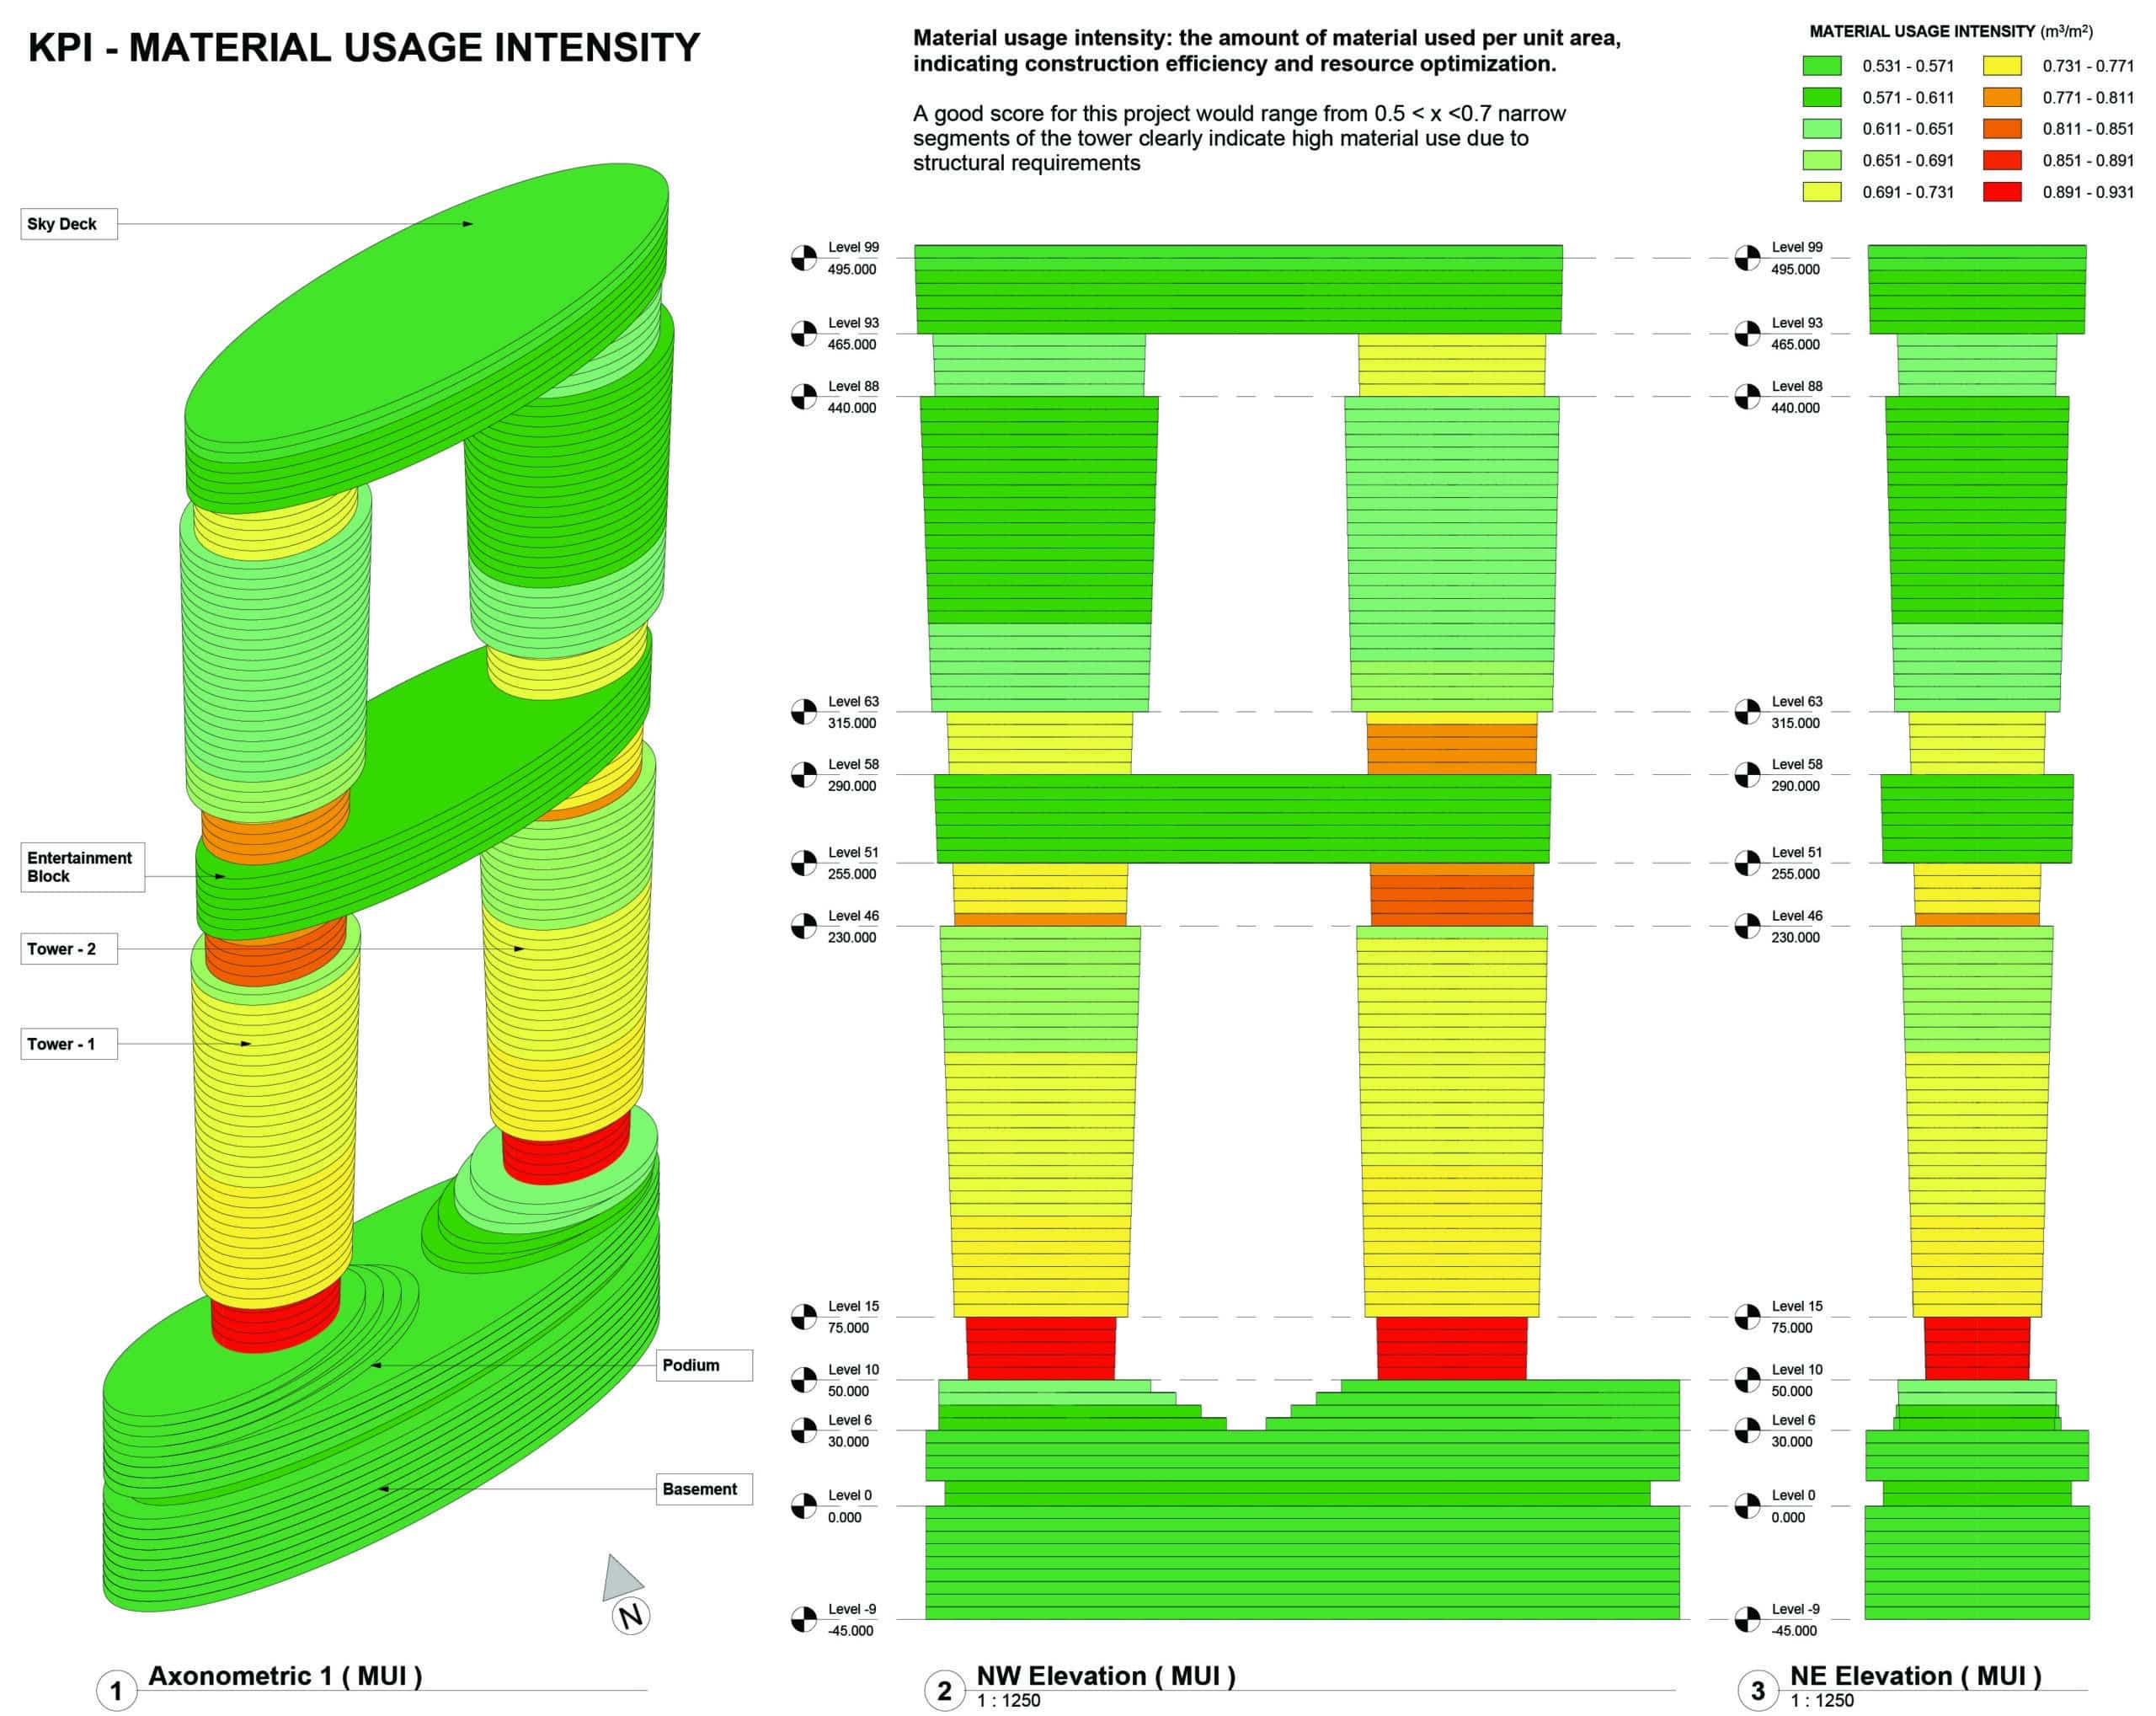
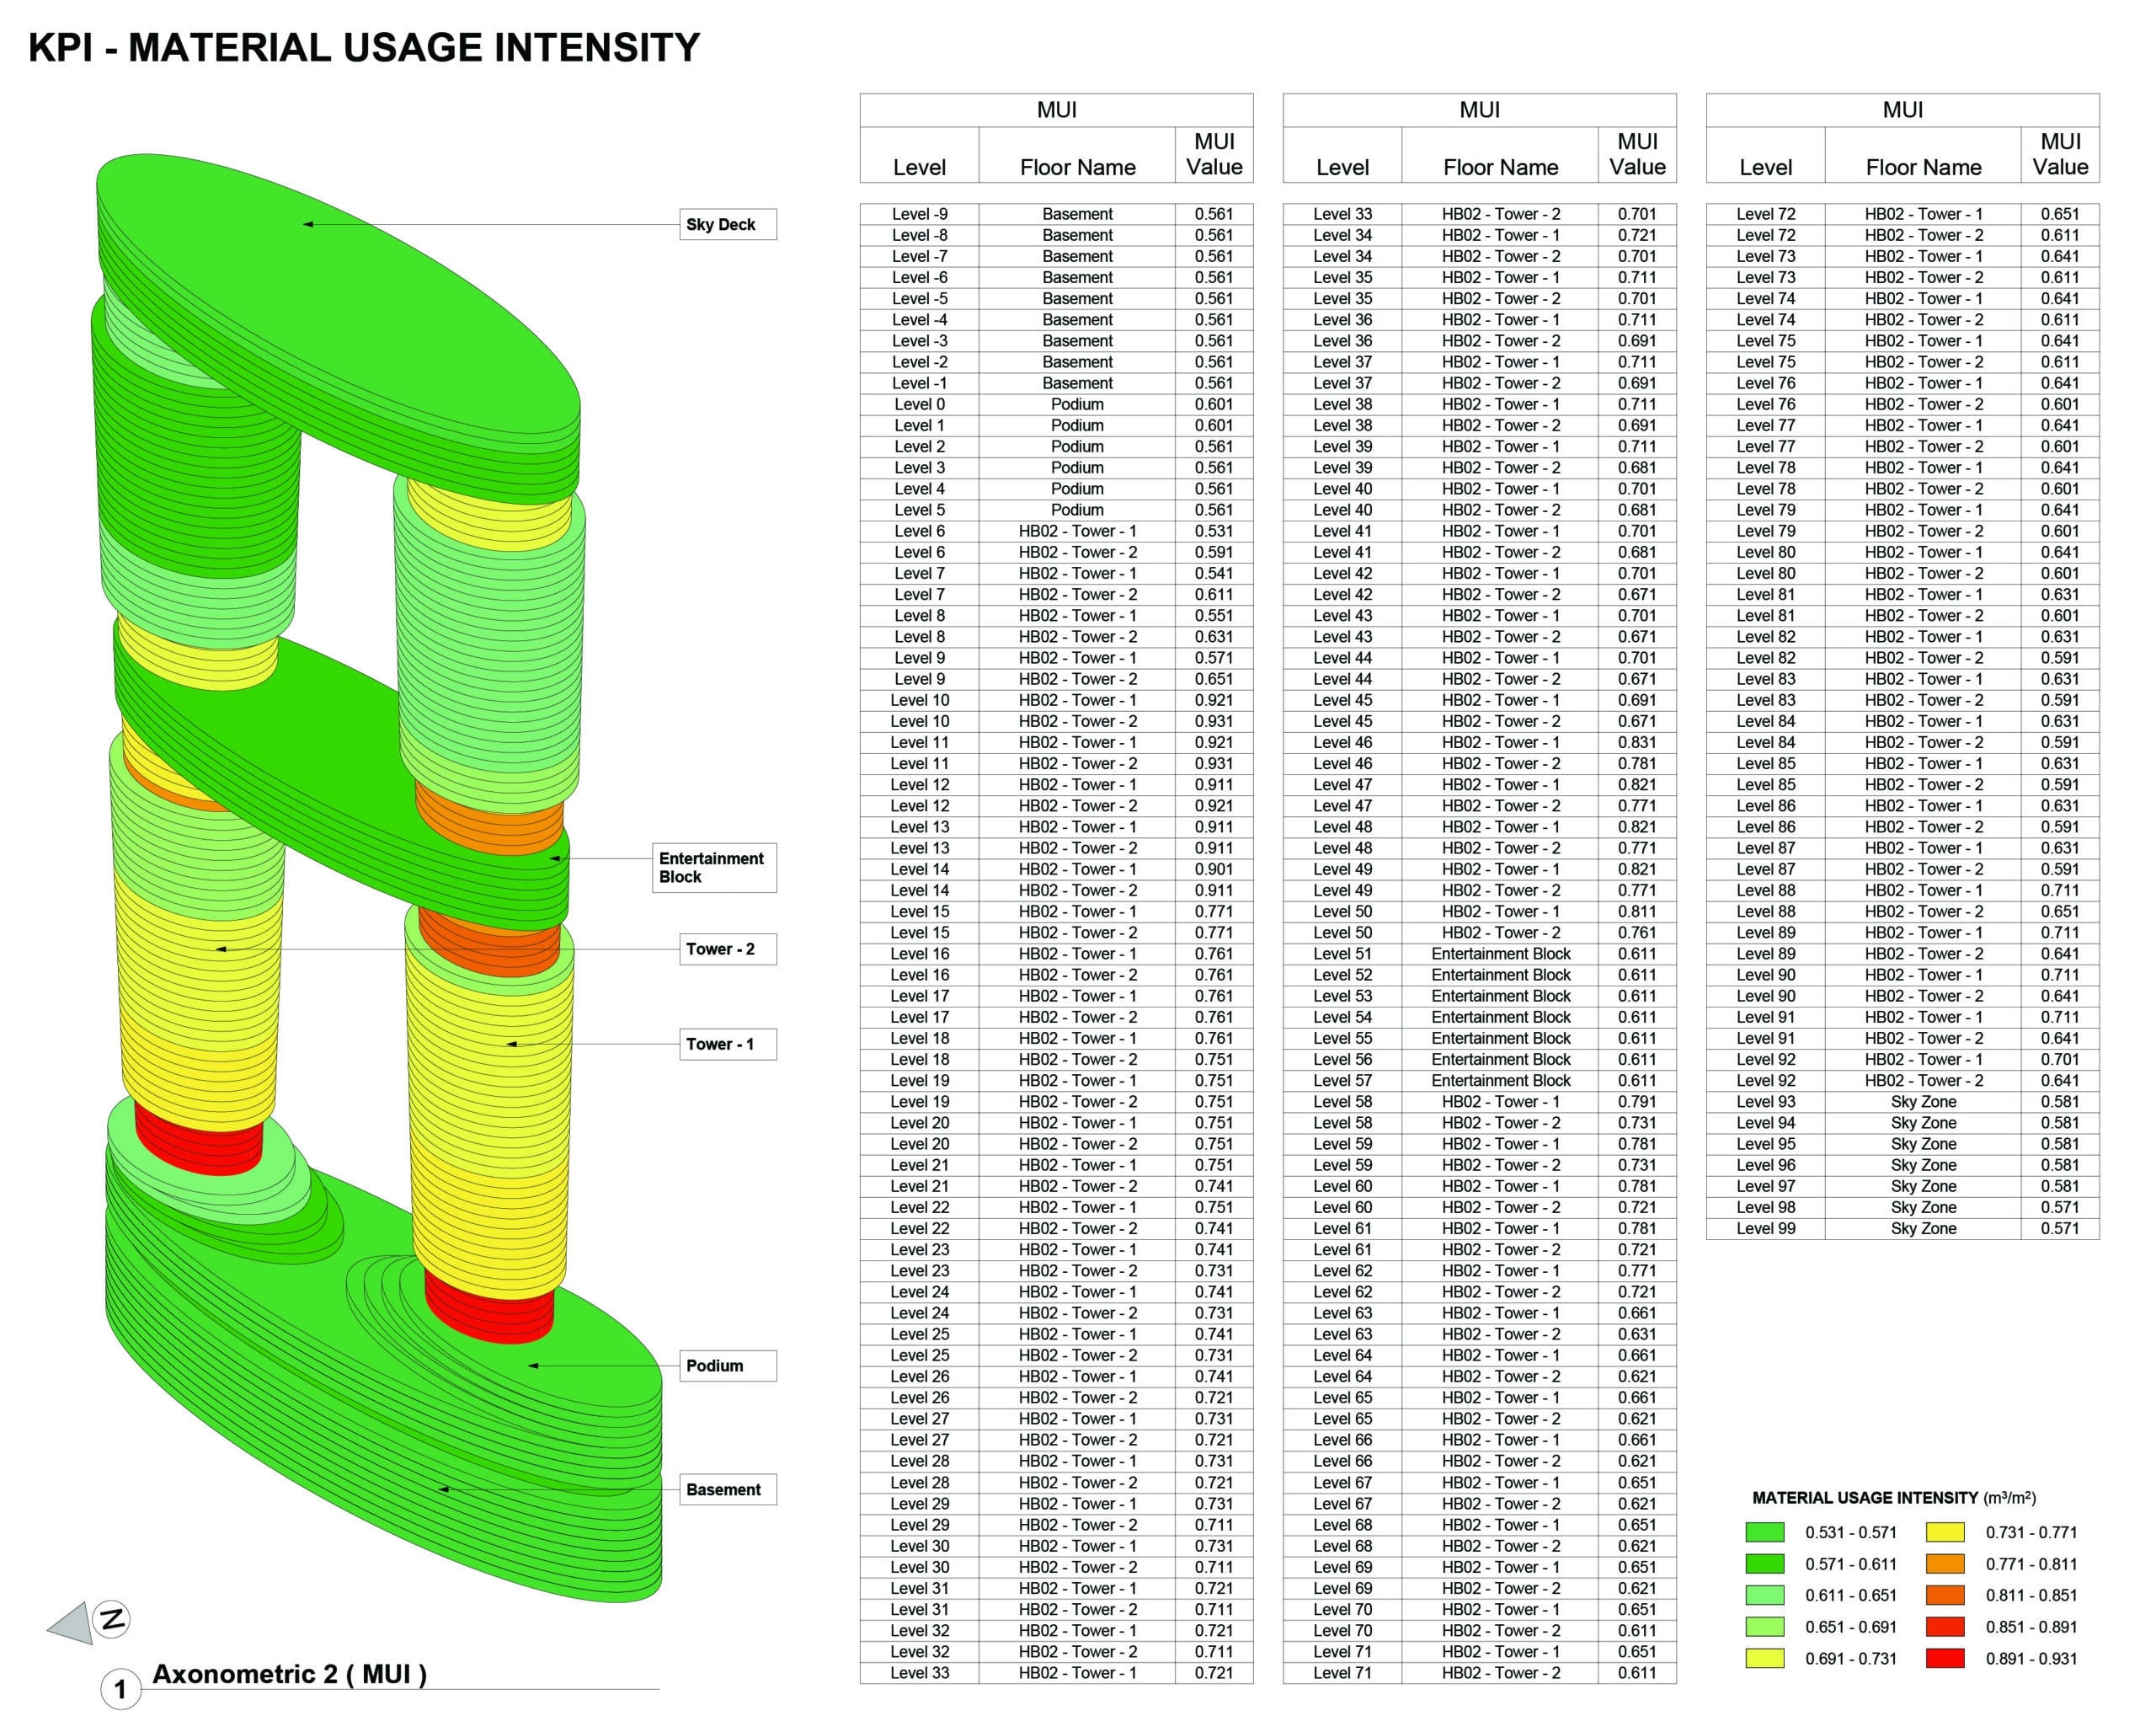
- MUI (Material Usage Index): measures material distribution efficiency across different levels.
Solar Exposure KPIs
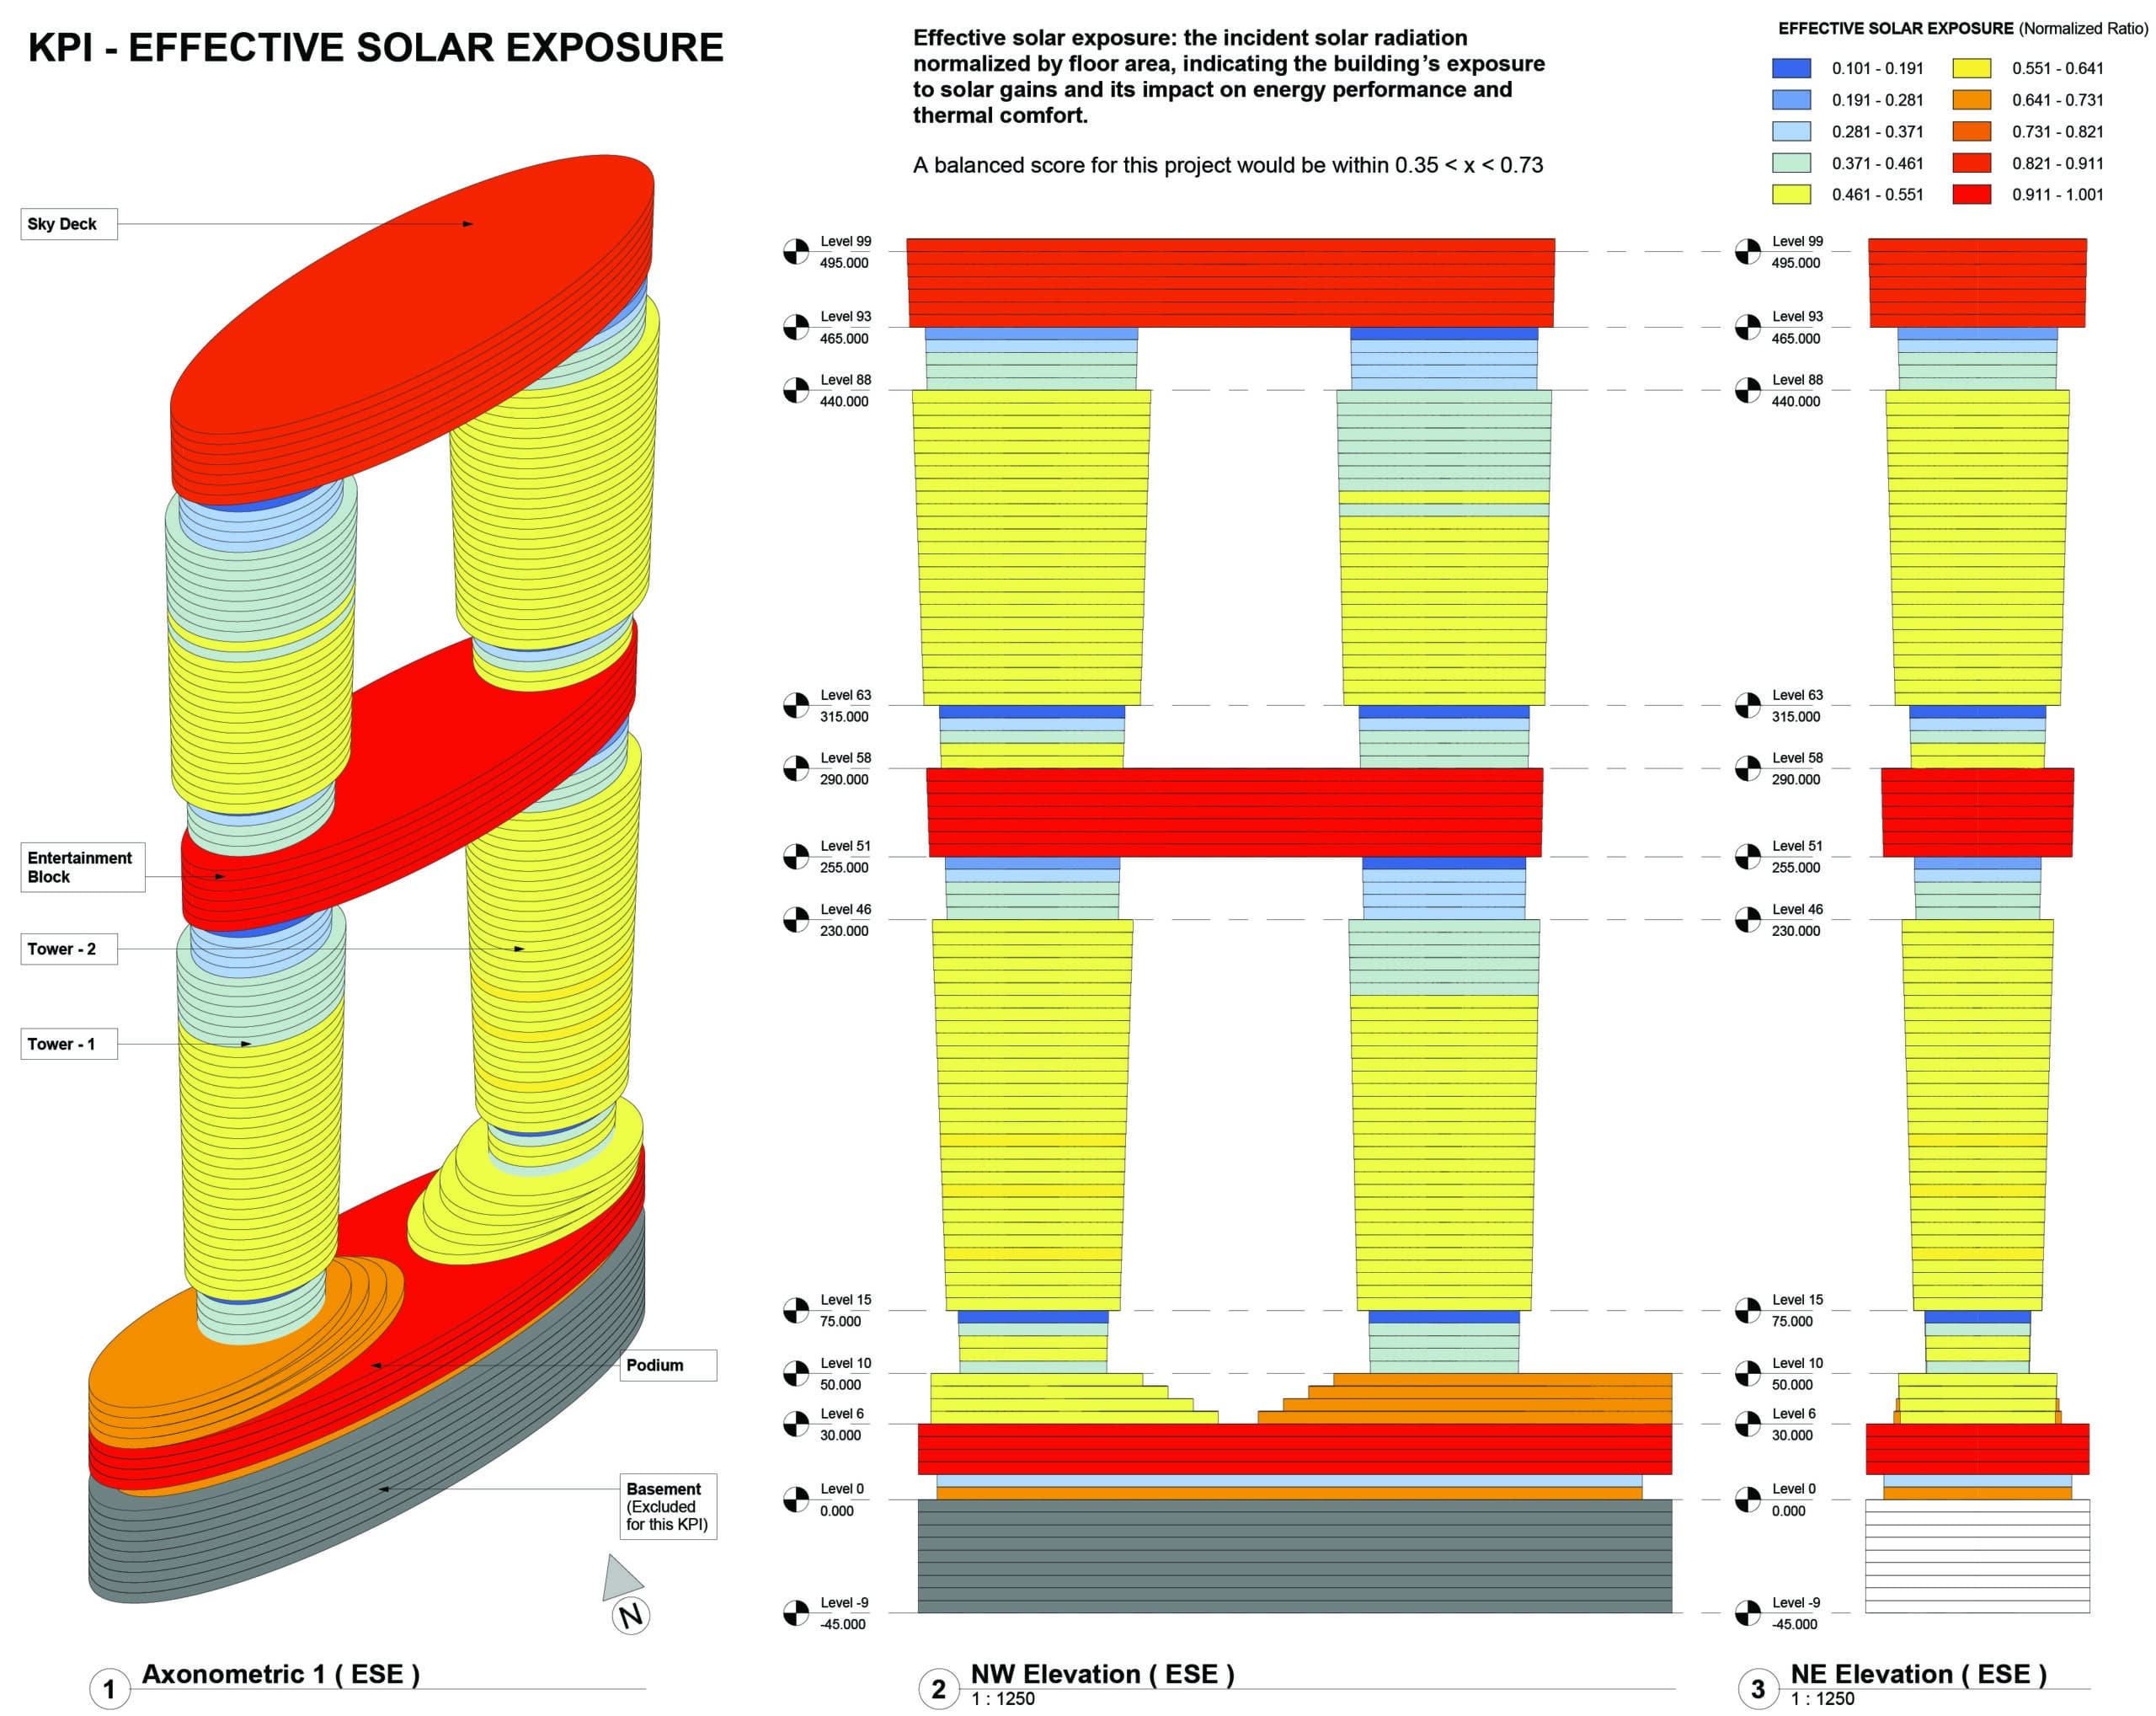
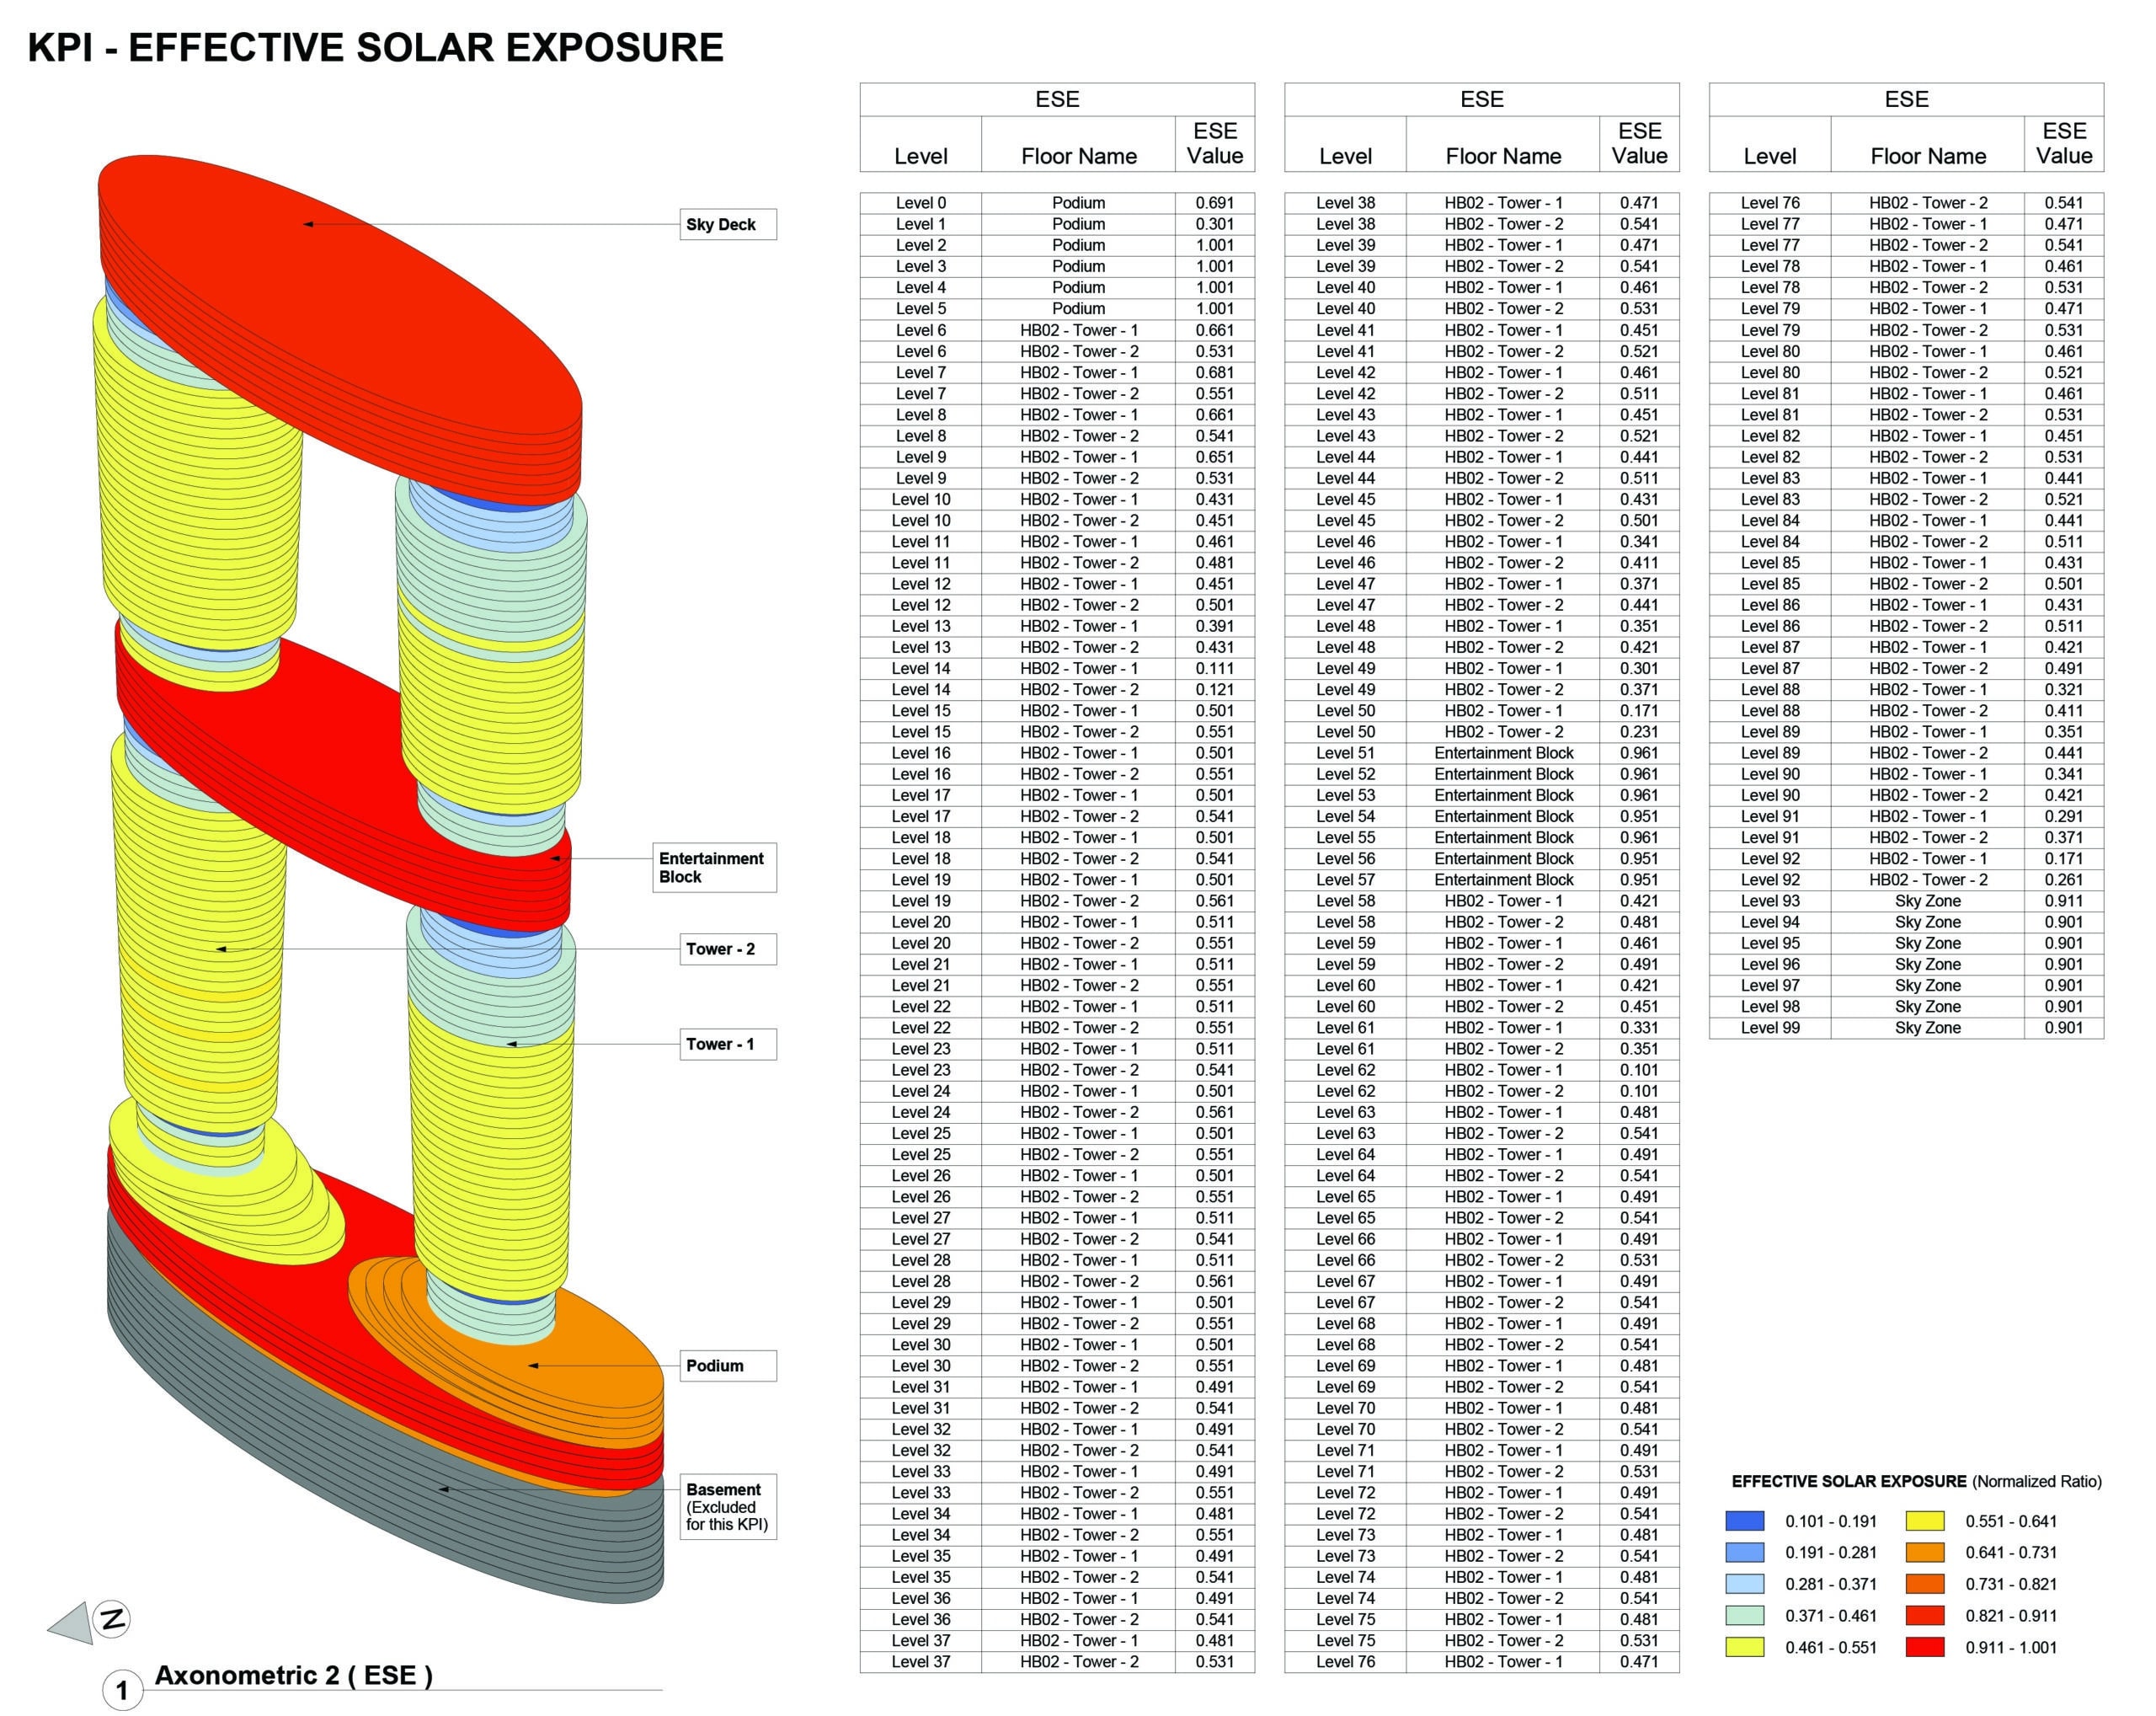
- Effective Solar Exposure: measures the building’s exposure to solar gains and its impact on energy performance and thermal comfort.
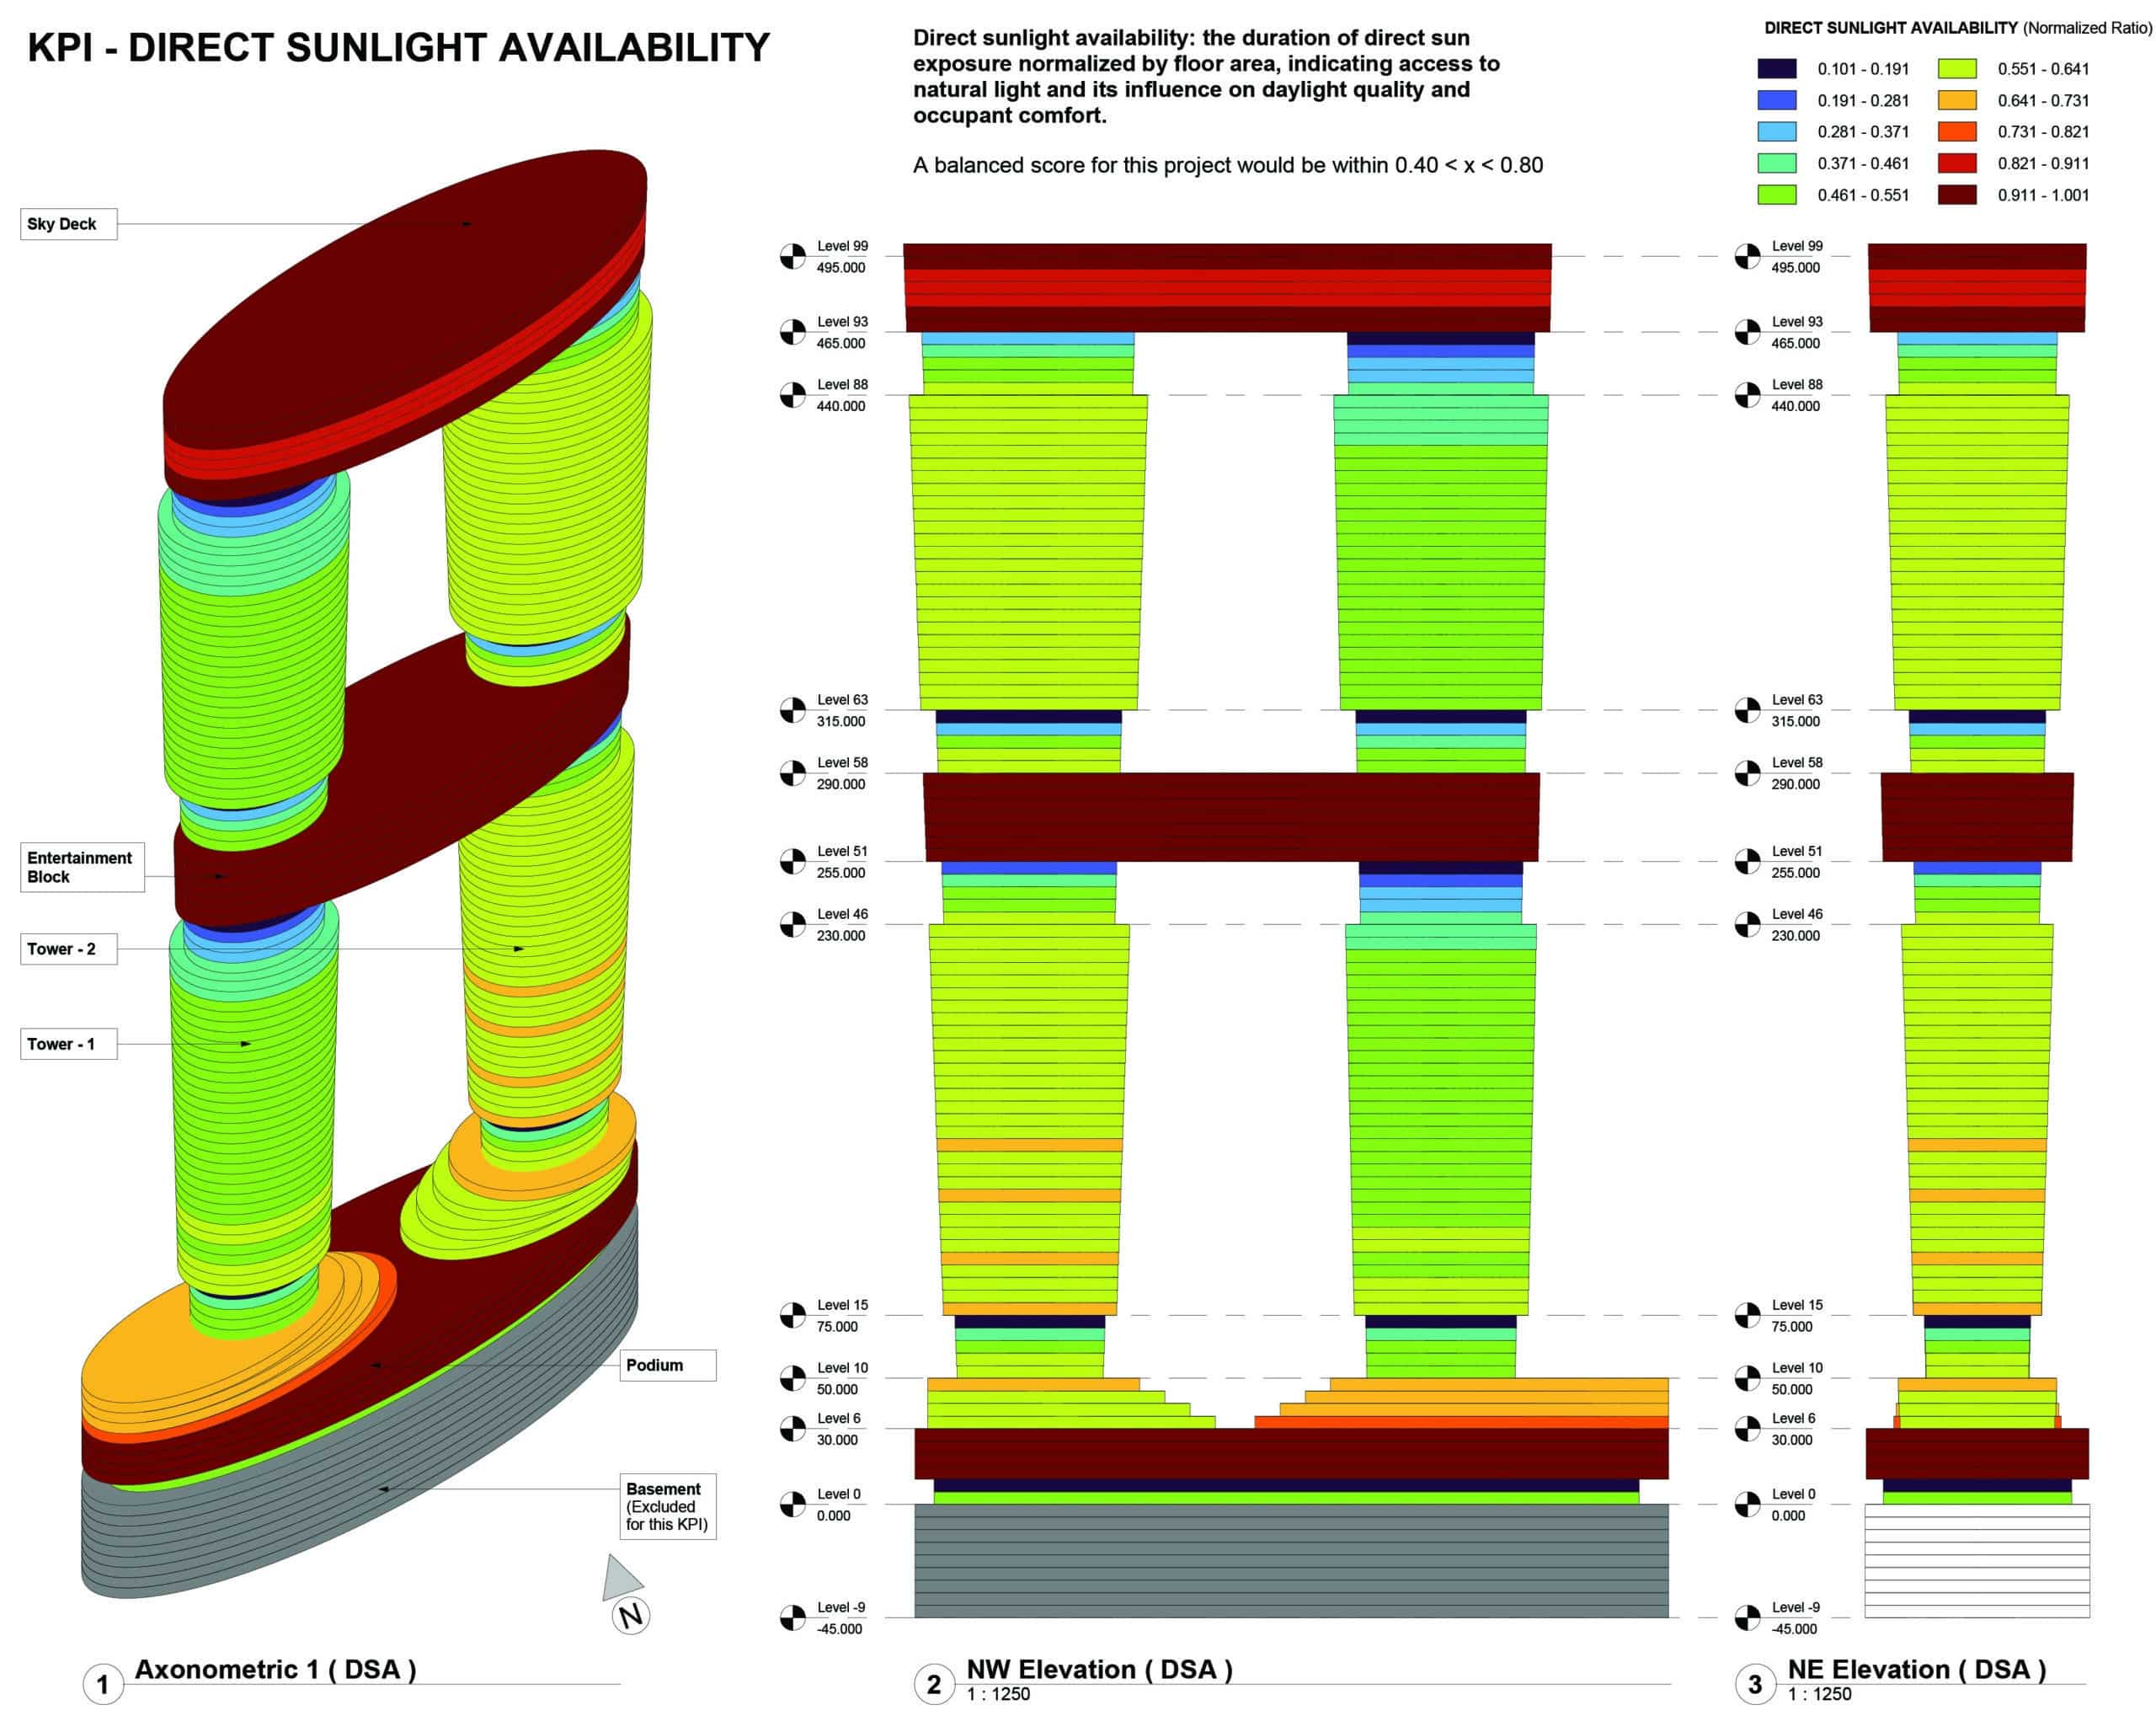
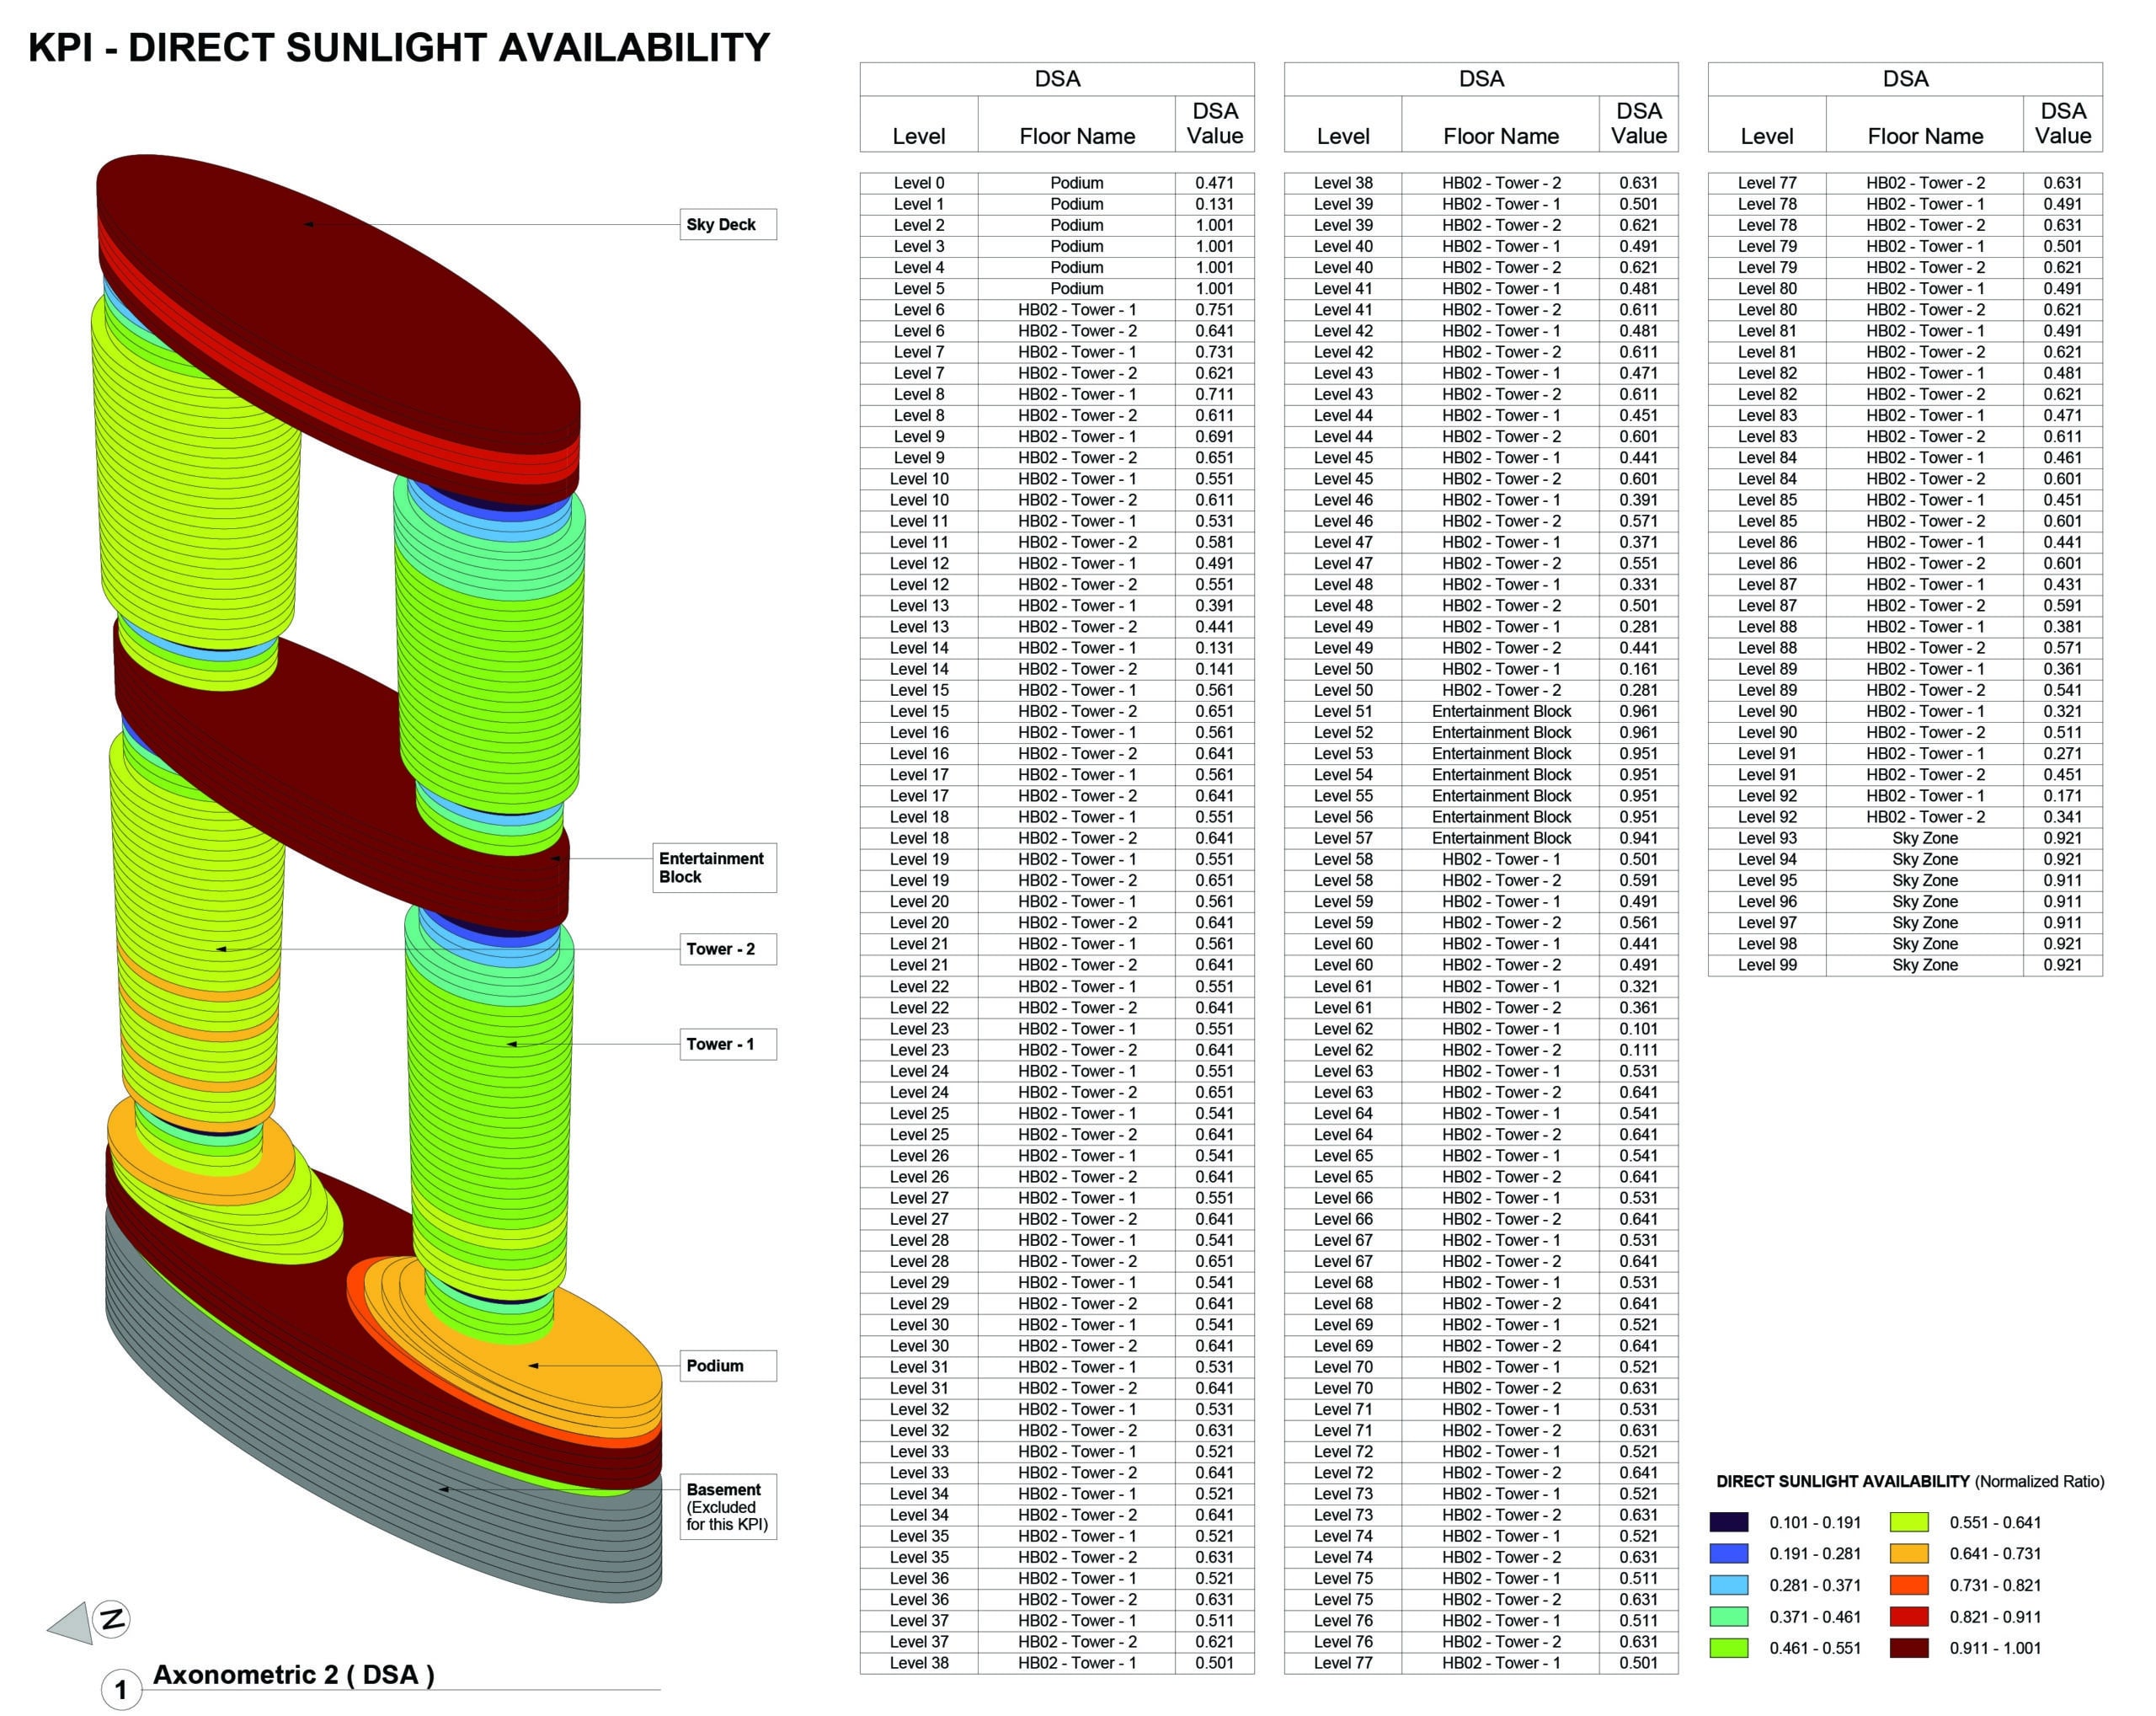
- Direct Sunlight Availability: measures access to natural light and its influence on daylight quality and occupant comfort.
Façade Rationalization KPI
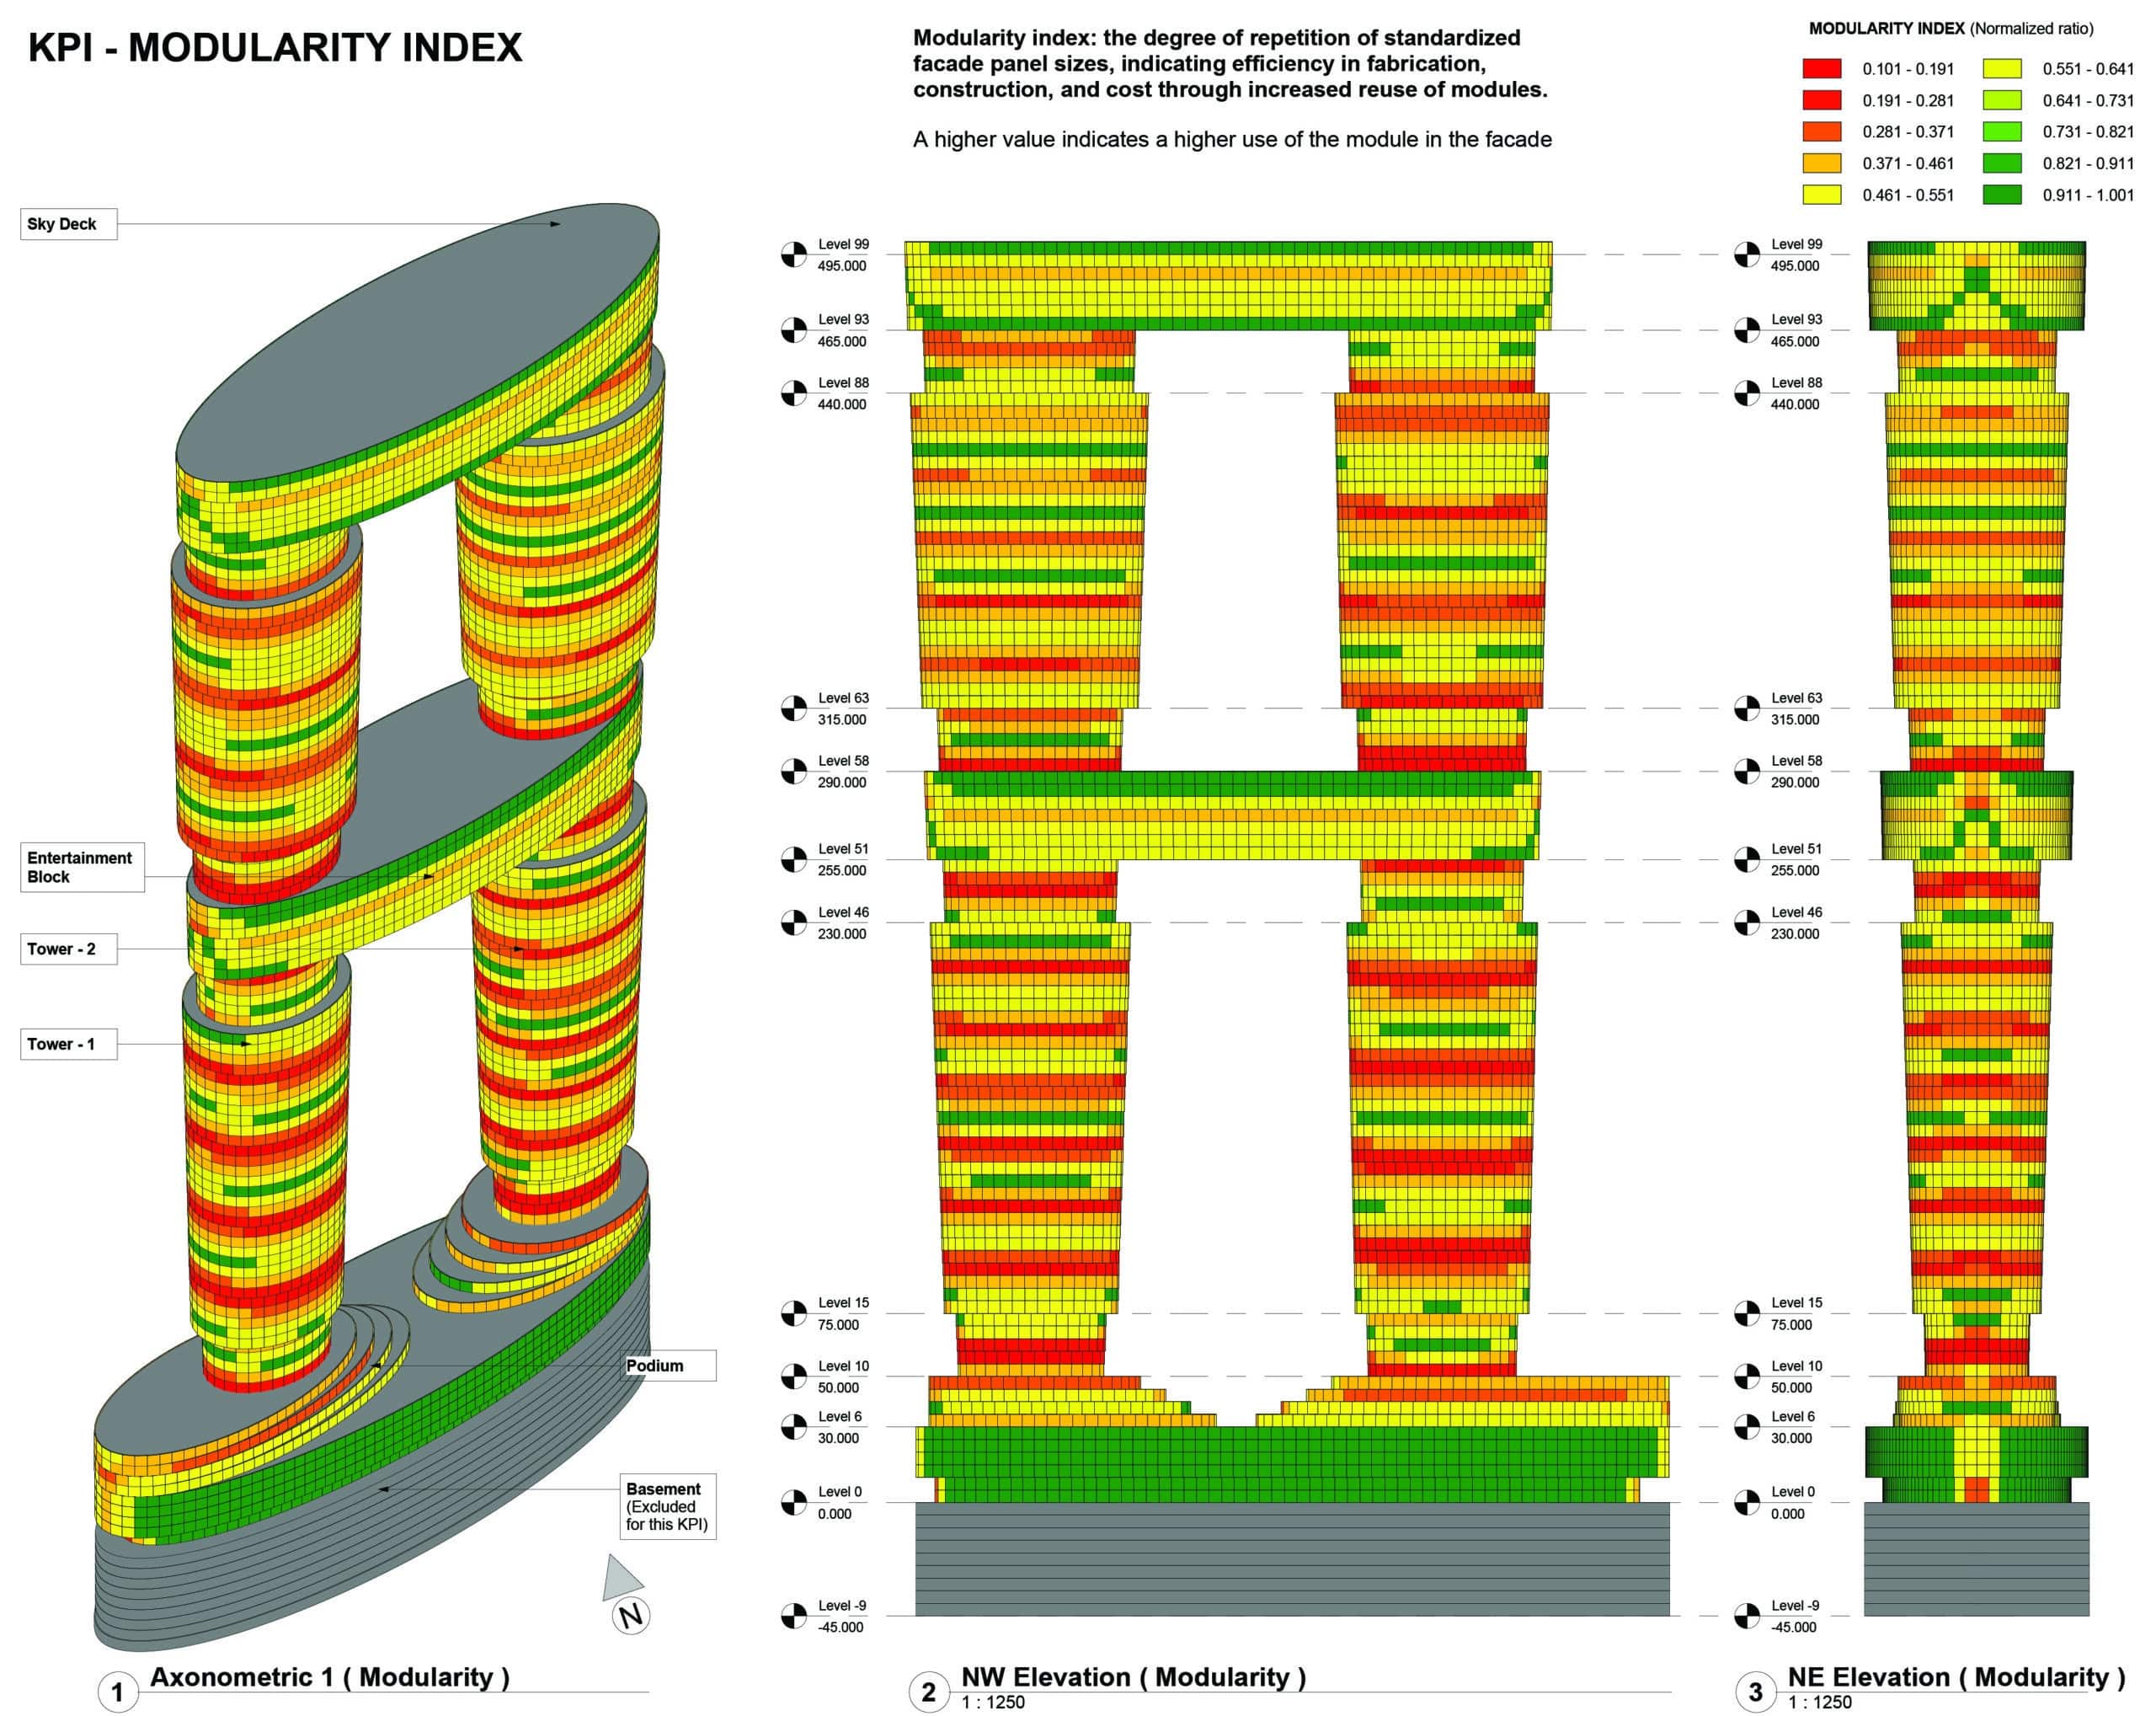
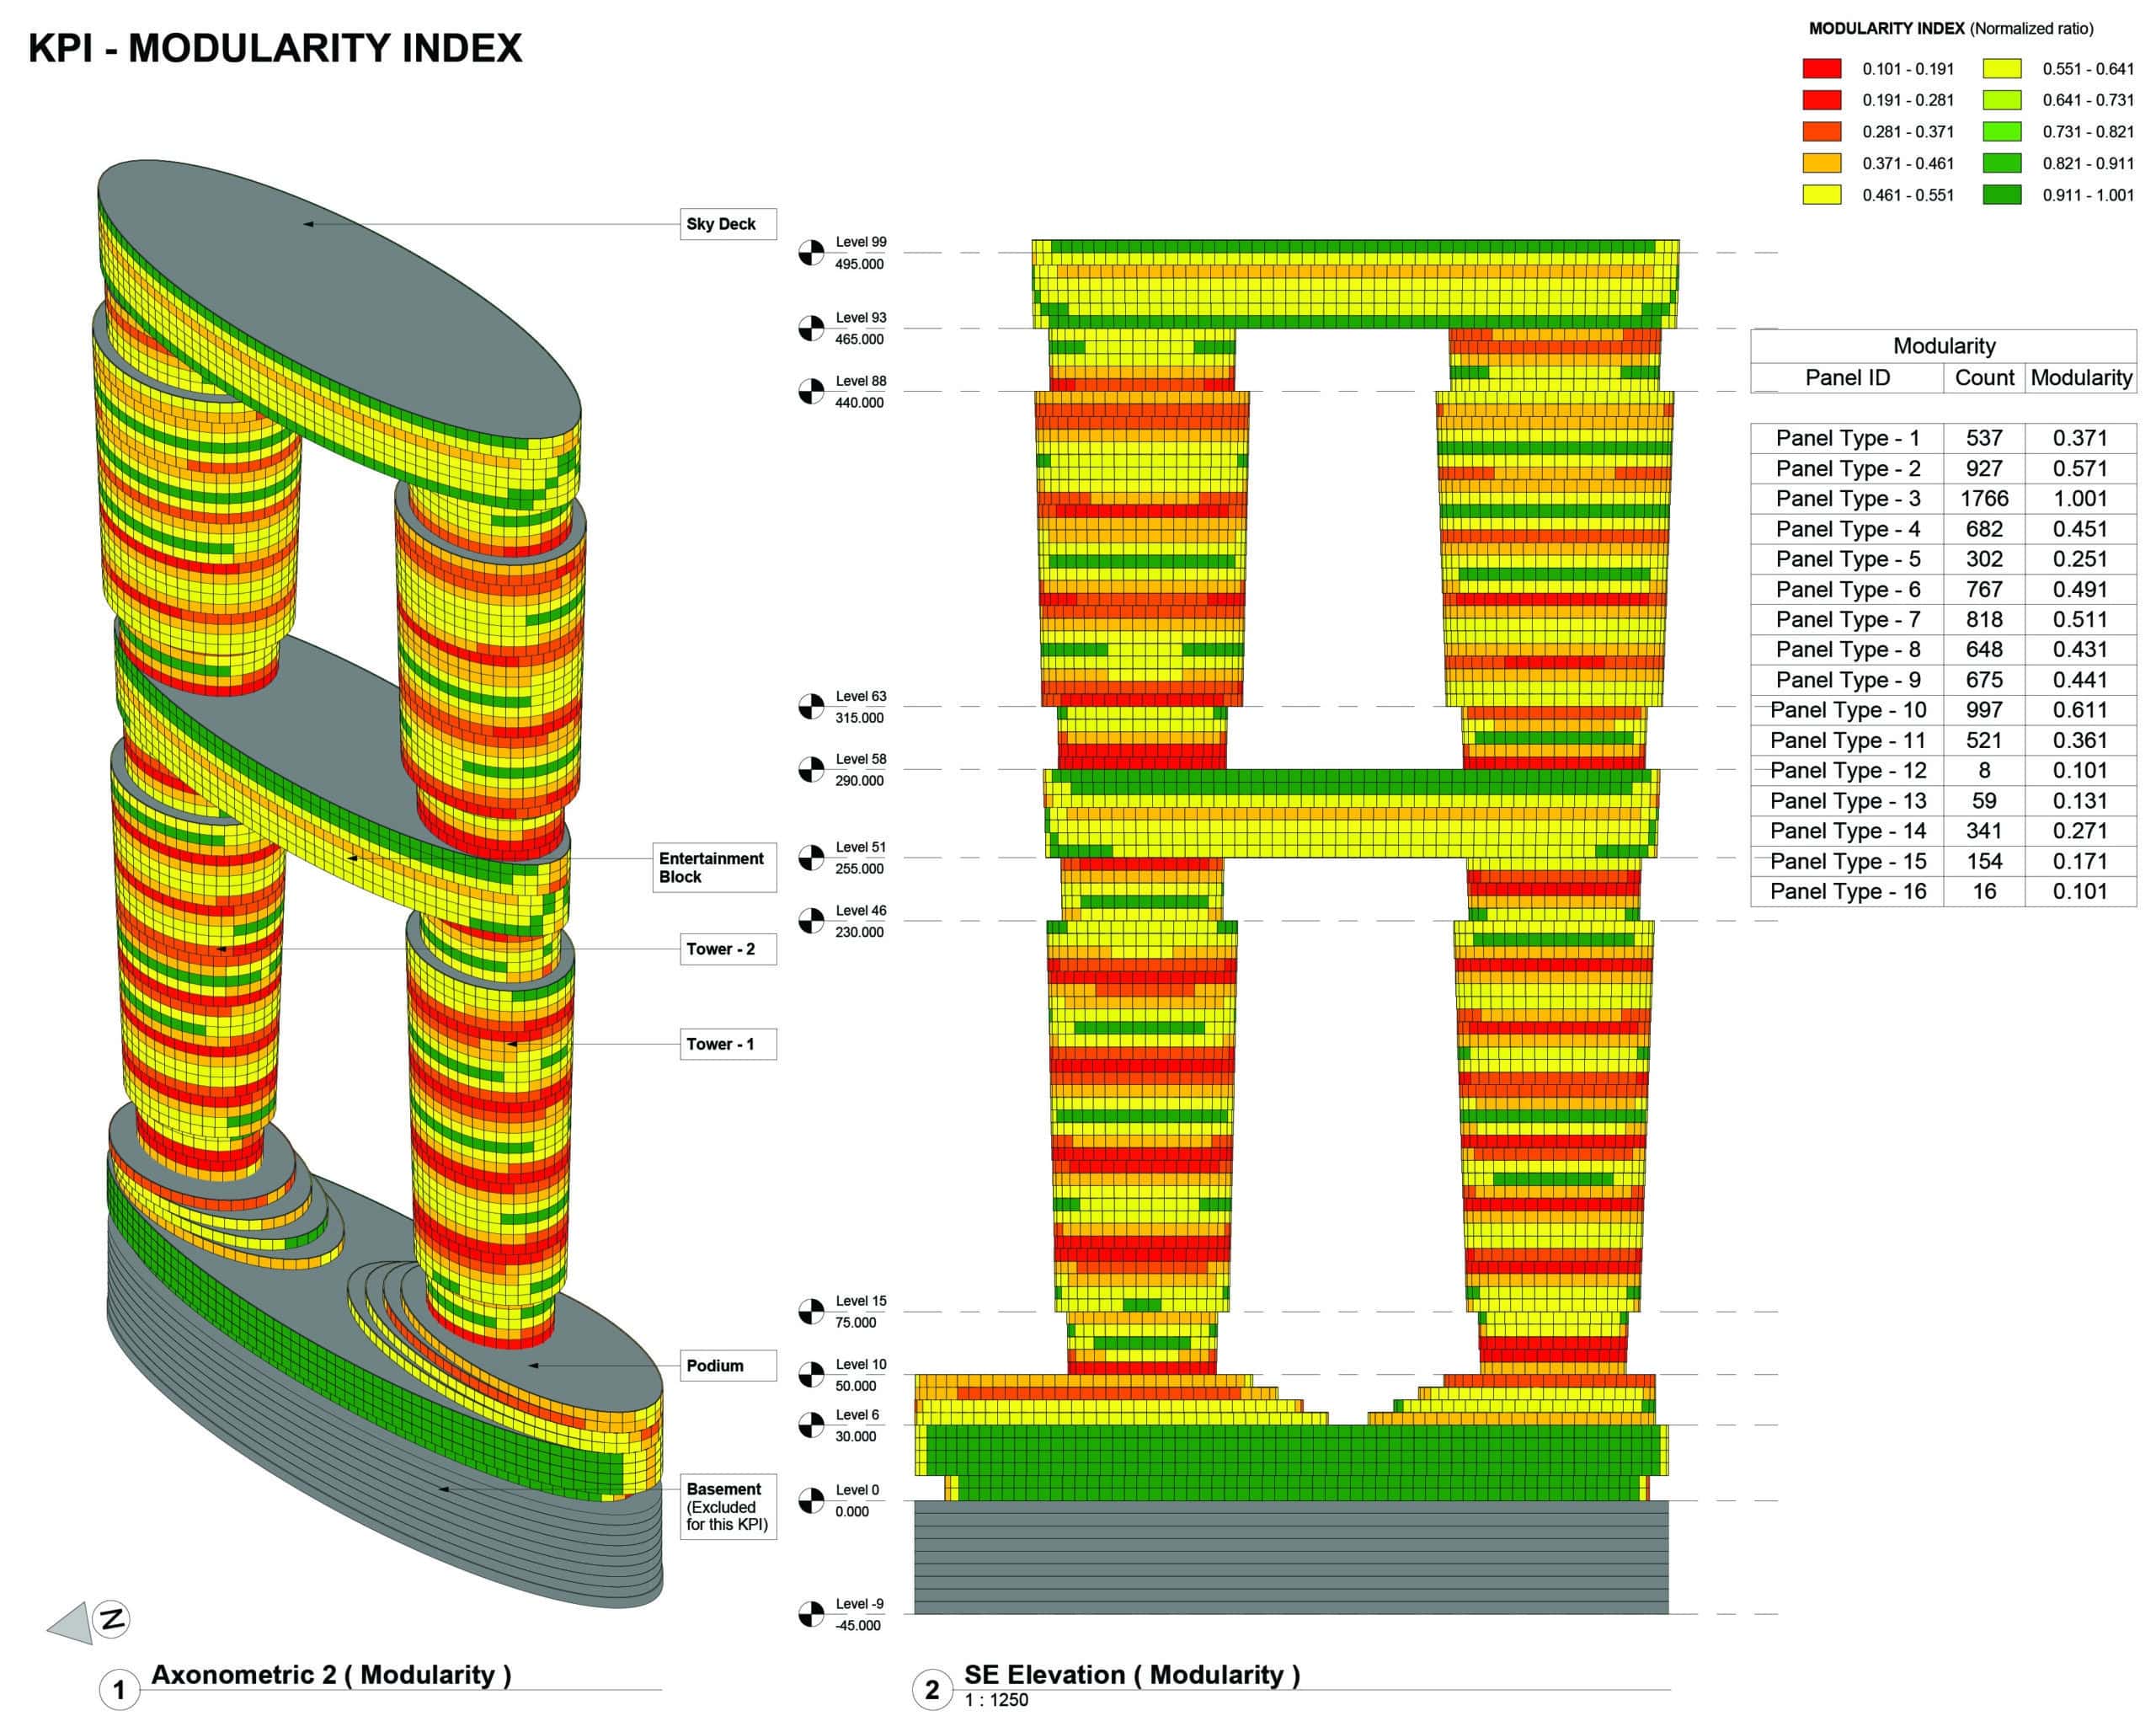
- Modularity-I: evaluates the degree of façade standardization based on panel typologies.
Façade Solar Analysis
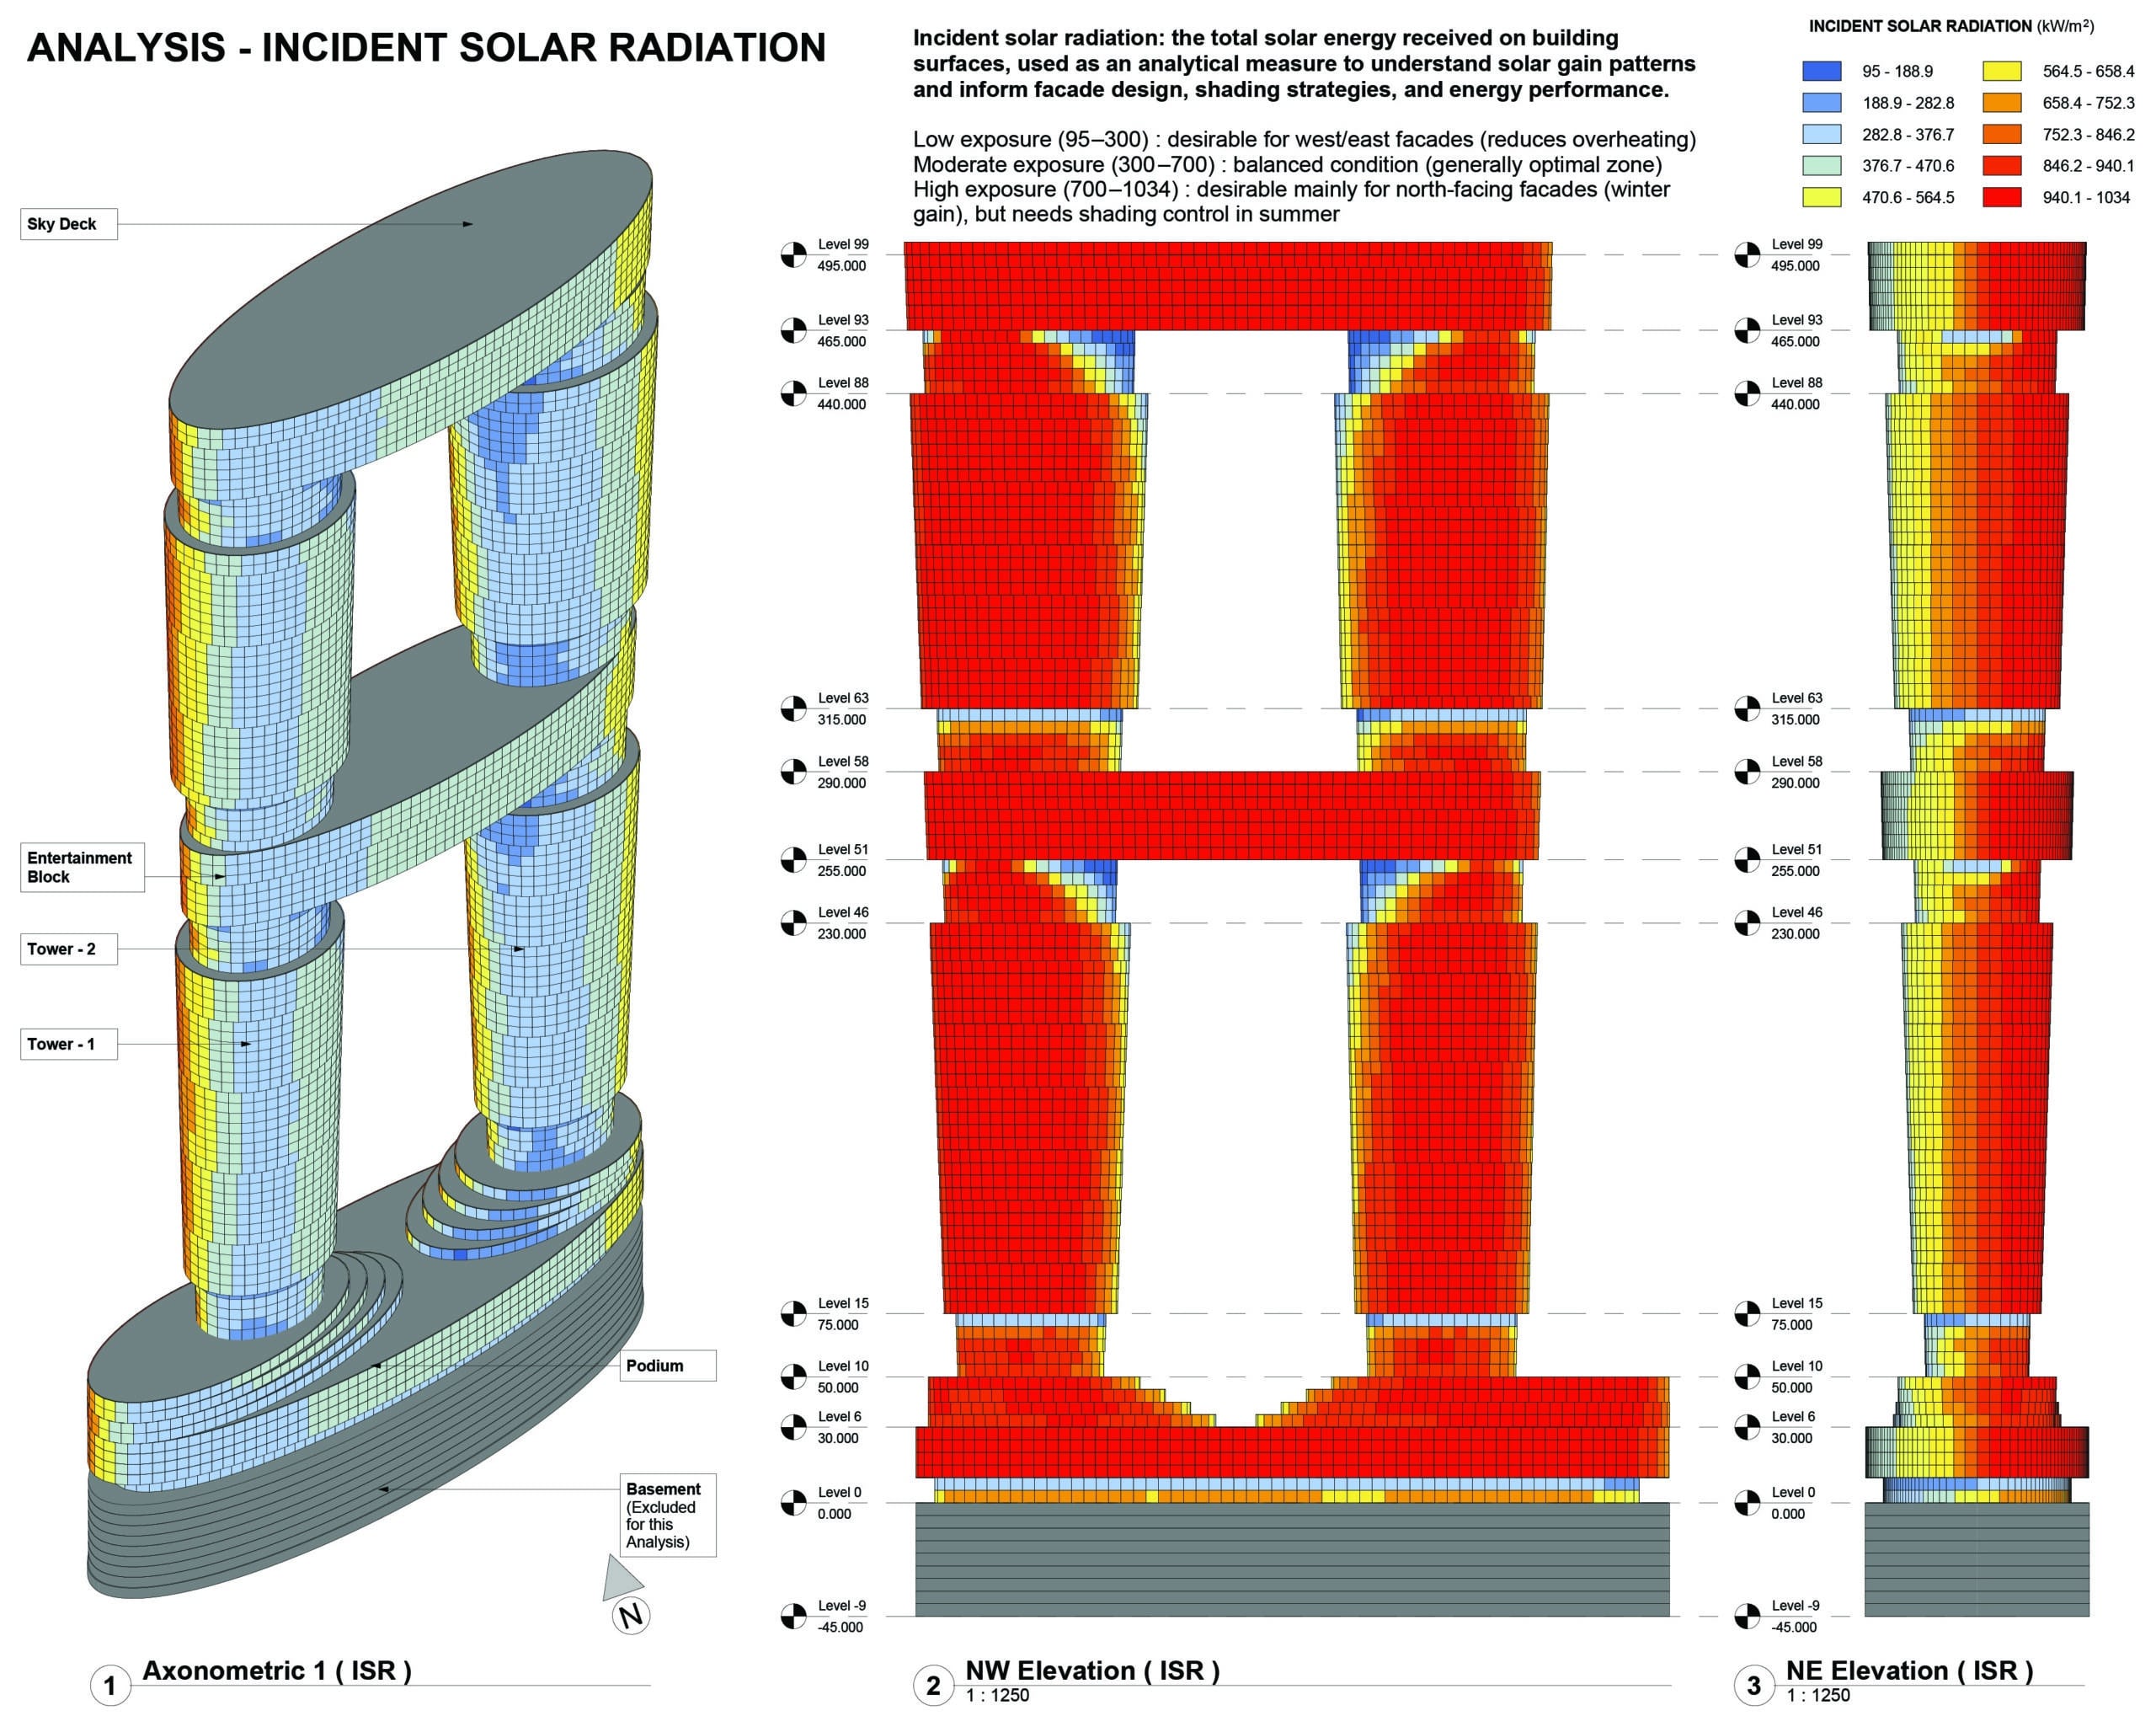
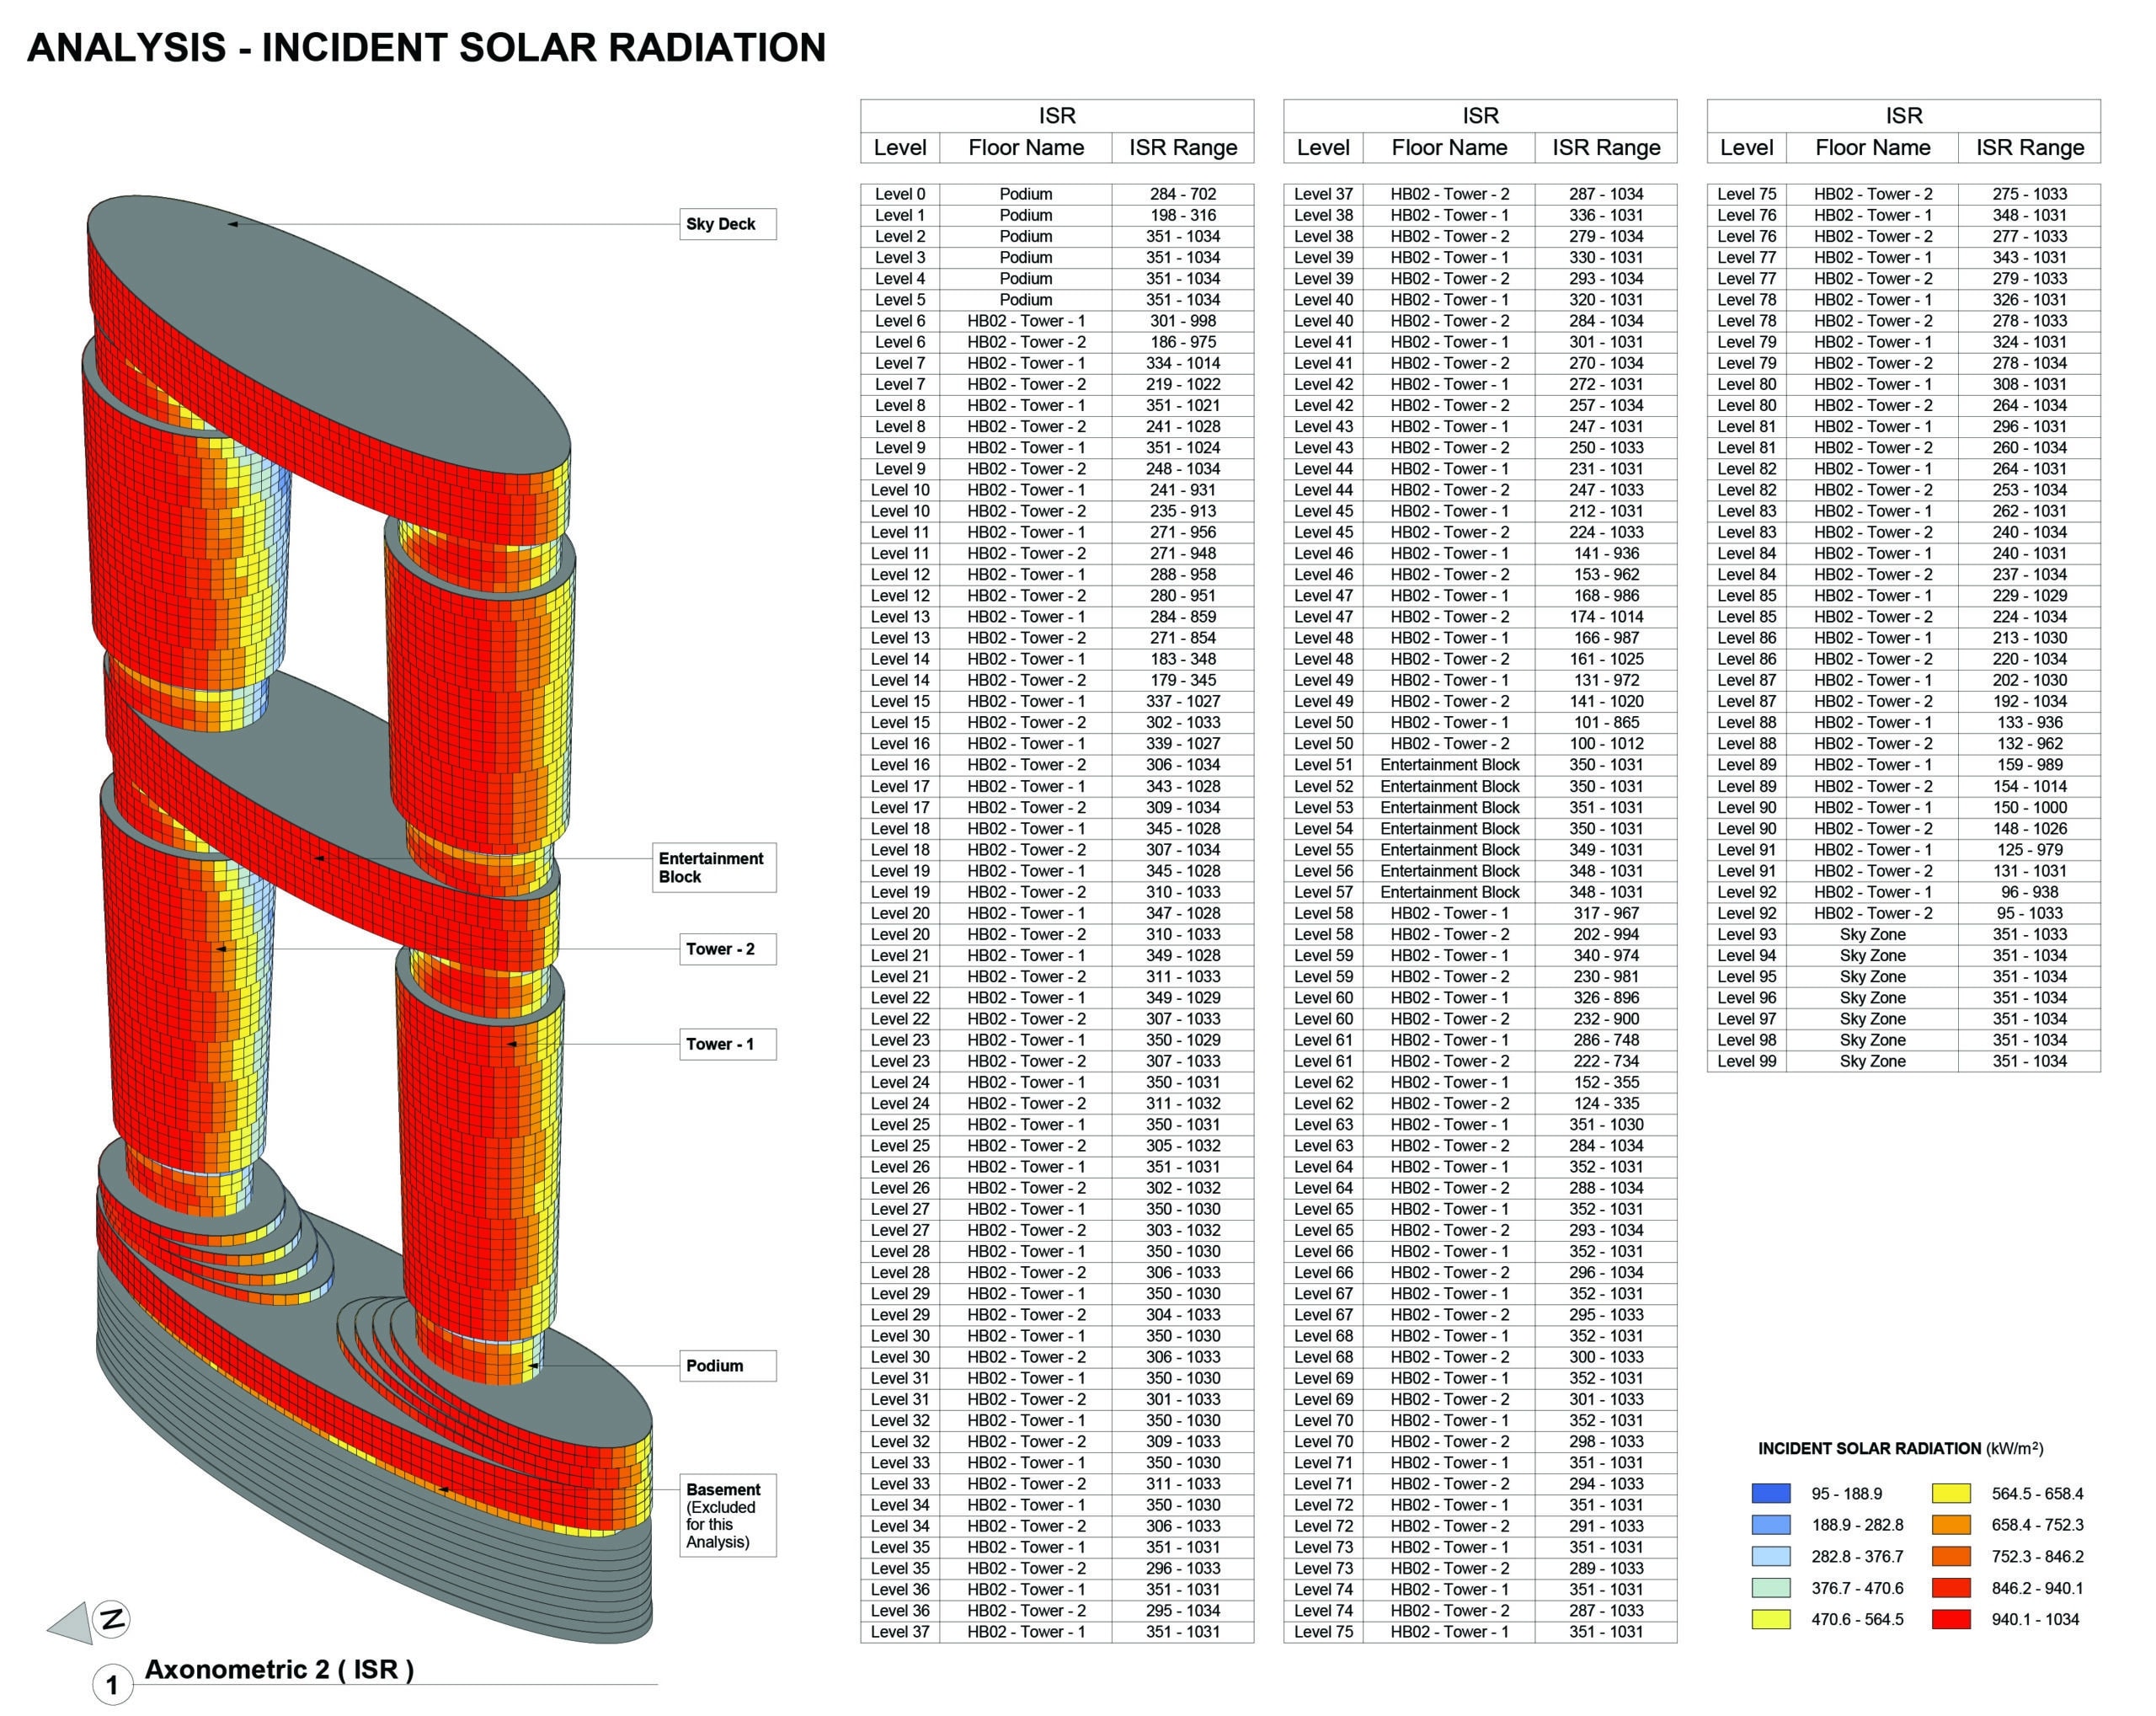
- ISR (Incident Solar Radiation): measures the total annual solar radiation received by façade surfaces.
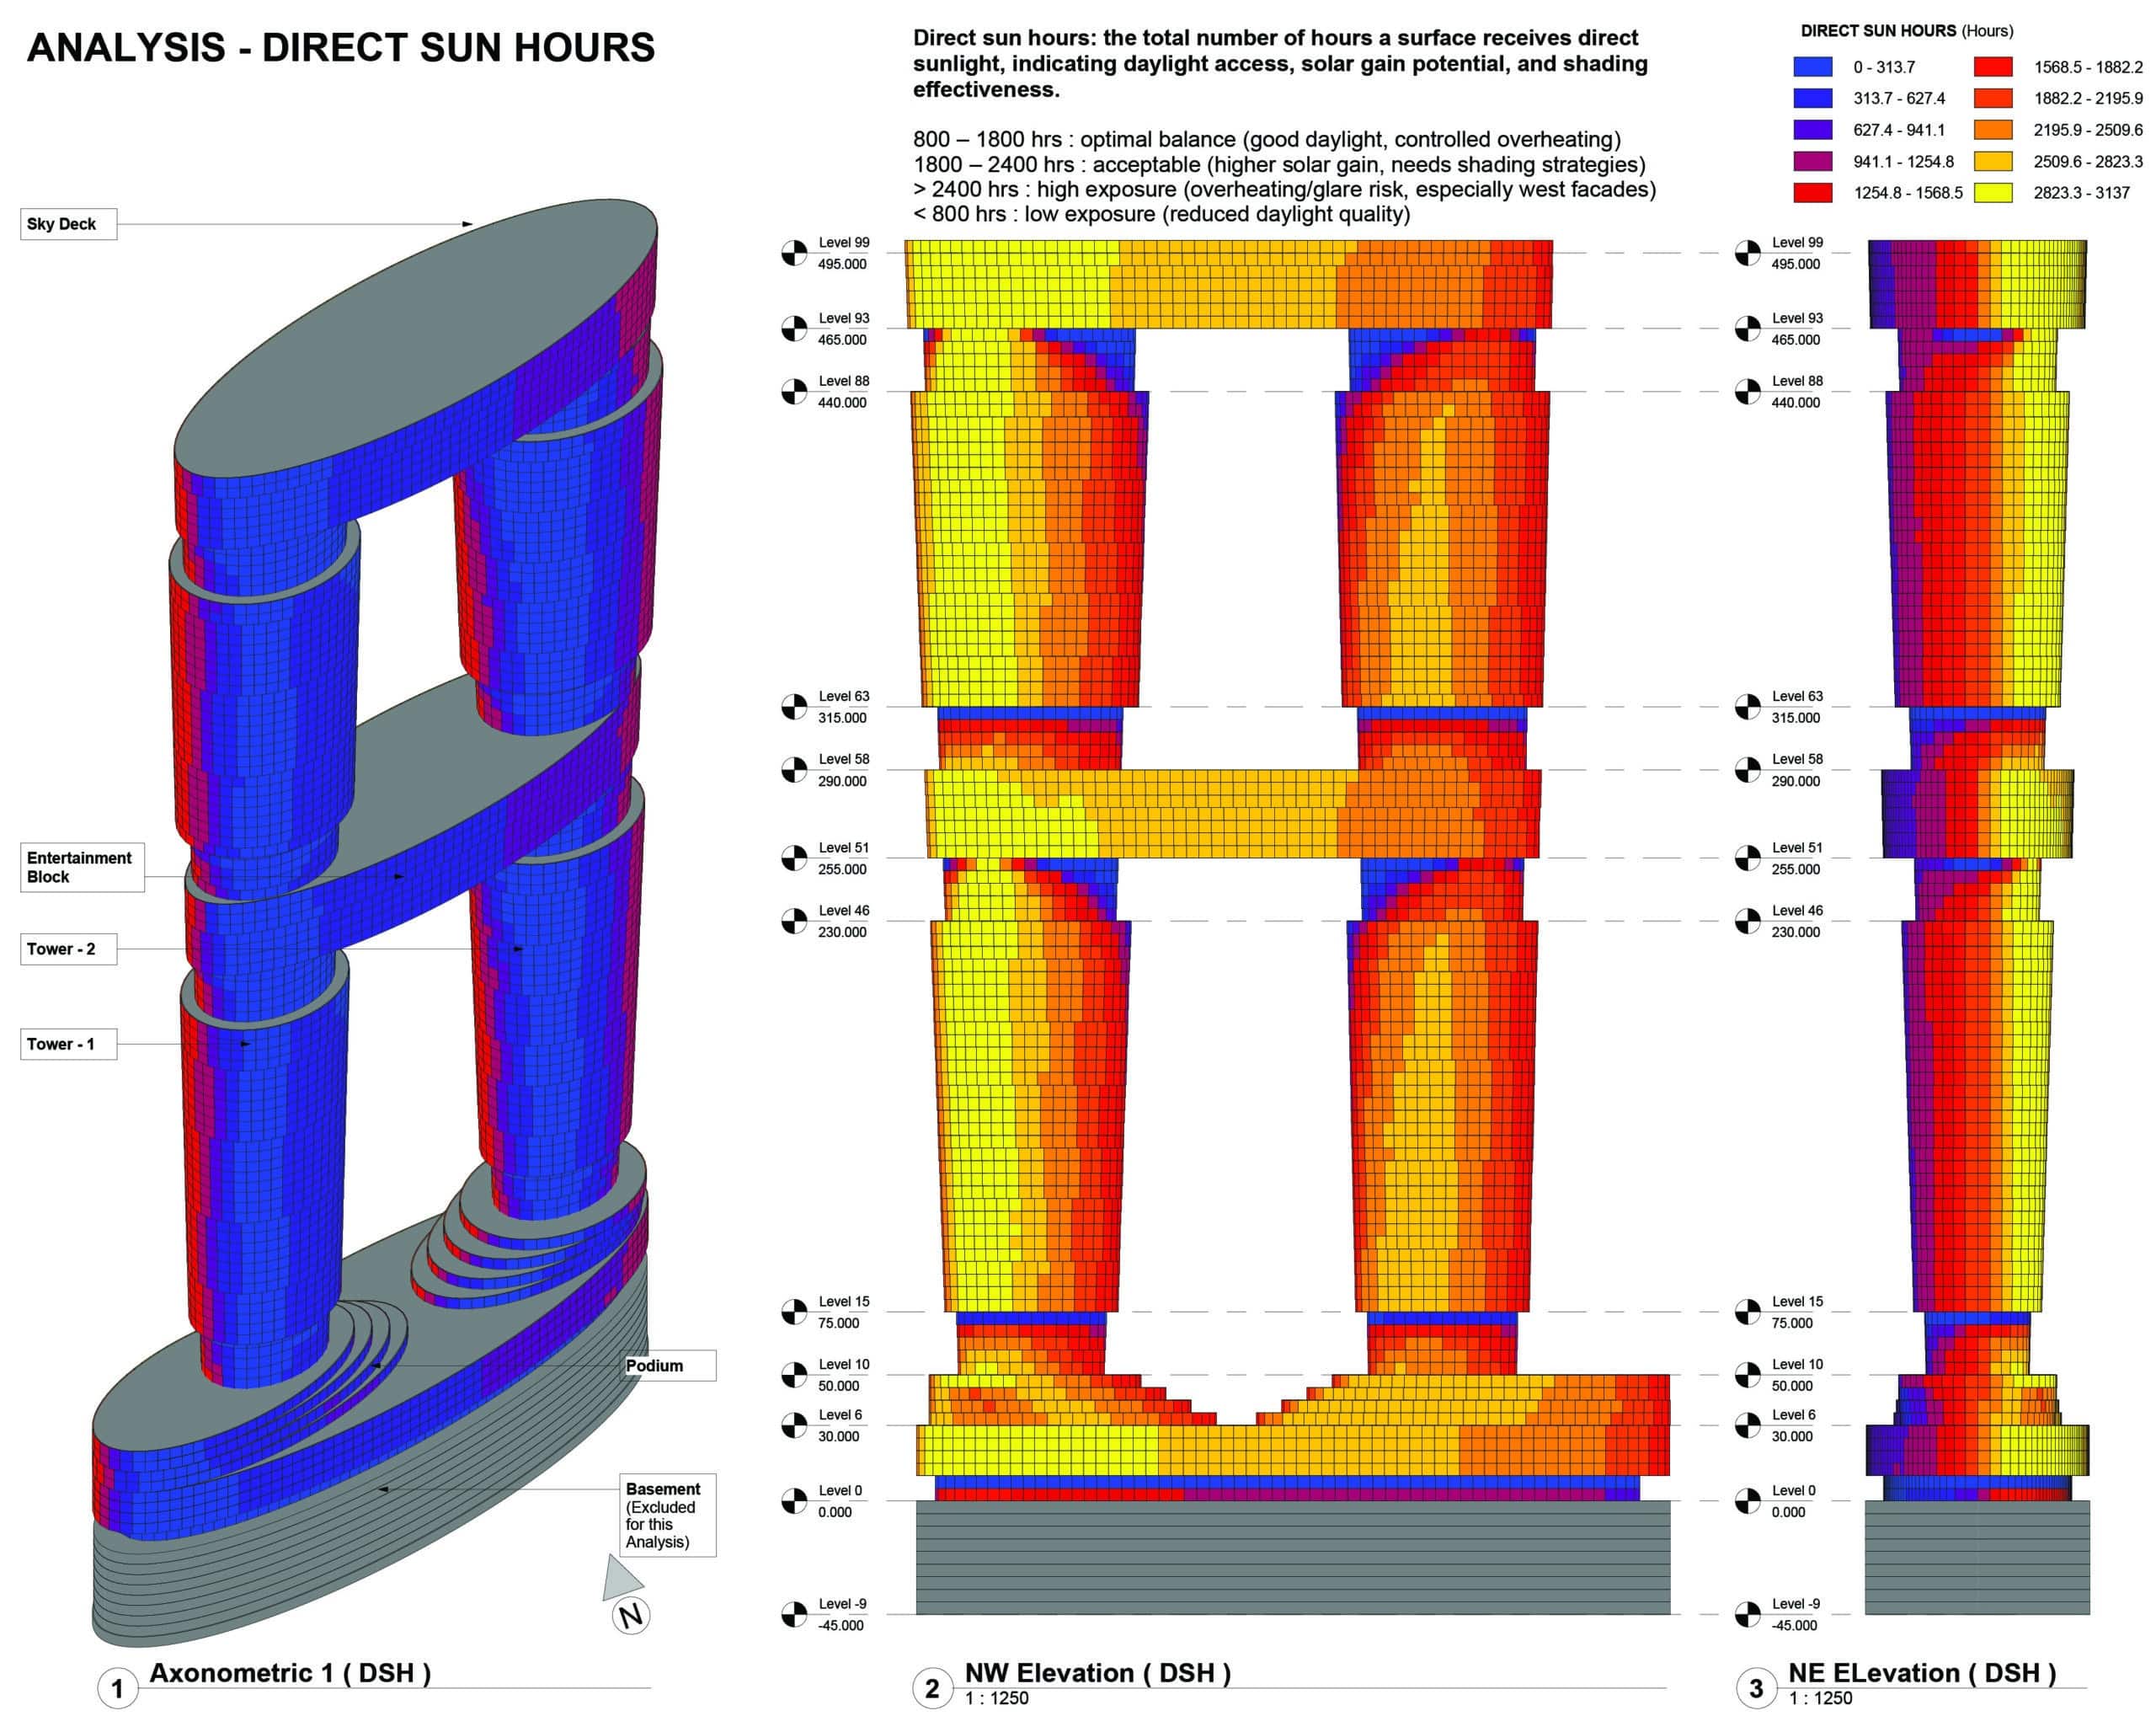
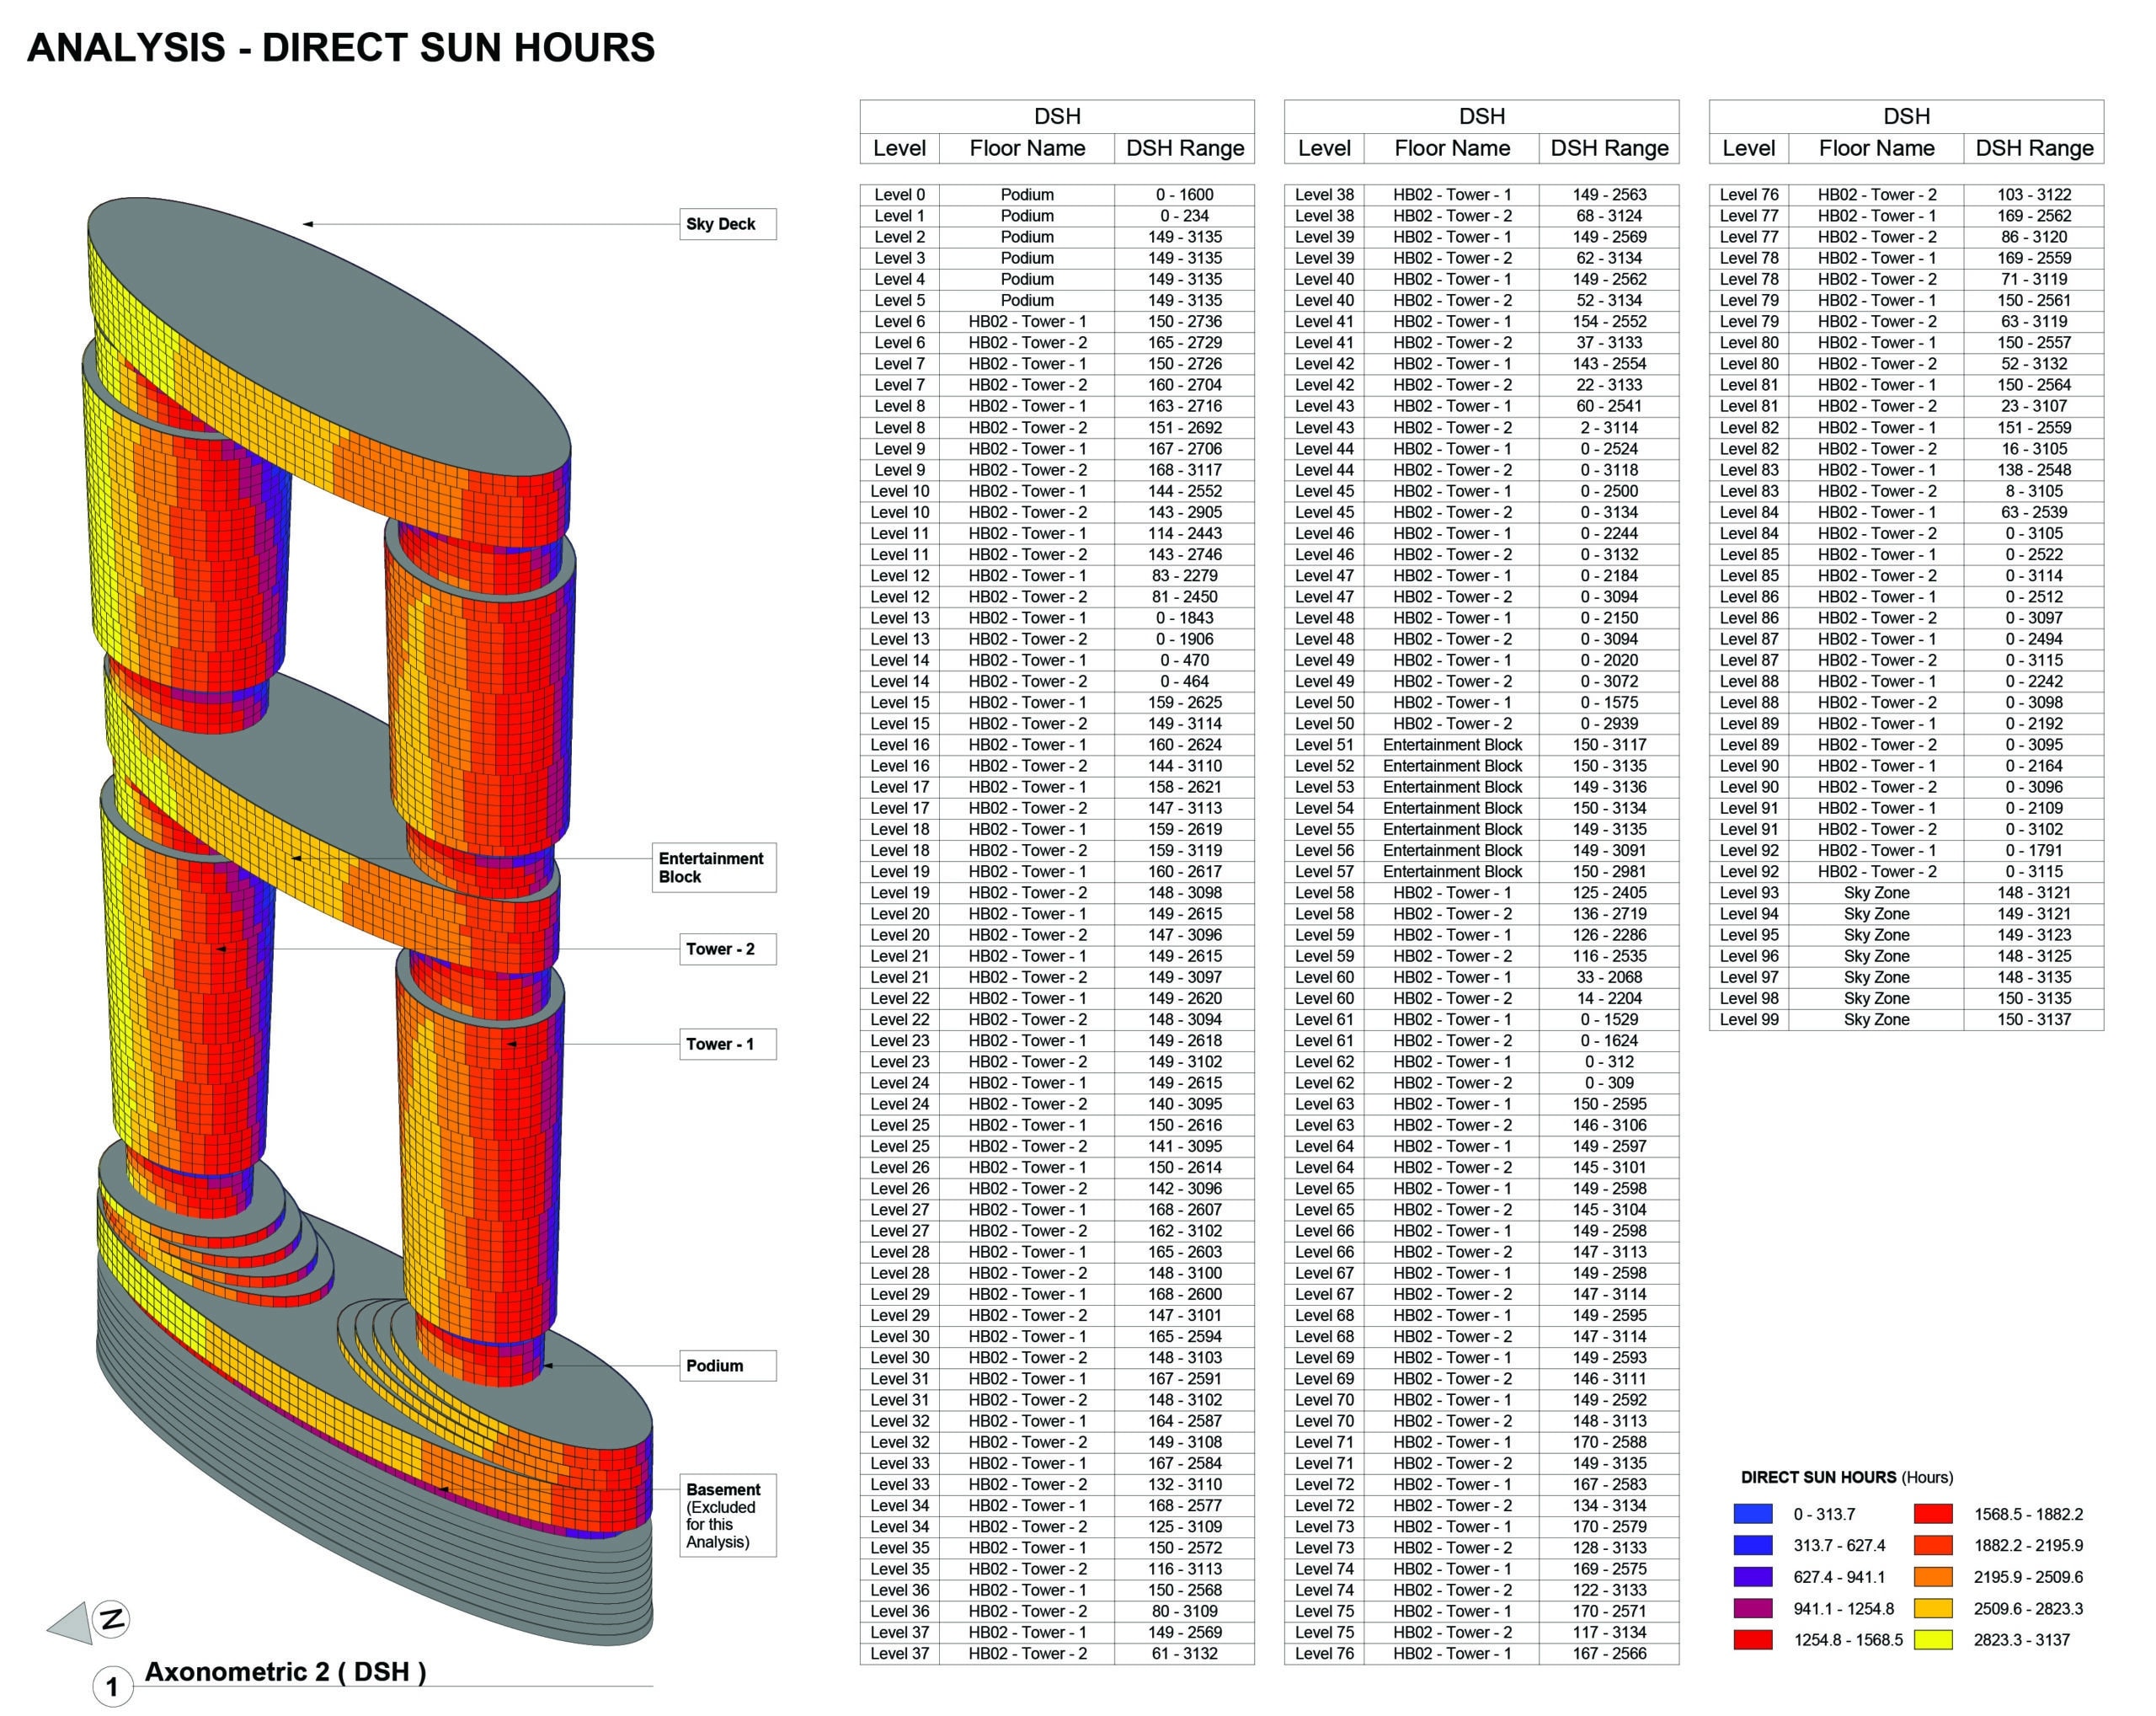
- DSH (Direct Sun Hours): measures the number of hours façade surfaces receive direct sunlight.
KPI Sheets
First, a summary of the building’s performance is presented. Then, each KPI is displayed on a specific sheet with views and a schedule.
1. Column-Free Area Ratio (CFAR)
2. Material Usage Intensity (MUI)
3. Effective Solar Exposure (ESE)
4. Direct Sunlight Availability (DSA)
5. Modularity Index (MI)
Analysis: Incident Solar Radiation (ISR)
Analysis: Direct Sun Hours (DSH)
From Data to Native Revit Documentation
The final output of the workflow is not a dashboard detached from the model. It is a coordinated documentation set where KPI values appear in schedules, diagrams, elevations, exploded views, and color-coded sheets. This gives designers and reviewers access to numerical information, visual interpretation, and architectural representation within the same Revit environment.
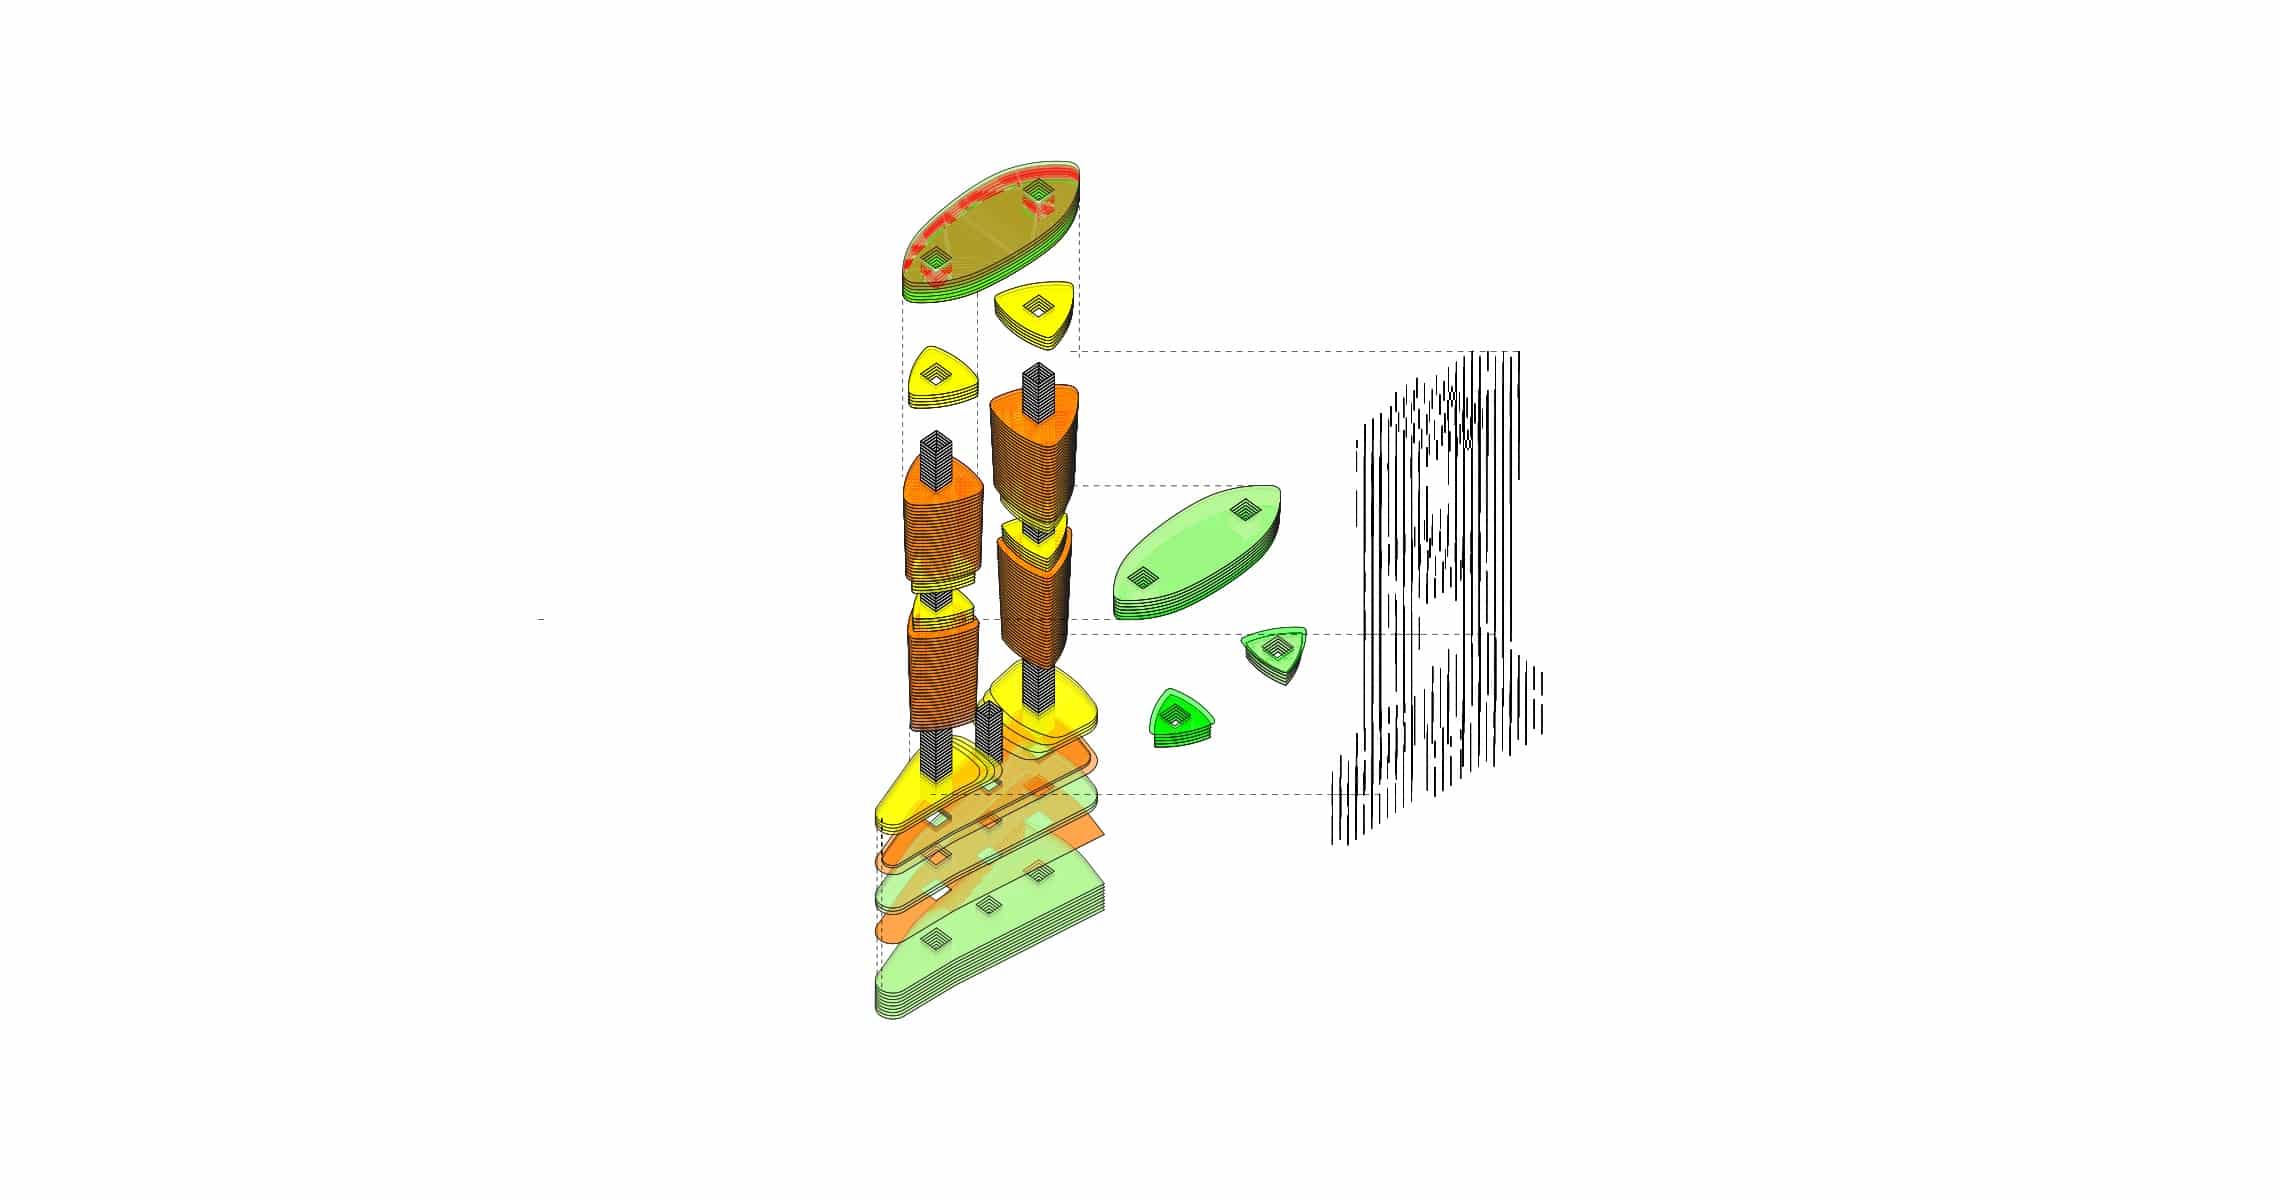
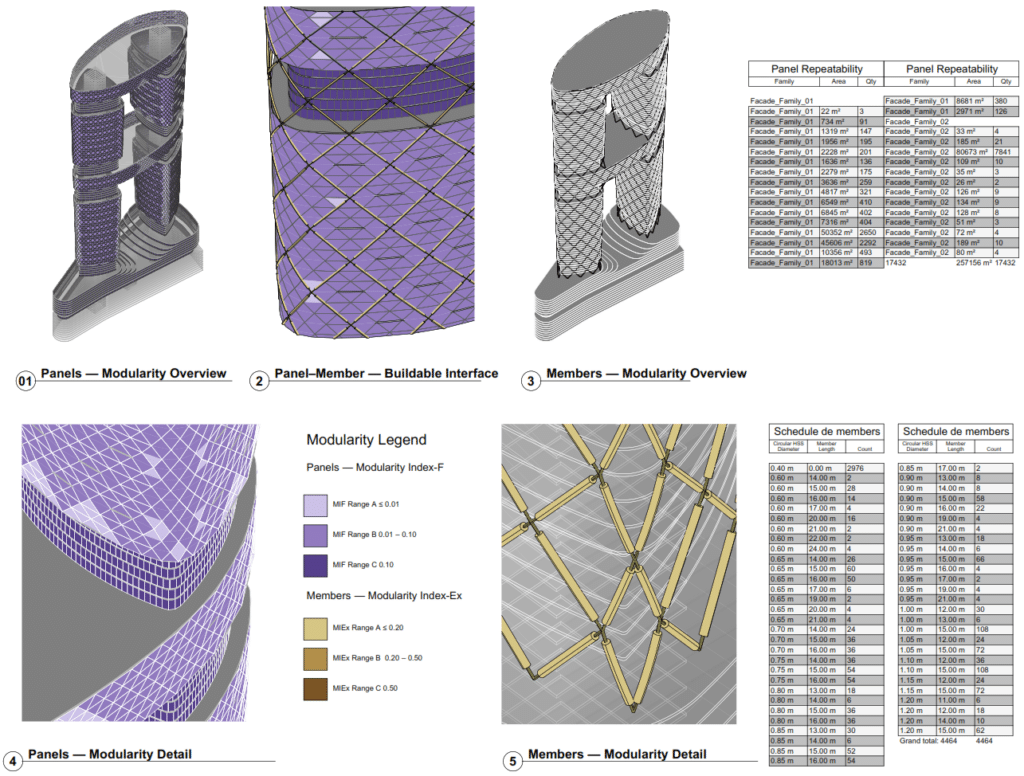
System Identification and Typology Logic
The workflow begins with a level-based volumetric abstraction used to compare KPI behavior across the building mass. Once the metrics are stabilized and validated through schedules, the process shifts toward a detailed model layer where naming systems, typology control, modularity, and constructibility can be documented natively in Revit.
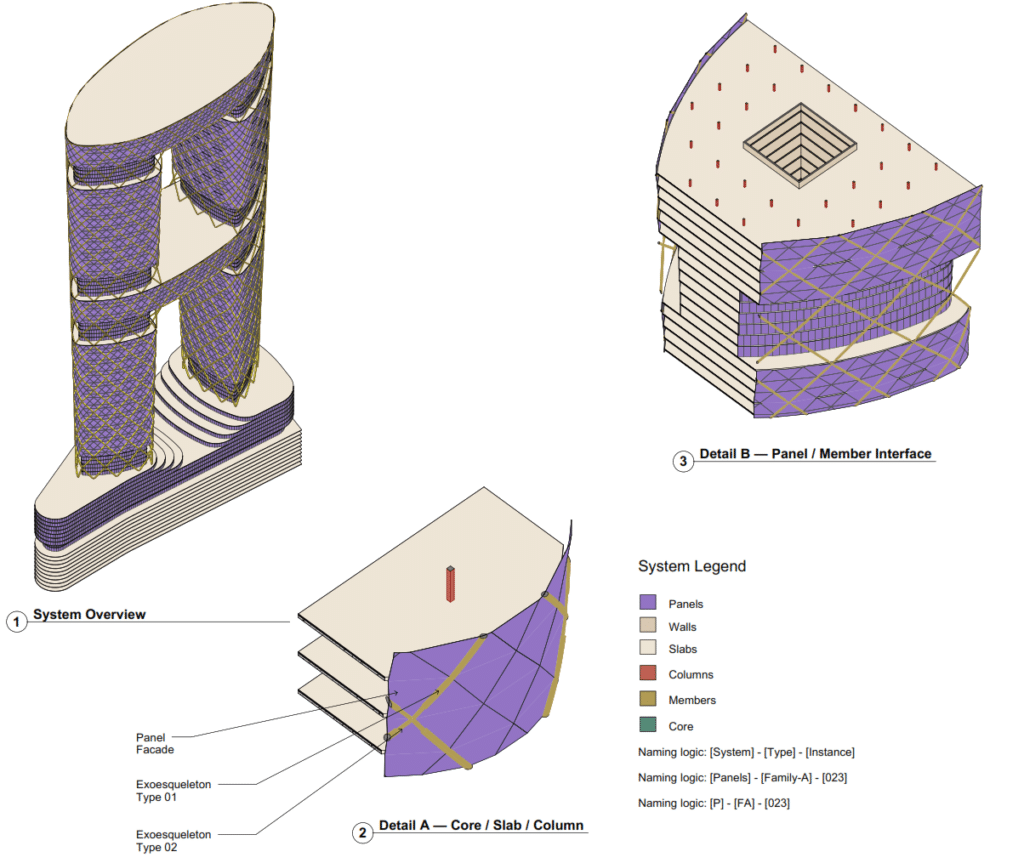
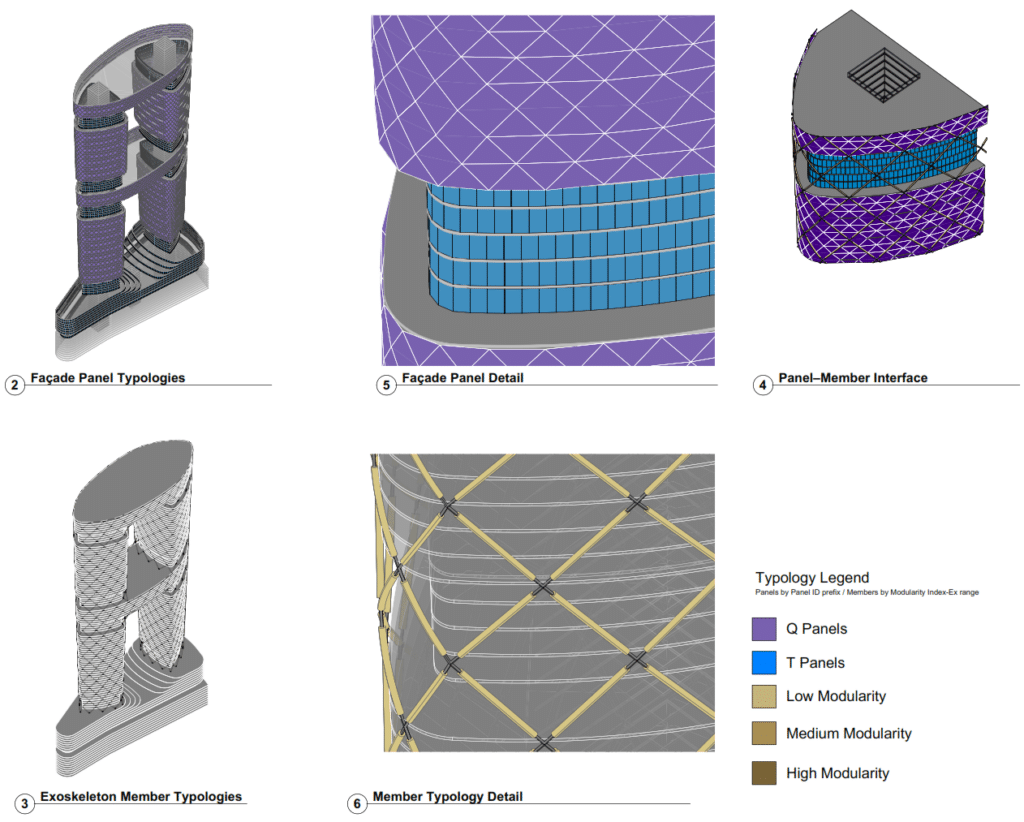
Modularity and Constructability Control
Workflow Success Criteria
Integration. Performance metrics become part of the BIM model.
Readability. The same data drives both visual interpretation and formal documentation.
Reliability. Structured parameter mapping improves consistency across outputs.
Current Limitations and Improvement Areas
The workflow still depends on robust parameter naming, consistent element association, and stable mapping between Grasshopper and Revit. Any mismatch in those structures can affect KPI assignment and documentation accuracy. In addition, current color visualization relies on predefined value ranges, which limits dynamic threshold control directly inside Revit.
Conclusion
Hyperbuilding 02 Data Team did not simply calculate metrics. It built a framework where KPI evaluation becomes interoperable, visual, and documentable. In that sense, the project demonstrates a key ambition of integrative modeling: not only to move geometry between platforms, but to move intelligence, criteria, and decision-making into the BIM model itself.
