
In this project, we leverage Graph Machine Learning to enhance fire safety analysis by predicting fire spread risk in building units using enriched IFC models and advanced graph algorithms.

Idea & Goal
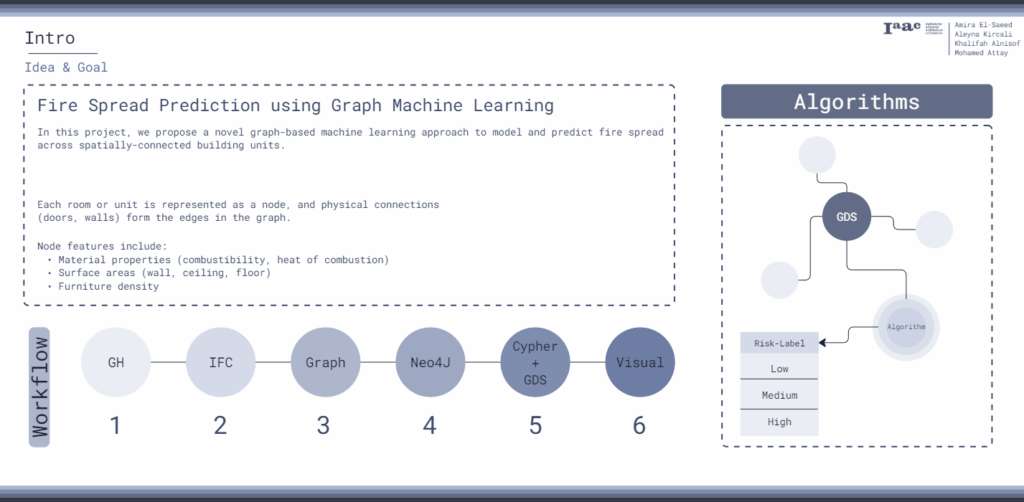
Our workflow begins in Grasshopper, where we configure building units and enrich the IFC model with custom fire-related attributes such as Material combustibility, reaction density & Rate of Spread Calculation
We then transform the IFC data into a graph structure, analyze it with Neo4j and Graph Data Science algorithms, and visualize the classified fire spread risk, providing a powerful, data-driven approach for spatial safety assessment
Creating the .ifc file
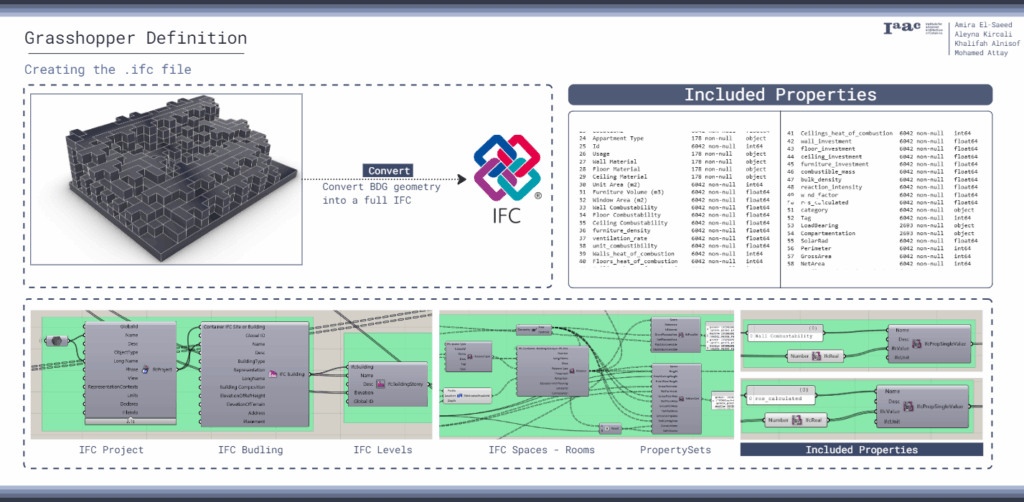
We use Grasshopper to generate the building geometry and seamlessly convert it into a full IFC model, embedding all spatial and relational data required for advanced analysis.
Custom fire-related properties—such as combustibility, material heat of combustion, and furniture intensity—are programmatically added to each unit, ensuring our IFC file contains all relevant features for graph-based prediction.
IFC Output
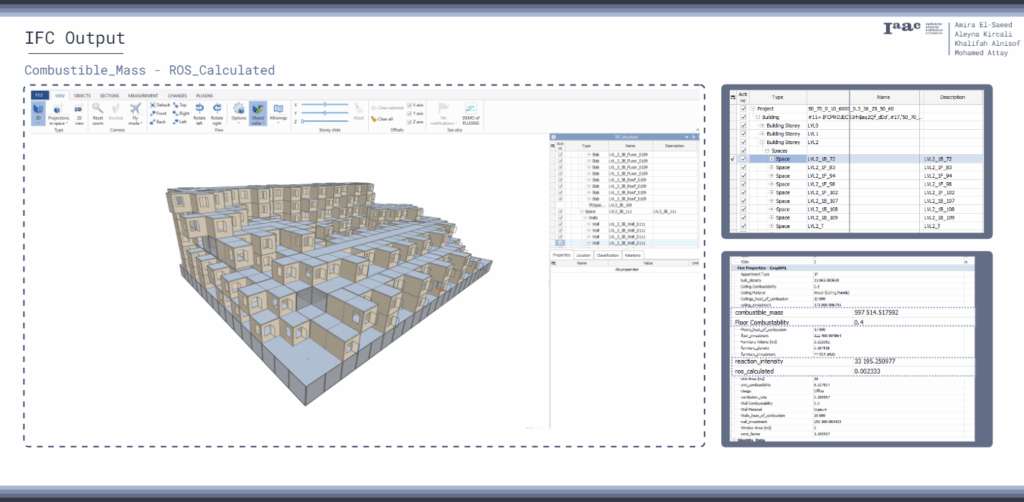
The resulting IFC output provides a detailed representation of each unit, complete with our custom attributes like combustible mass and calculated rate of spread.”
This enriched IFC structure forms the backbone of our workflow, enabling us to extract both geometric and semantic information necessary for accurate graph construction and subsequent fire risk classification.
Creating Graph
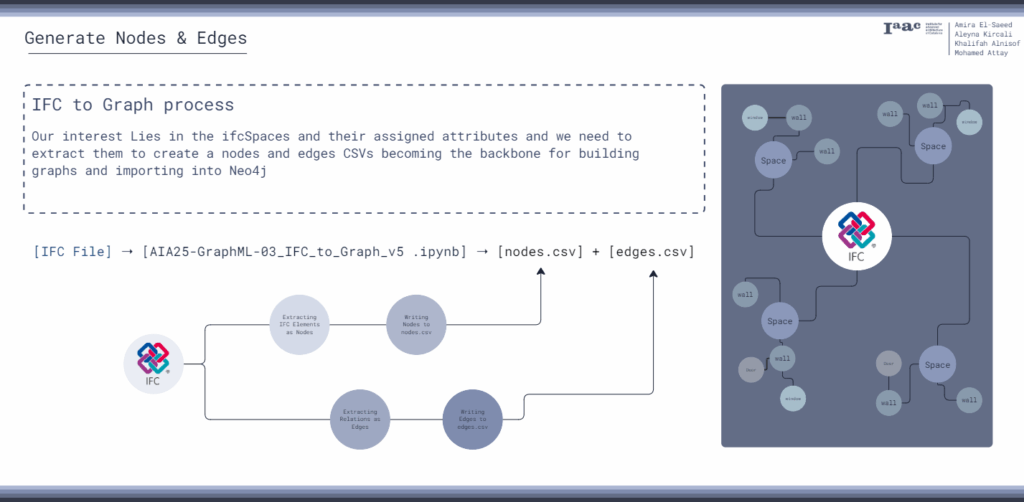
To enable graph-based analysis, we extract relevant information from IFC spaces and their properties, converting the model into nodes and edges CSV files.
This process captures both the spatial relationships—such as walls and doors—and all custom fire attributes specially attached to Ifc spaces, to lay the foundation for a robust, data-driven graph structure.
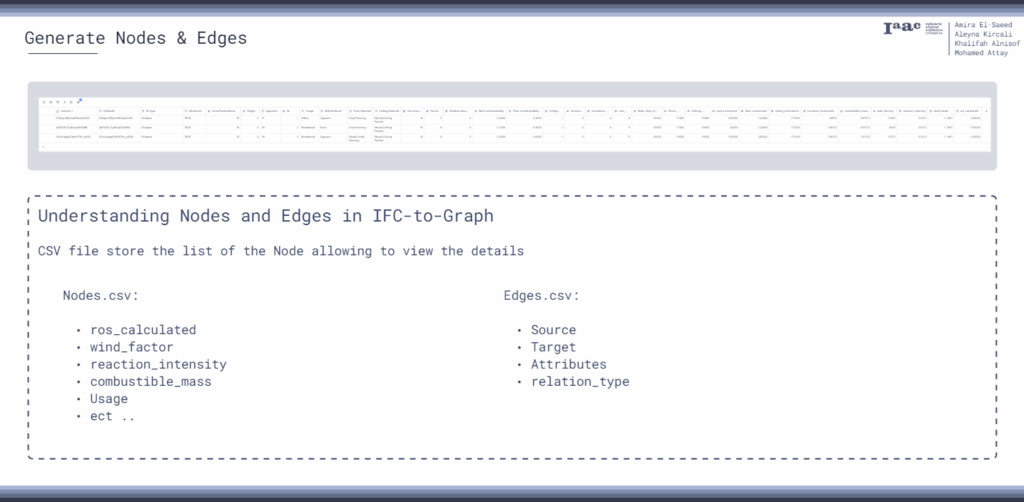
- Each node in our CSV represents a building unit and includes detailed fire-related features like rate of spread, wind factor, and combustible mass.
- Edges define the physical or functional connections between units, allowing us to structurally represent how fire could potentially propagate throughout the building.
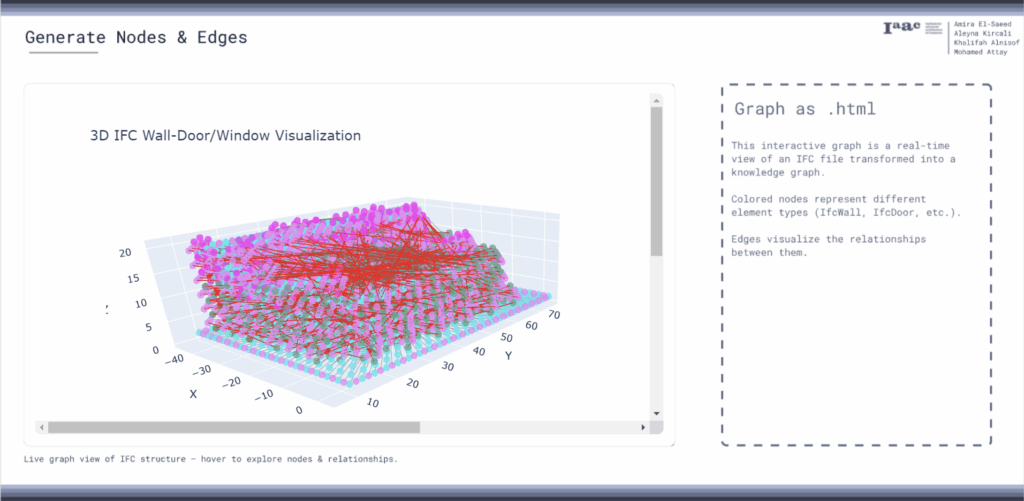
We visualize the building’s graph structure in an interactive 3D environment, where each node and edge reflects spatial elements and their relationships from the IFC model.
- This .html graph enables us to intuitively explore how different units are interconnected, providing immediate insights into possible pathways for fire propagation.
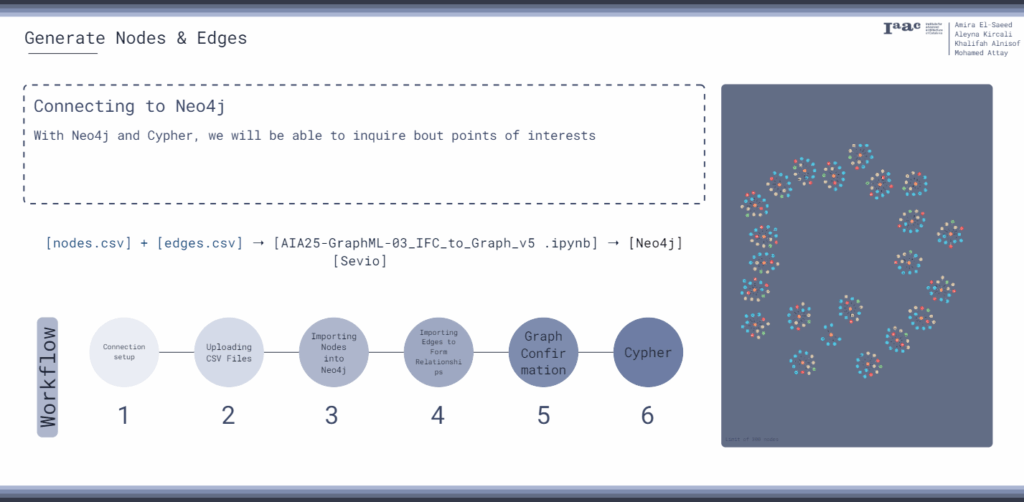
By importing our nodes and edges into Neo4j, we unlock the ability to perform advanced graph queries and analytics using Cypher.
This seamless workflow transforms our architectural data into a powerful knowledge graph, setting the stage for deeper exploration and machine learning-driven risk assessment.
Graph Data Science
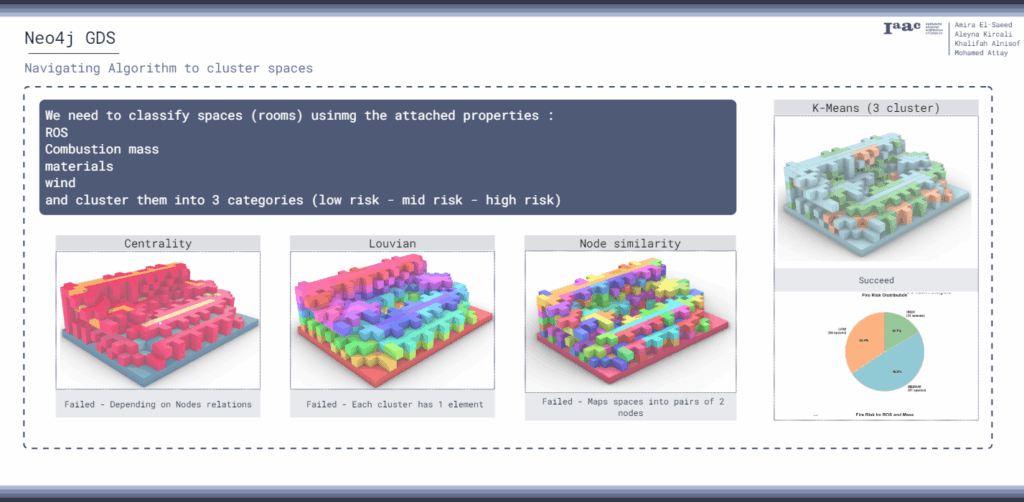
- We tested several graph algorithms within Neo4j’s GDS to cluster rooms by fire risk, using properties such as rate of spread, combustible mass, and wind factor.”
- Centrality failed because it measures the importance of nodes based on their connections rather than their individual attributes, making it unsuitable for property-based clustering; similarly, Louvain and node similarity did not produce meaningful groupings for our fire risk classification.
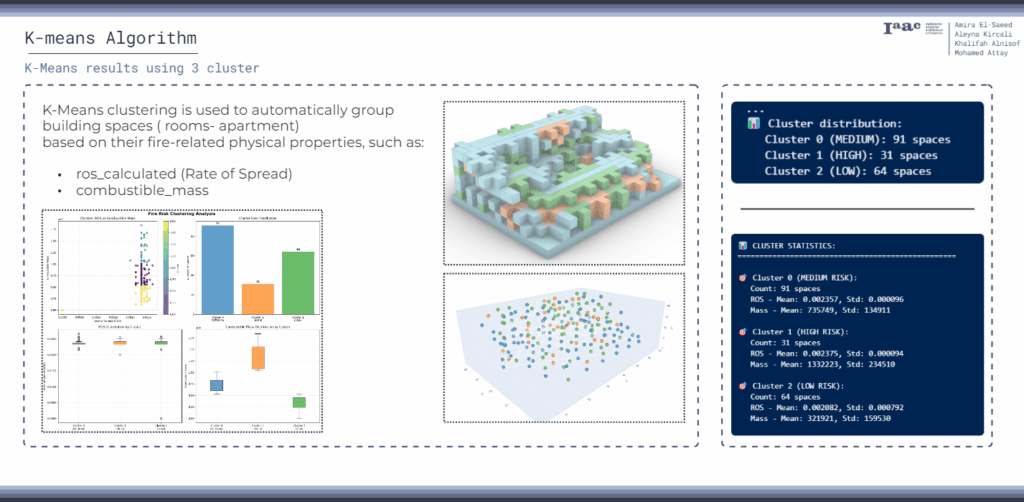
K-means clustering succeeded by grouping spaces solely according to their fire-related attributes, resulting in three distinct clusters representing high, medium, and low fire risk.
This approach enabled us to spatially visualize and quantify fire spread risk across the building, providing actionable insights directly linked to our custom unit properties.
Back To Rhino
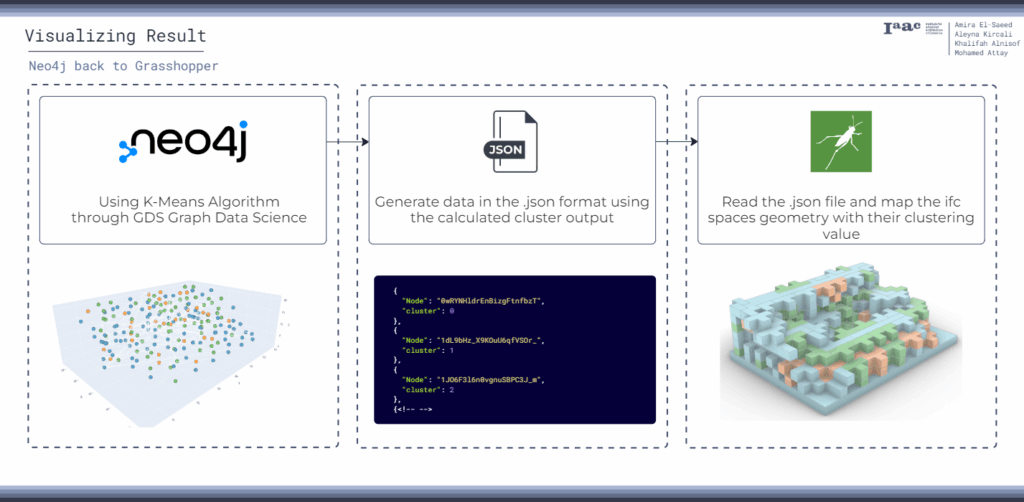
- After running the K-Means clustering algorithm in Neo4j, we export the resulting cluster assignments as a JSON file.
- This data is then imported back into Grasshopper, where we map each IFC space to its corresponding fire risk category for seamless spatial visualization.
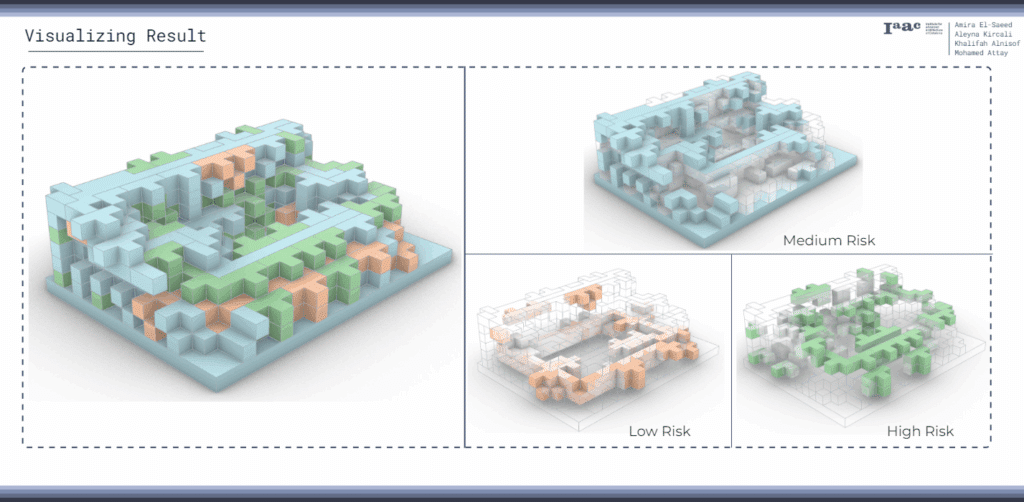
- we visualize the classified fire risk directly on the building geometry, with each color-coded unit representing low, medium, or high risk.
- This workflow provides an intuitive and actionable overview of fire spread risk across the entire building, supporting informed design and safety decisions.
